Quantifying Local Randomness in Human DNA and RNA Sequences Using Erdös Motifs
Abstract
In 1932, Paul Erdös asked whether a random walk constructed from a binary sequence can achieve the lowest possible deviation (lowest discrepancy), for the sequence itself and for all its subsequences formed by homogeneous arithmetic progressions. Although avoiding low discrepancy is impossible for infinite sequences, as recently proven by Terence Tao, attempts were made to construct such sequences with finite lengths. We recognize that such constructed sequences (we call these “Erdös sequences”) exhibit certain hallmarks of randomness at the local level: they show roughly equal frequencies of subsequences, and at the same time exclude the trivial periodic patterns. For the human DNA we examine the frequency of a set of Erdös motifs of length-10 using three nucleotides-to-binary mappings. The particular length-10 Erdös sequence is derived by the length-11 Mathias sequence and is identical with the first 10 digits of the Thue-Morse sequence, underscoring the fact that both are deficient in periodicities. Our calculations indicate that: (1) the purine (A and G)/pyridimine (C and T) based Erdös motifs are greatly underrepresented in the human genome, (2) the strong(G and C)/weak(A and T) based Erdös motifs are slightly overrepresented, (3) the densities of the two are negatively correlated, (4) the Erdös motifs based on all three mappings being combined are slightly underrepresented, and (5) the strong/weak based Erdös motifs are greatly overrepresented in the human messenger RNA sequences.
keywords: Erdös discrepancy problem; human genome; DNA motifs; local randomness;
1 Introduction
The DNA sequences constituting the human genome are a product of long evolutionary history, with sequence altering processes such as whole-genome duplication (Ohno et al., 1968; Wolfe, 2001), regional (segmental) duplication (Bailey et al., 2002), inversions (Flores et al., 2007), insertion of foreign DNAs (Smit, 1996; Cordaux and Batzer, 2009), insertion of mitochondrial DNA to nuclear genome (Timmis et al., 2004; Richly and Leister, 2004), local insertions and deletions (Cooper and Krawczak, 1991; Mills et al., 2006; Payseur et al., 2010), and most familiar to all, point mutations (Carlson, 2011).
Given our knowledge of these evolutionary processes, one might imagine a project to computationally simulate the DNA sequence changes (e.g. (Li, 1992; Koroteev and Miller, 2011)). However, there is a tremendous challenge in choosing the correct model parameter values (Li, 2011), in modelling the natural selection (Bustamante et al., 2005), in putting the model in the context of diploid with recombination (Duret and Arndt, 2008), and in a population (Hartl and Clark, 1997). Point mutations lead to lesser destruction of the genome than larger-scale changes, thus are more likely to survive to the next generation. Many point mutations manifest as neutral mutations (Kimura, 1983). If the point mutations dominate, the DNA sequences would become more and more random.
There has been a debate on whether DNA sequences from the human genome should be considered to be random (IHGSC, 2001; Clay and Bernardi, 2001; Li et al., 2002). If the DNA sequence from a complete chromosome is examined from one end to another, everybody agrees it is not consistent with independent and identically distributed (iid) random variables (Bernardi, 2001). It was known that genome contains large domains with alternating high and low GC content called isochores (Bernardi et al., 1985). Spectral analysis also confirmed that genome sequences are not white noise (Voss, 1992; Li and Holste, 2004, 2005). For coding regions including the regulatory sites, codon structures as well as gene structure often cause the DNA sequences to be non-random (Mani, 1992; Almirantis, 1999; Nikolaou and Almirantis, 2002; Hackenberg et al., 2012; Cocho et al., 2014). However, such debate has not really reached a consensus at the local level in non-coding, non-functional regions. Part of the reason is that randomness definitions are mostly based on probability models of infinitely long sequences, and corresponding definitions for finite sequences are not universally adopted.
Defining randomness in a sequence is not easy (Knuth, 1997). On the one hand, for a sequence of infinite length, being random implies “any motif can appear”. This includes the series composed of the same symbol of arbitrary length, which by itself can not be considered as random. On the other hand, for a finite sequence, the intuitive notion of being random is that all symbols, dimers, triplets, etc. appear with equal frequency. However, a periodic sequence would also satisfy this requirement, which nevertheless is hardly considered to be random.
In the field of mathematics, a discussion concerning the Erdös discrepancy problem (Erdös, 1957) seems to provide a foundation of randomness in finite sequences. Given an infinite binary sequence , taking values , we define the discrepancy function for the sequence up to the length , of an integer spacing :
| (1) |
In other words, is the cumulative sum of the subsequence sampled from every positions, starting from the position , of the length-L window. Erdös asked the question: given any constant , can one find a sequence of length and a spacing value so that
| (2) |
for one value of spacing . The problem is solved by Terence Tao, and the answer is yes (Tao, 2016; Soundararajan, 2018), no matter how large the value of C, one can always find the above defined sum larger than C for certain spacing value, at a particular length .
When , is just the cumulative function of a (random) walk whose steps are given by the series. In order for the Erdös question to have the negative answer, one should design steps to be as close to the origin as possible. A periodic walk of period 2 with alternating positive and negative steps is the best solution. However, this solution is unstable in the sense that as soon as one changes the value to 2, diverges. Therefore, allowing to be different from 1, or, allowing one to sample other subsequences in () of spacing d (called “homogeneous arithmetic progression”), is a solution to exclude periodic sequences from “low discrepancy” (low cumulative value for the random walk) category, while “low discrepancy” is one essential concept in our definition of randomness.
We can reverse the Erdös question to design a finite sequence which has the “lowest possible discrepancy” but exclude periodic sequence, for a given value. Such designed sequence exhibits the hallmark of a locally random sequence: uniform distribution of single symbol and low-order tuples. It has been shown that there is a length-11 sequence which has the lowest possible discrepancy, not larger than C=1 for any values (Mathias, 1993). All other sequences with longer lengths would lead to discrepancy larger than 1. Similarly, for , a length-1160 sequence is able to limit its discrepancy to equal or less than 2 for any (Konev and Lisitsa, 2014), but once the length is extended to 1161, discrepancy can increase above 2. We call these designed finite series “Erdös sequences with the limit of C and of length L” (). is our candidate of a locally random string at the corresponding string length.
In this work, we will show that the length-11 sequence constructed by Mathias is not unique, whereas there exists a unique sequence with the required low-discrepancy feature at length 10. We focus on this length-10 sequence () and translate it to 10-mers in the DNA sequence of the human genome. The length of 10 is particularly appealing as the DNA double helix makes one complete turn after approximately 10 base-pairs (spacing between two ladder steps is 0.34 nm, and one helix turn is 3.4 nm) (Calladine et al., 2004). We will use the human genome to examine the distribution of DNA substrings of length 10 which are consistent with the sequence. The goal of this investigation is to examine whether the human genome tends to possess these “low discrepancy”, “locally random” sequences.
In the next section, we review the previously studied Mathias sequence and propose the unique low discrepancy sequence. We translate the Erdös motif to DNA sequences, using different base pair definitions. In section 3, the result section, we present the observed and expected values obtained from the human genome, and apply the same analysis to genomic sequences windowed by 1Mb windows to study its frequency at the local level. Then, the presence of sequences in particular functional DNA units and mRNA is discussed. In the Discussion and conclusions section, the results are recapitulated and open problems are proposed, in particular the relation of and Thue-Morse sequences, and the relevance of Kolmogorov complexity in defining locally random motifs. In the Appendix comparison of the results in natural DNA with those of artificially constructed sequences are contrasted.
2 Erdös sequences
2.1 The unique length-10 Erdös sequence with binary symbols
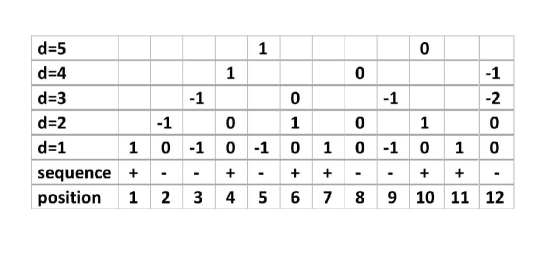
The derived in (Mathias, 1993) is + - - + - + + - - + + , which is called the “Mathias sequence”. Fig.1 illustrates why it satisfies Erdös’ low discrepancy requirement: the sum of for d=1,2,3,4,5 is always bounded by 1. If a 12th value is added to the sequence, it can not be +, as there would be three +’s in a row. If it is “-”, the deviation would be larger than C=1 for d=3. Note that has huge discrepancy for , reminding us that arithmetic progression has to start from position .
Also note that if an Erdös sequence reverses its direction, it may not be an Erdös sequence anymore. There could be two different causes. Take the first 7 positions of for example (Fig.1): in the forward direction, the discrepancy series is (position 0 is also included): (0, 1,0, -1, 0, -1, 0, 1). In the backward direction, the discrepancy series is not a reverse of the above, but (0, 1,2,1,2,1,0,1). The two walks are mirror image of each other with respect to 0.5. Only when the forward walk ends up at discrepancy of zero value, would the two walks be mirror image of each other with respect to 0, and the backward sequence to be also a Erdös sequence. The second cause is about “phase”. Since for , the subsequence selected starts from the position , forward and backward sequence may select different subsequences, thus potentially different discrepancy series.
We can see that has a balanced single symbol frequencies (f(+)=6/11, f(-)=5/11), and almost balanced dimer frequencies (f(--)=2/10, f(-+)=3/10, f(+-)=3/10, f(++)=2/10). At the same time, is mostly not periodic. Interestingly, when a sequence contains any k-mer exactly once (called De Bruijn sequence (De Bruijn, 1946, 1975), its k-mer frequency is exactly balanced. There are attempts to design shortest sequences to contain all k-mers in both direct and reverse direction of DNA sequences (Orenstein and Shamir, 2013). Again, to be the shortest means to contain any k-mer only once, therefore resulting to a balanced k-mer frequencies. We do not expect Erdös sequence to have a balanced -mers frequencies when is large, as the presence of the all-1 or all-0 -mers will lead to a large discrepancy for . However, for ’s being less, equal, or close to , we may hypothesize balanced -mer frequencies in Erdös sequences.
It is not difficult to check that there is another sequence + - - + - + + - - + -, denoted , with the last symbol changed from + to -, which is also an Erdös sequence. It is because 11 is a prime number and changing the last symbol only affects the discrepancy for , changing the final cumulative value from 1 to -1. Swap + and - would not change any of the discrepancy values. Running through all possible length-11 binary sequences, we observed that Mathias’ and (plus the two derived from swapping the binary symbols) are the only Erdös sequences at .
If the last symbol of the Mathias’ sequence can either be + or -, with the rest of the sequence identical, we would expect that the first ten symbols should form a unique . Indeed, running through all possible length-10 binary sequences, we find only one sequence which conforms with the Erdös discrepancy condition: + - - + - + + - - + (plus the one by swapping + and -). The single symbol frequency is exactly balanced (f(+)=5/10, f(-)=5/10), whereas the dimer frequencies are somewhat unbalanced (f(--)=2/9, f(-+)=3/9, f(+-)=3/9, f(++)=1/9). Sequences with equiprobable subsequences are also called “normal” (Li and Vitányi, 1994).
Further simulations show that is unique when is even, and not unique when is odd, all with a degeneracy at the last symbol (can be either + or -). does not exist when . In the following, we focus on the unique Erdös sequence with the maximum length, , and its frequency of appearance in the human genome.
2.2 DNA motifs of length 10 bases which are associated with Erdös sequence
DNA sequences use four symbols (A,C,G,T). There are three different ways to split the four symbols into two groups: (a) R/Y binarization combines AG (R for purine) and CT (Y for pyrimidine), (b) W/S binarization combines AT (W for weak) and CG (S for strong), (c) K/M binarization combines GT (K for keto) and AC (M for amino). The W/S binarization characterizes the binding strength between the two DNA strands (G and C bind more strongly), and GC-content is an experimentally measurable quantity (Schildkraut et al., 1962) which is widely studied in genomic analysis (Li, 2013). The R/Y binarization highlights the size difference of the two types of bases (A and G are larger in size), and has been proposed to be relevant to codon patterns (Shepherd, 1981), regulatory sequence patterns (Christophe et al., 1985), and the double helix structure (Arnott et al., 1974). The last binarization (M/K) is rarely used. The fact that the DNA molecule has the form of a double helix implies that we must examine two strands for Erdös motifs, the direct strand, and the reverse complement strand.
(a) For R/Y binarization, four sequences are associated with , considering both the direct DNA sequence and its reverse complement sequence on the opposite strand:
| (3) |
Seq.1 and seq.2 are two different mapping from +/- to R/Y; seq.3 is the reverse complement of seq.1 (or reverse of seq.2); seq.4 is the reverse complement of seq.2 (or reverse of seq.1). Note that seq.3 and seq.4 are not Erdös sequences themselves, but their existence indicates the presence of Erdös sequence on the opposite strand of the DNA double helix. As a reminder, the complementary rule is and .
(b) Similarly, for W/S binarization, we have four motifs associated with :
| (4) |
Seq.3 (seq.4) is the reverse complement of seq.1 (seq.2), noting that the complement operation maps one W (S) to another W(S).
(c) The least used binarization is to M/K, and we again have four motifs:
| (5) |
In terms of the four nucleotide symbols, each motif represents 4-symbol patterns. Multiplying by 12, and subtracting 48 = 10-mers which belong to more than one type of motifs (e.g. ACCACAACCA is either a RY or a WS motif), we are dealing with 12240 10-mers which are associated with the Erdös sequence in either one of the strands.
3 Distribution of Erdös sequences in the human genome
3.1 DNA sequence data
In this study, the sequence of human reference genome hg38 is used, which is downloaded from UCSC Genome Browser http://hgdownload.soe.ucsc.edu/goldenPath/hg38/chromosomes/. We use chromosomes 1,2, 22, and chromosome X but we exclude chromosome Y due to large amount of non-sequenced regions. The 23 sequences contain RepeatMasker filtering information: lowercase letters represent regions that match transposons or other repetitive or low-complexity sequences, whereas uppercase letters represent unique sequences.
The messenger RNA (mRNA) sequence of “known genes” (last updated in July 2016) is obtained from http://hgdownload.soe.ucsc.edu/goldenPath/hg38/database/. A mRNA sequence matches the genomic sequence of a gene, after removing the introns. Due to alternative splicing, each genomic sequence at a gene locus may contribute multiple mRNA sequences. We obtained 197,783 mRNA sequences from the Genome Browser.
The refGene list of human genes (last updated in April 2018) is obtained from
http://hgdownload.cse.ucsc.edu/goldenPath/hg38/database/refGene.txt.gz.
Pseudogenes are removed from the list by requiring the gene ending position
to be larger than the starting position. Transcripts with overlapping coordinates
are merged using the bedtools program
(http://bedtools.readthedocs.io/) (Quinlan and Hall, 2010), with the command
bedtools merge -i file -d 100 -c 4 -o collapse.
This processing leads to 18,757 gene sequences.
The non-transposon/non-repetitive unique sequence can be read out from the
reference genome directly: unique sequences are in uppercase, whereas RepeatMasker
(http://www.repeatmasker.org/) identified repetitive sequences are in lowercase.
The telomere and centromere region is first based on the
cytoband information from
http://hgdownload.soe.ucsc.edu/goldenPath/hg38/database/cytoBand.txt.gz.
The first and the last bands of a chromosome is considered to
be the telomere regions. We first use the same file to bracket the centromere
region (when the band is labeled as “acen”). Then we further fine-tune the
boundary by an observation made in (Thanos et al., 2018) that windowed statistical
qualities (e.g. entropy) have extremely low variations in the centromere region.
3.2 Distribution of Erdös sequences in the human genome at the chromosome level
For R/Y binarization, out of 2.911 billions overlapping 10-mers in the human genome (chromosomes 1-22,X, excluding any 10-mers which contain unsequenced bases) there are 6,161,338 counts of R/Y , or 0.21% of all 10-mer counts. The ratio between R/Y and non-R/Y- sequence counts is 1:471. This frequency is severely underrepresented as the expected frequency is 0.39% if the strand symmetry holds true (see Appendix, from both analytic formula and simulation results). The observed over expected ratio (O/E) is 0.54, or equivalently 1/1.85. On individual chromosomes, the R/Y observed frequency of compatible 10-mers is also much lower than those in sequences generated randomly using the observed base composition (see Appendix).
For W/S , there are 10,073,985 copies of them in the human genome (0.35%). For each W/S , there are 288 10-mers that are not compatible. This frequency is slightly higher than the expected value of 0.32% (O/E=1.05), if we make a simple assumption that the GC-content is 40% (see Appendix). The 40% value is a good approximation for global GC-content (Li, 2013). Even if we use the observed GC-content at the individual chromosome, the conclusion remains true that the frequency is slightly higher than expected (except for chromosomes 16 and 19) (see Appendix).
Finally, there are 8,782,253 copies of M/K based (0.3%), slightly lower than expected (0.39%, assuming strand symmetry). There are more W/S or M/K than R/Y , even though R/Y is expected to appear more often than W/S , and equally likely as M/K . Combining the three types of , there are in total 24,692,591 copies of 10-mer motifs associated with . This number is slightly lower than the sum of the three counts for R/Y, W/S, and K/M based because some 10-mers belong to more than one type. The frequency for overall is 0.85%. This frequency is lower than the expected value of 1.1% (see Appendix).
There is yet another R/Y based 10-mer (Trifonov, 2010; Li et al., 2013), RRRRRYYYYY /YYYYYRRRRR (R5Y5), proposed as a nucleosome positioning sequence or motif (Trifonov and Sussman, 1980; Drew and Travers, 1985; Peckham et al., 2007; Segal et al., 2006; Jiang and Pugh, 2009). There are other nucleosome positioning sequence patterns proposed, in particular, the periodicity 10-11 of AA/TT steps (Calladine et al., 2004). Unlike the underrepresented R/Y-based Erdös sequences, the R5Y5 motif is overrepresented: observed frequency is 0.36% vs. the expected 0.195% (O/E=1.87). The overrepresentation of R5Y5 is also consistent with the abundance of R- and Y-tracts (Behe, 1995), and their connection to coding/noncoding regions has been reported (Almirantis and Provata, 1997).
Table 1(a) shows the correlation among various ’s. The R/Y based Erdös frequency is negatively correlated with both W/S based and K/M based Erdös frequencies, at the chromosome level, with Spearman rank correlation coefficient ((Hollander and Wolfe, 1999), sec. 8.6) of and . The W/S based and K/M based Erdös sequences are positively correlated. The overall Erdös frequency is closely tied to that of the W/S based Erdös sequence, probably because there are more W/S based Erdös motifs than either R/Y based or K/M based ones.
Table 1(b) shows the correlation between Erdös sequence frequencies with those of other sequence features. The R/Y based Erdös sequence is always opposite to W/S based or to K/M based, as well as overall Erdös sequence, in terms of its correlation with other features. Notably, the rate of W/S based Erdös sequence is positively correlated with the GC-content, and the frequency of R/Y based Erdös sequence is positively correlated with the chromosome length.
For completeness, we also show the correlation among the frequencies of various sequence features in Table 1(c). Interestingly (and perhaps counter-intuitively), both the polyA/polyT density and polyC/polyC density (which is very low) are positively correlated with the GC-content.
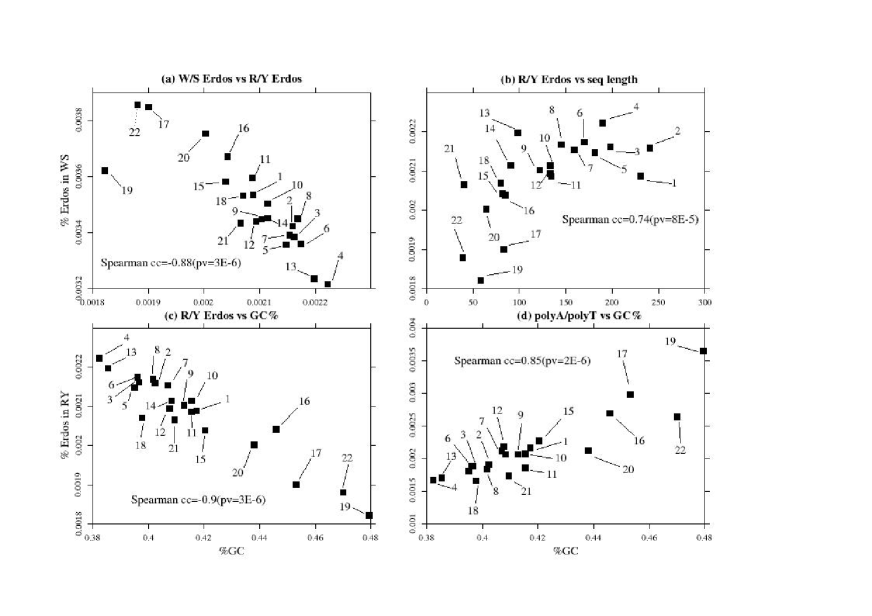
Fig.2 highlights a few strong correlations: negative correlation between two types of Erdös ’s, positive correlation between R/Y based and sequence length, negative correlation between R/Y based and GC-content, and positive correlation between polyA/polyT density and GC-content. Other large (in absolute value) and significant correlations are marked as bold in Table 1.
3.3 Distribution of Erdös sequences in the human genome at the window level
Quantities calculated at the chromosome level may not be fine scaled enough. In order to check whether Erdös sequence frequencies are correlated with other sequence features at a more local scale, we partition the human genome into non-overlapping 1Mb windows. Similar to Table 1, we show Spearman correlation in three categories, i.e, among various Erdös sequence frequencies (R/Y, W/S, K/M based, and overall ), between Erdös sequence and other sequence features, and among sequence features themselves (GC-content, Y5R5 motif frequency, non-transposon/non-repetitive sequence frequency, length-10-polyA/polyT frequency, and length-10-polyC/polyG frequency).
Interestingly, all highlighted strong correlations in Table 1 and Fig.2 at the chromosome level remain true at the 1Mb window level (Table 2, Fig.3), including the negative correlation between R/Y based and W/S (and K/M based) Erdös sequence frequency, the negative (positive) correlation between R/Y (W/S and overall) Erdös sequence frequency and GC-content, the positive correlation between polyA/polyT and GC-content, etc. The scatter plots in Fig.3 also show the existence of outliers which are all from centromere regions. It also shows that the positive correlation between polyA/polyT and GC-content coexist with a larger variance for polyA/polyT at GC-rich regions (see Fig.3(d)). The statistical test results in Table 2 are all more significant than the corresponding ones in Table 1, as the sample size is increased from the 23 chromosomes to 2755 1Mb windows.
The overrepresentation of W/S based sequence observed at chromosome level is still true at 1Mb window level. We use the local GC-content to estimate the expected frequency of W/S based in each window. The distribution of all O/E is single-peaked, with median 1.097, mean 1.091, mode around 1.12-1.13. Of all 1Mb windows, 86% overrepresent W/S and 14% underrepresent it. As a comparison, none of the 1Mb window overrepresents R/Y based , with mean of O/E to be 1/1.827 (if outliers removed, 1/1.81), median 1/1.796 (if outliers removed 1/1.794).
In (Li et al., 2013) it was observed that the R5Y5 density is negatively correlated with that of the transposon and other repetitive sequences at 64kb window level. Table 2 shows that this conclusion remains true at the 1Mb window level (positive correlation between R5Y5 density and unique sequence density).
3.4 Frequency of Erdös motifs in various functional, regional, sequence-feature classes
Besides counting Erdös motifs in the whole genome, we also count them in sequences belonging to specially defined sub-categories. The first subcategory consists of the genome free of transposons and repeats. This sequence has been formed by applying the RepeatMasker tool over the genome and is represented as uppercase letters in the reference genome. Messenger RNA (mRNA) sequence are concatenated exons from the same gene. The gene sequences are the genomic sequences bracketed by the starting and ending position of genes as listed in refGene, which contains both exons and introns. Telomeres and centromeres exhibit very different sequence features compared to the rest of the sequences, and can also be examined separately.
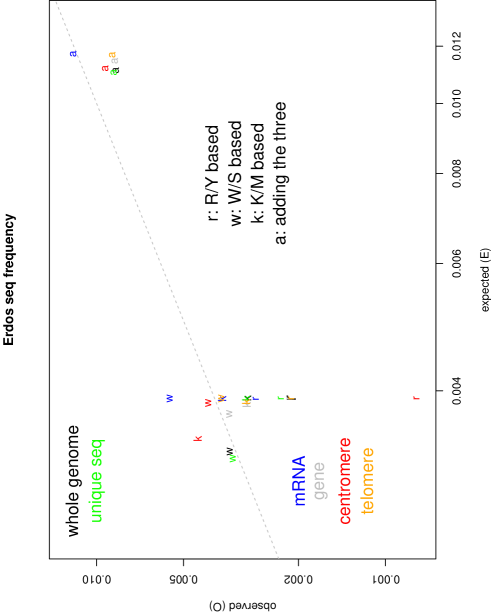
Fig.4 summarizes the observed vs expected Erdös motifs in the following situations: (1) non-transposon, non-repetitive “unique” sequences; (2) messenger RNA sequences; (3) gene sequences; (4) centromeres; and (5) telomeres. The expected frequencies derived by the formulae in Appendix use the exact S%, R%, K% frequencies as obtained from the same categories, instead of the equiprobability assumption for R/Y and K/M based sequence, and GC%=0.4 assumption for W/S based one.
Fig.4 shows that the underrepresentation of R/Y-based Erdös motifs is true for all categories examined, in particular the centromere region. However, the extreme lower R/Y based Erdös motif frequency in centromere might be an artifact. Centromeres are dominated by a large number of copies of the alpha satellite sequence of length 172 bases. Using the expected frequencies, the expected number of R/Y based Erdös motif is 0.63 out of 162 10-mers. The actual number of observed copies is zero. As a comparison, the expected number of W/S based Erdös motif is 0.52, but there is only one observed copy. Since both zero and one copy are consistent with the expectation, R/Y based motif just happens to be on the lower side of the expectation.
For W/S based Erdös motifs, most observed frequencies are consistent or slightly higher than the expected (Fig.4), except for mRNA sequences. We hypothesize that it might be related to a “hidden” periodicity in the sequence. If we examine the sequence closely in Fig.1, the positions 1, 4, 7, 10 are all positive, resulting in a periodicity of three in this particular reading frame. Similarly, the positions 2, 5, 8 are all negative, again a potential periodicity of three. The reason that this local periodicity evades the attention in the mathematics community in the discussion of Erdös problem is that the homogeneous arithmetic progression requires the step- walk to start from position . When , this requirement forces the walk to start from the third reading frame, not the first or the second reading (see Fig.1). Since mRNA sequences contain periodicity-three signals, it is not unreasonable to speculate that it is a possible cause of the Erdös sequence enrichment. In addition, mRNAs contain specific motifs of codons; these may also be mirrored in the Erdös sequences and thus contribute further in the observed enrichment of W/S-Erdös motifs.
Finally, adding the three types of Erdös frequency together, for both expected and observed sequences, we see in Fig.4 a pattern of underrepresentation (with the exception of mRNA). This underrepresentation, generally speaking, supports the idea that the human DNA sequences are not locally random.
4 Discussion and conclusions
There is a long history in characterizing statistical patterns in DNA sequences: from recognizing the nearest neighbor correlations (Swartz et al., 1962) to the detection of long-range correlations (Li and Kaneko, 1992; Peng et al., 1992; Voss, 1992). The debate on whether the human genome sequences are homogeneous, iid (independent and identically distributed), random (IHGSC, 2001; Clay and Bernardi, 2001; Li et al., 2002) is often based on concepts defined on infinitely long sequences. There is always a lack of adequate concepts related to randomness on finite scales. In this study, our aim is to consider a type of low-discrepancy sequences, called Erdös sequences , and perhaps their generalization, as candidates for locally random sequences.
The underrepresentation of overall compatible motifs in the human genome (Fig.4) can be interpreted as a lack of locally random sequences. This is particularly true for R/Y based 10-mers. Interestingly, it was observed that long-range correlation scaling is best observed in the R/Y binarization (Peng et al., 1992). The surprising overrepresentation of W/S based 10-mers in mRNA sequences might reflect, among others, a potentially periodicity-3 tendency in certain reading frames in this sequence. Further investigation is required to pinpoint the cause of the overrepresentation.
The underrepresentation of R/Y based is not a consequence of lower or higher R content, or equivalently, a violation of Chargaff’s second parity. Indeed, if R% is too high or too low, other R/Y-based 10-mers may become the most frequent motifs, such as R-track or Y-track (Almirantis and Provata, 1997). However, Chargaff’s rule is well preserved both at the chromosomal and at the 1Mb window levels (result not shown). Furthermore, we observed that among R/Y based 10-mers with R%=Y%, the Erdös motifs are still underrepresented (result not shown).
The key component in an Erdös sequence is its low discrepancy, either in the direct cumulative plot or in many of its equally spaced subsequences. The cumulative plot or (random) walk representation has been frequently used in DNA sequences (Berthelsen et al., 1992; Peng et al., 1992; Zhang and Zhang, 1994), but the inclusion of equally spaced subsequences is an ingenious device to exclude periodic sequences. An open question is how low discrepancy property fits other hallmarks of local randomness.
One feature of finite random sequences is their lack of periodic patterns. Indeed, is identical to the first 10 digits of the Thue-Morse sequence, a well known aperiodic or quasiperiodic infinite sequence (Allouche and Shallit, 1999; Riklund et al., 1987). Interestingly, Thue-Morse sequence has bounded discrepancy for specific spacing values () even in the infinite sequence length limit (Leong, 2011; Leong and Shallit, 2013).
Using a semi-periodic pattern to reduce discrepancy while at the same time to avoid exact periodicity may have other applications in sequence analysis. For example, it is well known that in the promoter region of housekeeping genes, CpG dinucleotide is common, forming CpG islands (Vinson and Chatterjee, 2012). However, they can not be arranged in a periodic fashion. When they appear in a periodic arrangement of CGG repeats with more than 200 copies in gene FMR1, it leads to a form of intellectual disability (Park et al., 2015).
Another property of local randomness is the difficulty in recreating the sequence. This property makes randomness equivalent to a measure of complexity (Li, 1991). The use of Kolmogorov complexity as a way to measure local randomness is an involved topic (Allouche, 1999; Vitányi, 2001; Li and Vitányi, 2009; Soler-Toscano et al., 2014) and will not be addressed here. However, compressibility based calculation can be easily carried out (Ziv and Lempel, 1977; Benedetto et al., 2002; Estevez-Rams et al., 2013). Preliminary calculations indicate that belong to a harder-to-compress group, but not the hardest-to-compress (results not shown).
In conclusion, the search for low discrepancy sequences in the human DNA has shown that these motifs are overall underrepresented (except for some particular cases). This results is consistent with nonrandomness at the local scale. In future studies, it would be interesting to extend this search into the full 4-letter alphabet scheme, Erdös sequences of longer sizes, both of which require considerably more involved computational effort, as well as extending low discrepancy property to all reading frames. Knowing that DNA sequences are not homogeneous, but are composed by sub-regions (isochores, genes, etc.), it would be interesting to quest whether these inhomogeneities are also mirrored locally following the randomness criteria as posed by the Erdös problem.
Acknowledgement: WL thanks the Robert S Boas Center for Genomics and Human Genetics for support.
Appendix: estimation of the frequencies in random sequences
If each symbol appears with equal probability, the expected frequency can be estimated by counting the number of 4-symbol sequences matching of the total number of possible 10-mers. There are 4 motifs in Eq.(2.2), each containing 4-symbol sequences. Combining Eqs.(2.2,2.2,2.2), there are roughly =12288 4-symbol 10-mers associated with (the actual number is 12240 because one 4-symbol sequence can simultaneously belong to (e.g.) Eq.(2.2) or Eq.(2.2) ). The total number of 4-symbol 10-mers is . Therefore the associated 10-mer frequency is 12240/1048576 .
For individual type of sequence, R/Y based Erdös sequence is expected to appear with the frequency of
If the strand symmetry (Fickett et al., 1992; Li, 1997; Forsdyke and Mortimer, 2000) holds true, i.e., A% T%, G% C%, we have R% Y% . Then the expected frequency is . The same argument is also applied to K/M based Erdös motifs. For W/S based Erdös sequence, the expected frequency is
If the strand symmetry is true, S% 2 G% 2C%, W% 2 A% 2T%. In the human genome, it is observed that G% C% 0.2, and A% T% 0.3 (Li, 2013). The expected W/S based frequency is .
We also ran a simulation to generate artificial chromosomes with the same base composition as the real human chromosomes, but bases are scrambled. The numbers of R/Y and W/S based Erdös sequence in the simulated artificial chromosomes are shown in Table A1 (column “exp(simu)”. These can be compared to the estimated from the formula (“exp(form)”). These two columns match very well. In comparison, the observed numbers of R/Y based Erdös sequences in the human genome are greatly underrepresented, whereas W/S based Erdös sequences are slightly overrepresented.
| ch | R/Y based | W/S based | ||||
|---|---|---|---|---|---|---|
| exp(form) | exp(simu) | obs | exp(form) | exp(simu) | obs | |
| 1 | 900310 | 897577 | 481226 | 783565 | 784613 | 814642 |
| 2 | 939640 | 939599 | 519480 | 773397 | 773140 | 823550 |
| 3 | 773828 | 773843 | 428228 | 622072 | 620791 | 670565 |
| 4 | 741221 | 740585 | 421683 | 557761 | 557947 | 610107 |
| 5 | 708065 | 709136 | 389259 | 565271 | 566846 | 608698 |
| 6 | 664369 | 663453 | 369791 | 532683 | 533044 | 571511 |
| 7 | 620975 | 620758 | 342407 | 520689 | 518623 | 539313 |
| 8 | 565499 | 564884 | 313915 | 464086 | 463694 | 499486 |
| 9 | 475743 | 475759 | 256150 | 407606 | 408054 | 420120 |
| 10 | 520555 | 519739 | 281705 | 450212 | 449989 | 466925 |
| 11 | 525522 | 526585 | 280736 | 454480 | 454826 | 483844 |
| 12 | 520068 | 520663 | 278794 | 437233 | 436291 | 458118 |
| 13 | 382746 | 381916 | 215344 | 292380 | 292947 | 317177 |
| 14 | 353779 | 353633 | 191478 | 298201 | 298697 | 312635 |
| 15 | 330629 | 330103 | 172558 | 290753 | 290061 | 303179 |
| 16 | 319552 | 319783 | 167038 | 301244 | 301711 | 300467 |
| 17 | 323904 | 324392 | 157592 | 309935 | 309961 | 319059 |
| 18 | 312844 | 311656 | 165815 | 252685 | 252467 | 282838 |
| 19 | 228284 | 228618 | 106470 | 226350 | 225640 | 211684 |
| 20 | 249779 | 250204 | 128054 | 231185 | 231051 | 240010 |
| 21 | 156594 | 156317 | 82809 | 132512 | 132147 | 137638 |
| 22 | 152961 | 153855 | 73622 | 150241 | 149192 | 151017 |
| X | 605050 | 604301 | 337184 | 483427 | 482816 | 531402 |
Table A1: The number of R/Y and W/S-based Erdös sequences in 1-22 & X chromosomes. The counts are based on the formulae in Appendix (left columns), artificially constructed chromosomes (middle columns), and the true observed numbers calculated from the human genome (right columns).
References
- Allouche, (1999) JP Allouche (2012), Surveying some notions of complexity for finite and infinite sequences, in Functions in Number Theory and Their Probabilistic Aspects, RIMS Kokyuroku Bessatsu Series B34, eds. K Matsumoto, S Akiyama, K Fukuyama, H Nakada, H Sugita, A Tamagawa (RIMS, Kyoto University), pp.27-28.
- Almirantis, (1999) Y Almirantis (1999), A standard deviation based quantification differentiates coding from non-coding DNA sequences and gives insight to their evolutionary history, J. Theo. Biol., 196:297-308.
- Almirantis and Provata, (1997) Y Almirantis and A Provata (1997), The “clustered structure” of the purines/pyrimidines distribution in DNA distinguishes systematically between coding and non-coding sequences, Bull. Math. Biol., 59:975-992.
- Allouche and Shallit, (1999) JP Allouche and J Shallit (1999), The ubiquitous Prouhet-Thue-Morse sequence, in Sequences and Their Applications. Proceedings of SETA’98, eds. C Ding, T Helleseth, H Niederreiter (Springer), pp.1-16.
- Arnott et al., (1974) S Arnott, R Chandrasekaran, DWL Hukins, PJC Smith, L Watts (1974), Structural details of a double-helix observed for DNAs containing alternating purine and pyrimidine sequences, J. Mol. Biol., 88:523-524.
- Bailey et al., (2002) JA Bailey, Z Gu, RA Clark, K Reinert, RV Samonte, S Schwartz, MD Adams, EW Myers, PW Li, EE Eichler (2002), Recent segmental duplications in the human genome, Science, 297:1003-1007.
- Behe, (1995) MJ Behe (1995), An overabundance of long oligopurine tracts occurs in the genome of simple and complex eukaryotes, Nucl. Acids Res., 23:689-695.
- Benedetto et al., (2002) D Benedetto, E Caglioti, V Loreto (2002), Language trees and zipping, Phys. Rev. Lett., 88:048702.
- Bernardi, (2001) G Bernardi (2001), Misunderstandings about isochores. Part 1, Gene, 276:3-13.
- Bernardi et al., (1985) G Bernardi, B Olofsson, J Filipski, M Zerial, J Salinas, G Cuny, M Meunier-Rotival, F Rodier (1985), The mosaic genome of warm-blooded vertebrates, Science, 228:953-958.
- Berthelsen et al., (1992) CL Berthelsen, JA Glazier, MH Skolnick (1992), Global fractal dimension of human DNA sequences treated as pseudorandom walks, Phys. Rev. A, 45:8902-8913.
- Bustamante et al., (2005) CD Bustamante, A Fledel-Alon, S Williamson, R Nielsen, MT Hubisz, S Glanowski, DM Tanenbaum, TJ White, JJ Sninsky, RD Hernandez, D Civello, MD Adams, M Cargill, AG Clark (2005), Natural selection on protein-coding genes in the human genome, Nature, 437:1153-1157.
- Calladine et al., (2004) CR Calladine, H Drew, B Luisi, A Travers (2004), Understanding DNA: The Molecule and How it Works, 3rd edition (Academic Press).
- Carlson, (2011) EA Carlson (2011), Mutation: The History of an Idea from Darwin to Genomics (Cold Spring Harbor Laboratory Press).
- Clay and Bernardi, (2001) O Clay, G Bernardi (2001), Compositional heterogeneity within and among isochores in mammalian genomes: II. Some general comments, Gene, 276:25-31.
- Christophe et al., (1985) D Christophe, B Cabrer, A Bacolla, H Targovnik, V Pohl, G Vassart (1985), An unusually long poly(purine)-poly(pyrimidine) sequence is located upstream from the human thyroglobulin gene, Nucl. Acids Res., 13:5127-5144.
- Cocho et al., (2014) G Cocho, P Miramontes, R Mansilla, W Li (2014), Bacterial genomes lacking long-range correlations may not be modeled by low-order Markov chains: the role of mixing statistics and frame shift of neighboring genes, Comp. Biol. Chem., 53(A):15-25.
- Colquhoun, (2014) D Colquhoun (2014), An investigation of the false discovery rate and the misinterpretation of p-values, Royal Soc. Open Sci., 1:140216.
- Cooper and Krawczak, (1991) DN Cooper and M Krawczak (1991), Mechanisms of insertional mutagenesis in human genes causing genetic disease, Human Genet.,87:409-415.
- Cordaux and Batzer, (2009) R Cordaux and MA Batzer (2009), The impact of retrotransposons on human genome evolution, Nature Rev. Genet., 10:691-703.
- De Bruijn, (1946) NG De Bruijn (1946), A combinatorial problem, Proc. Koninklijke Nederlandse Akademie van Wetenschappen, 49:758-764.
- De Bruijn, (1975) NG De Bruijn (1975), Acknowledgement of priority to C. Flye Sainte-Marie on the counting of circular arrangements of zeros and ones that show each n-letter word exactly once, Technical Report, Technische Hogeschool Eindhoven.
- Drew and Travers, (1985) HR Drew and AA Travers (1985), DNA bending and its relation to nucleosome positioning, J. Mol. Biol., 186:773-790.
- Duret and Arndt, (2008) L Duret and PF Arndt (2008), The impact of recombination on nucleotide substitutions in the human genome, PLoS Genet.,4:e1000071.
- Erdös, (1957) P Erdös (1957), Some unsolved problems, Michigan Math. J., 4:291-300.
- Estevez-Rams et al., (2013) E Estevez-Rams, R Lora Serrano, B Aragón Fernández, I Brito Reyes (2013), On the non-randomness of maximum Lempel Ziv complexity sequences of finite size, Chaos, 23:023118.
- Fickett et al., (1992) JW Fickett, DC Torney, DR Wolf (1992), Base compositional structure of genomes, Genomics, 13:1056-1064.
- Flores et al., (2007) M Flores, L Morales, C Gonzaga-Jauregui, R Domínguez-Vidaña, C Zepeda, O Yañez, M Gutiérrez, T Lemus, D Valle, MC Avila, D Blanco, S Medina-Ruiz, K Meza, E Ayala, D García, P Bustos, V González, L Girard, T Tusie-Luna, G Dávila, R Palacios (2007), Recurrent DNA inversion rearrangements in the human genome, Proc. Natl. Acad. Sci., 104:6099-6106.
- Forsdyke and Mortimer, (2000) DR Forsdyke, JR Mortimer (2000), Chargaff’s legacy, Gene, 261:127-137.
- Hackenberg et al., (2012) M Hackenberg, A Rueda, P Carpena, P Bernaola-Galván, G Barturen, JL Oliver (2012), Clustering of DNA words and biological function: a proof of principle, J. Theo. Biol., 297:127-136.
- Hartl and Clark, (1997) DL Hartl and AG Clark (1997) Principles of Population Genetics, 4th edition (Sinauer Asso. Inc.).
- Hollander and Wolfe, (1999) M Hollander and DA Wolfe (1999), Nonparametric Statistical Methods, 2nd edition (Wiley).
- IHGSC, (2001) International Human Genome Sequencing Consortium (2001), Initial sequencing and analysis of the human genome, Nature, 409:860-921.
- Jiang and Pugh, (2009) C Jiang and BF Pugh (2009), Nucleosome positioning and gene regulation: advances through genomics, Nature Rev. Genet., 10:161-172.
- Kimura, (1983) M Kimura (1983), The Neutral Theory of Molecular Evolution (Cambridge University Press).
- Knuth, (1997) DE Knuth (1997), Art of Computer Programming, Volume 2: Seminumerical Algorithms, 3rd edition (Addison-Wesley).
- Konev and Lisitsa, (2014) B Konev, A Lisitsa (2014), a SAT attack on the Erdös discrepancy conjecture, arXiv preprint, arXiv:1402.2184.
- Koroteev and Miller, (2011) MV Koroteev and J Miller (2011), Scale-free duplication dynamics: a model for ultraduplication, Phys. Rev. E, 84:061919.
- Leong, (2011) A Leong (2011), Variations on the Erdös discrepancy problem, Master Thesis, Computer Science, University of Waterloo, Waterloo, Ontario, Canada.
- Leong and Shallit, (2013) A Leong, J Shallit (2013), Counting sequences with small discrepancies, Exp. Math., 22:74-84.
- Li and Vitányi, (1994) M Li and P Vitányi (1994), Statistical properties of finite sequences with high Kolmogorov complexity, Math. Sys. Theo., 27:365-276.
- Li and Vitányi, (2009) M Li and P Vitányi (2008) An Introduction to Kolmogorov Complexity and Its Applications, 3rd edition (Springer)
- Li, (1991) W Li (1991), On the relationship between complexity and entropy for Markov chains and regular languages, Complex Sys., 5:381-399.
- Li, (1992) W Li (1992), Generating nontrivial long-range correlations and 1/f spectra by replication and mutation, Int. J. Bifur. and Chaos, 2:137-154.
- Li, (1997) W Li (1997), Study of correlation structure in DNA sequences: a critical review, Comput. & Chem., 21:257-272.
- Li, (2011) W Li (2011), On parameters of the human genome, J. Theo. Biol., 288:92-104.
- Li, (2013) W Li (2013), G+C content evolution in the human genome, eLS, doi:10.1002/9780470015902.a0021751.
- Li et al., (2002) W Li, P Bernaola-Galvan, P Carpena, JL Oliver (2002), Isochores merit the prefix ‘iso’, Comp. Biol. and Chem., 27:5-10.
- Li and Holste, (2004) W Li and D Holste (2004), Spectral analysis of guanine and cytosine fluctuations of mouse genomic DNA, Fluct. Noise Lett., 4:L453-L464.
- Li and Holste, (2005) W Li and D Holste (2005), Universal 1/f noise, crossovers of scaling exponents, and chromosome-specific patterns of guanine-cytosine content in DNA sequences of the human genome, Phys. Rev. E, 71:041910.
- Li and Kaneko, (1992) W Li, K Kaneko (1992), Long-range correlation and partial 1/fα spectrum in a noncoding DNA sequence, Europhys. Lett., 17:655-660.
- Li et al., (2013) W Li, D Sosa, MV Jose (2013), Human repetitive sequence densities are mostly negatively correlated with R/Y-based nucleosome-positioning motifs and positively correlated with W/S-based motifs, Genomics, 101:125-133.
- Mani, (1992) GS Mani (1992), Long-range doublet correlations in DNA and the coding regions, J. Theo. Biol., 158:447-464.
- Mathias, (1993) A Mathias (1993), On a conjecture of Erdös and C̆udakov, in Combinatorics, Geometry and Probability: A Tribute to Paul Erdös, eds. B Bollobás, A Thomason (Cambridge University Press), pp.487-488.
- Mills et al., (2006) RE Mills, CT Luttig, CE Larkins, A Beauchamp, C Tsui, WS Pittard, SE Devine (2006), An initial map of insertion and deletion (INDEL) variation in the human genome, Genome Res.,16:1182-1190.
- Nikolaou and Almirantis, (2002) C Nikolaou and Y Almirantis (2002), A study of the middle-scale nucleotide clustering in DNA sequences of various origin and functionality, by means of a method based on a modified standard deviation, J. Theo. Biol., 217:479-492.
- Ohno et al., (1968) S Ohno, U Wolf, NB Atkin (1968), Evolution from fish to mammals by gene duplication, Hereditas, 59:169-187.
- Orenstein and Shamir, (2013) Y Orenstein, R Shamir (2013), Design of shortest double-stranded DNA sequences covering all k-mers with applications to protein-binding microarrays and synthetic enhancers, Bioinformatics, 29:i71-i79.
- Park et al., (2015) CY Park, T Halevy, DR Lee, JJ Sung, JS Lee, O Yanuka, N Benvenisty, DW Kim (2015), Reversion of FMR1 methylation and silencing by editing the triplet repeats in fragile X iPSC-derived neurons, Cell Rep..13:234-241.
- Payseur et al., (2010) BA Payseur, P Jing, RJ Haasl (2010), A genomic portrait of human microsatellite variation, Mol. Biol. & Evol., 28:303-312.
- Peckham et al., (2007) HE Peckham, RE Thurman, Y Fu, JA Stamatoyannopoulos, WS Noble, K Struhl, Z Weng (2007), Nucleosome positioning signals in genomic DNA, Genome Res., 17:1170-1177.
- Peng et al., (1992) CK Peng, SV Buldyrev, AL Goldberger, S Havlin, F Sciortino, M Simon, HE Stanley (1992), Long-range correlations in nucleotide sequences, Nature, 356:168-170.
- Quinlan and Hall, (2010) AR Quinlan, IM Hall (2010), BEDTools: a flexible suite of utilities for comparing genomic features, Bioinformatics, 26:841-842.
- Richly and Leister, (2004) E Richly and D Leister (2004), NUMTs in sequenced eukaryotic genomes, Mol. Biol. & Evol., 21:1081-1084.
- Riklund et al., (1987) R Riklund, M Severin, Y Liu (1987), The Thue-Morse aperidic crystal, a link between the Finonacci quasicrystal and the periodic crystal”, Int. J. Mod. Phys. B, 1:121-132.
- Schildkraut et al., (1962) CL Schildkraut, J Marmur, P Doty (1962), Determination of the base composition of deoxyribonucleic acid from its buoyant density in CsCl, J. Mol. Biol., 4:430-443.
- Segal et al., (2006) E Segal, Y Fondufe-Mittendorf, L Chen, An Thåström, Y Field, IK Moore, JP Wang, J Widom (2006), A genomic code for nucleosome positioning, Nature, 442:772-778.
- Shepherd, (1981) JC Shepherd (1981), Method to determine the reading frame of a protein from the purine/pyrimidine genome sequence and its possible evolutionary justification, Proc. Natl. Acad. Sci., 78:1596-1600.
- Smit, (1996) AFA Smit (1996), The origin of interspersed repeats in the human genome, Curr. Opin. Genet. Devel., 6:743-748.
- Soler-Toscano et al., (2014) F Soler-Toscano, H Zenil, JP Delahaye, N Gauvrit (2014), Calculating Kolmogorov complexity from the output frequency distributions of small Turning machines, PLoS ONE, 9:e96223.
- Soundararajan, (2018) K Soundararjan (2018), Tao’s resolution of the Erdös discrepancy problem, Bull. Am. Math. Soc., 55:81-92.
- Swartz et al., (1962) MN Swartz, TA Trautner, A Kornberg (1962), Enzymatic synthesis of deoxyribonucleic acid, J. Biol. Chem., 237:1961-1967.
- Tao, (2016) T Tao (2016), The Erdös discrepancy problem, Discrete Analysis, 2016:1.
- Thanos et al., (2018) D Thanos, W Li, A Provata (2018), Entropic fluctuations in DNA sequences, Physica A, 493:444-457.
- Timmis et al., (2004) JN Timmis, MA Ayliffe, CY Huang, W Martin (2004), Endosymbiotic gene transfer: organelle genomes forge eukaryotic chromosomes, Nature Rev. Genet., 5:123-135.
- Trifonov, (2010) EN Trifonov (2010), Nucleosome positioning by sequence, state of the art and apparent finale, J. Biomol. Stru. Dyn., 27:741-746.
- Trifonov and Sussman, (1980) EN Trifonov and JL Sussman (1980), The pitch of chromatin DNA is reflected in its nucleotide sequence, Proc. Natl. Acad. Sci., 77:3816-3820.
- Zhang and Zhang, (1994) R Zhang and CT Zhang (1994), Z curves, an intuitive tool for visualizing and analyzing the DNA sequences, J. Biomol. Struc. & Dyn., 11:767-782.
- Ziv and Lempel, (1977) J Ziv and A Lempel (1977), A universal algorithm for sequential data compression, IEEE Trans. Info. Theo., 23:337-343.
- Vinson and Chatterjee, (2012) C Vinson and R Chatterjee (2012), CG methylation, Epigenomics, 4:655-663.
- Vitányi, (2001) P Vitányi (2001), Randomness, arXiv:math/0110086 preprint.
- Voss, (1992) RF Voss (1992), Evolution of long-range fractal correlations and 1/f noise in DNA base sequences, Phys. Rev. Lett., 68:3805-3808.
- Wolfe, (2001) KH Wolfe (2001), Yesterday’s polyploids and the mystery of diploidization, Nature Rev. Genet., 2:333-341.

(a) correlation among various Erdös sequence frequencies
| % W/S Erdös | % K/M Erdös | overall % Erdös | |
|---|---|---|---|
| % R/Y Erdös | -0.88 (2.8E-6) | -0.64 (0.0014) | -0.75 (5.5E-5) |
| % W/S Erdös | 0.60 (0.0028) | 0.89 (3.2E-6) | |
| % K/M Erdös | 0.78 (2.2E-5) |
(b) correlation between Erdös sequence and other sequence features
| GC% | uniq-seq% | L0-polyA/T % | L10-polyC/G % | R5Y5% | L(sequenced) | |
|---|---|---|---|---|---|---|
| R/Y Erdös | -0.90 (3E-6) | 0.5 (0.02) | -0.69 (4E-4) | -0.71(2E-4) | -0.37(0.08) | 0.74 (8E-5) |
| W/S Erdös | 0.91 (3E-6) | -0.52(0.01) | 0.68(5E-4) | 0.71(2E-4) | 0.38(0.08) | -0.65 (0.001) |
| K/M Erdös | 0.59(0.004) | -0.33(0.1) | 0.52(0.01) | 0.38(0.08) | 0.19(0.37) | -0.24(0.27) |
| overall Erdös | 0.78(2E-5) | -0.35(0.1) | 0.62(0.002) | 0.53(0.01) | 0.36(0.09) | -0.40 (0.06) |
(c) correlation among sequence features
| uniq-seq% | L0-polyA/T % | L10-polyC/G % | R5Y5% | L(sequenced) | |
|---|---|---|---|---|---|
| GC % | -0.49(0.02) | 0.85(2E-6) | 0.87(3E-6) | 0.21(0.3) | -0.61(0.003) |
| uniq-seq % | -0.40(0.06) | -0.48(0.02) | -0.21 (0.4) | 0.37(0.08) | |
| L0-polyA/T % | 0.78(2E-5) | -0.092(0.7) | -0.35(0.1) | ||
| L0-polyC/G % | 0.16(0.5) | -0.54(0.008) | |||
| R5Y5 % | -0.33(0.1) |
(a) correlation among various Erdös sequence frequencies
| % W/S Erdös | % K/M Erdös | overall % Erdös | |
|---|---|---|---|
| % R/Y Erdös | -0.68(0) | -0.58 (3.6E-249) | -0.53 (6.3E-199) |
| % W/S Erdös | 0.43 (4.2E-123) | 0.93 (0) | |
| % K/M Erdös | 0.56 (7.8E-231) |
(b) correlation between Erdös sequence and other sequence features
| GC% | uniq-seq% | L0-polyA/T % | L10-polyC/G % | R5Y5% | |
|---|---|---|---|---|---|
| R/Y Erdös | -0.80 (0) | 0.029 (0.13) | -0.65(0) | -0.29(1.5E-52) | -0.15 (2.4E-15) |
| W/S Erdös | 0.87 (0) | 0.089 (3.2E-6) | 0.37 (4.3E-92) | 0.24 (2.5E-36) | 0.51 (3E-181) |
| K/M Erdös | 0.56(7.5E-229) | 0.18 (2.3E-22) | 0.50 (2.1E-173) | 0.22 (4.2E-31) | -0.0052 (0.79) |
| overall Erdös | 0.80 (0) | 0.17(2.6E-19) | 0.33 (8.5E-70) | 0.21 (2E-29) | 0.49 (6.5E-165) |
(c) correlation among sequence features
| uniq-seq% | L0-polyA/T % | L10-polyC/G % | R5Y5% | |
|---|---|---|---|---|
| GC % | 0.090 (2.1E-6) | 0.65(0) | 0.37 (2.4E-92) | 0.28 (3.2E-52) |
| uniq-seq % | -0.091 (1.9E-6) | -0.0043 (0.82) | 0.30 (8.2E-60) | |
| L0-polyA/T % | 0.35(1.6E-80) | -0.25(2.9E-41) | ||
| L0-polyC/G % | -0.038 (0.047) |