The Stellar Halo of the Spiral Galaxy NGC 1560
Abstract
We report on the detection of a stellar halo around NGC 1560, a spiral galaxy member of the Maffei group. We obtained deep images in the and bands using the 10.4m Gran Telescopio Canarias in a field centered at 3.7 arcmin (projected distance of 3.5 kpc) from the center of this galaxy. The luminosity function and the CMD show a clear excess of stars with respect to the expected foreground level at magnitudes fainter than the RGB tip at the distance of NGC 1560. The color of the halo stars implies a metallicity of , while their counts correspond to a stellar mass of in the sampled region. Assuming a power law profile for the surface mass density of the halo, our data suggest a total stellar mass of for the halo of NGC 1560.
1 Introduction
According to models of galaxy formation in a hierarchical universe, the accretion and disruption of small mass satellite galaxies which get captured in the potential well of the main host result in the build up of extended stellar haloes around galaxies (e.g. Cooper et al., 2010). This scenario is strongly supported by the detection of structures in galaxy haloes (e.g. Ferguson et al., 2002), including signatures of ongoing accretion taking place (Foster et al., 2014; Martínez-Delgado et al., 2015). Structures in galaxy halos are usually detected in integrated light (Martínez-Delgado et al., 2010; Miskolczi et al., 2011; Merritt et al., 2016), but only if their surface brightness is high enough. However, the accreted units are eventually completely dissolved, their stars making up a smooth, diffuse, low surface brightness stellar halo. For such component, star counts are more effective to detect and measure the properties (mass, age and metallicity) of the stellar halos, which show up as an excess of sources above the general background. Adopting this tecnique several studies have mapped the smooth stellar halos around galaxies (Mouhcine et al., 2005; Barker et al., 2009; Mouhcine et al., 2010; Tanaka et al., 2011; Greggio et al., 2014; Harmsen et al., 2017). These studies mostly pertain to galaxies with mass comparable to the Milky Way, or more massive, a range in which the potential well of the host galaxy is deep, so that the accretion of several units is well justified.
At the other mass end, extended stellar halos have been revealed also in many dwarf galaxies (see, e.g. Minniti & Zijlstra, 1996; Stinson et al., 2009; McConnachie, 2016). In some cases the merging of two dwarf galaxies takes place, as clearly documented for NGC 4449 (Martínez-Delgado et al., 2012; Rich et al., 2012), so that the low mass unit will eventually provide a stellar halo to the more massive accretor (Bekki, 2008). However, this occurrence could be rare in the standard picture of hierarchical structure formation, and other mechanisms have been proposed to be responsible for the extended halo of dwarfs. In particular, hydrodynamical simulations of galaxy formation show that extended haloes might form around dwarf isolated galaxies due to the contraction of the star forming envelope, and to the ejection of stars formed in supernova driven shocks. The latter process is particularly effective in the lower mass models, with the shallower potential well providing a weaker barrier to the supernovae driven outflows (Stinson et al., 2009).
In this scenario, low mass spiral galaxies could be at the crossroad of these two paths of stellar haloes formation. Massive enough to inhibit a pronounced dispersion of their stars due to the supenovae driven outflows, but not massive enough to efficiently accrete smaller units. These galaxies could host the least conspicuous stellar halos, either in mass fraction, or extension, or both. Thus, we can derive important clues on the general picture concerning the formation of stellar haloes investigating this class of galaxies to answer the questions: do low mass spirals host stellar haloes? What is their mass, extension, density profile? Do they resemble a scaled down version of the haloes of more massive spirals?
The most effective way to measure the properties of a diffuse, low surface brightness, stellar halo is via individual star counts. In stellar populations older than 2 Gyr the evolved stars gather on the RGB, forming a well recognizable feature on the CMD. The number of stars per unit mass of the parent stellar population on the upper magnitude of the RGB is almost independent of age from to Gyr (e.g. Greggio & Renzini, 2011), making these stars effective and robust probes of the total underlying stellar mass.
In this paper we present and band photometry of stars in a field located in the halo of NGC 1560 (Section 2), based on observations at the Gran Telecopio CANARIAS. The program aimed primarily at assessing whether NGC 1560 hosts a stellar halo, and in case at estimating its size. In Section 3 we describe the observations and the data reduction procedure; in Section 4 we present the CMD and luminosity function of the stars in the NGC 1560 halo field; in Section 5 we summarize our results and discuss them in comparison to the properties of other galaxies, and to the predictions of galaxy formation models.
2 The low mass spiral galaxy NGC 1560
NGC 1560 is a late type spiral galaxy (Scd, Sdm) member of the Maffei Group. The distance (3.27Mpc) to NGC 1560 was evaluated by Jacobs et al. (2009) from the location of the Tip of the Red Giant Branch (RGB) on the Colour Magnitude Diagram (CMD) derived from HST photometry in and . The object is located at low galactic latitude (=16 deg), so that the foreground extinction is quite large ( 0.18). This galaxy is relatively isolated: the two nearest companions are Cam A and Cam B at a distance of 500 and 400 kpc, respectively (Karachentsev et al., 2004).
The stellar disk is viewed edge-on (inclination of ), and it is embedded in an extended HI disk, characterized by regular contours. From the analysis of the HI rotation curve Gentile et al. (2010) derived a total (dark + luminous) mass of , while they estimated a stellar mass of from I band photometry. Therefore NGC 1560 is a very good candidate to investigate the properties of stellar haloes at the low mass end of spiral galaxies, also because of the favourable edge-on orientation which allows an unambigous sampling of the halo component.
On the Padova isochrones 111stev.oapd.inaf.it/cgi-bin/cmd (Marigo et al., 2008) the RGB Tip of a 10 Gyr old stellar population is found at M and , respectively for metallicities = 0.004 and 0.0004. The foreground galactic extinction is of 0.32 and 0.43 mag in the and bands respectively. Correspondingly, we expect the RGB Tip of an old and metal poor stellar population in the halo of NGC 1560 to be found at . In the following we will adopt this reference value to flag the presence of RGB stars members of NGC 1560.
3 Observations, data reduction and analysis
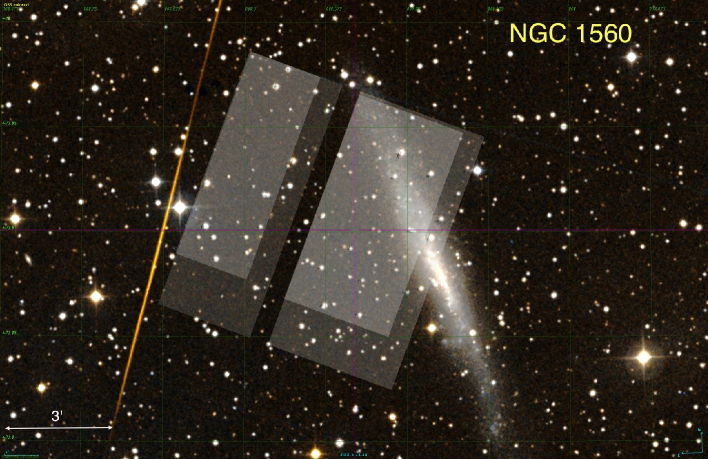
We imaged one field centered at a distance of 3.7 arcmin from the center of the dwarf spiral galaxy NGC 1560 in order to investigate its halo stars (see Figure 1). The observations were obtained using the imager OSIRIS 222http://www.gtc.iac.es/instruments/osiris/osiris.php (Cepa et al., 2003) at the Gran Telescopio CANARIAS (GTC) in La Palma. The imager includes two CCD detectors separated by a small gap allowing a total usable field of 7 8 arcmin2. We secured several short exposure images of both fields using the Sloan filters and with individual exposure time of 60s. In order to improve the quality of the final images the pointing was changed with a pattern of 5-10 arcsec. In the case of the observations in filter two slightly different pointings where adopted resulting into a smaller final field of view with respect to that obtained in filter when combining all frames (see Fig. 1). All the images were reduced using IRAF 333IRAF (Image Reduction and Analysis Facility) , including bias subtraction, flat field correction and cleaning of cosmic rays and other minor defects in the detectors. Using the measured positions of a number of relatively bright, unsaturated and isolated stars in the frames the images were then realigned and co-added. The parameters of the final images are reported in Table 1. The quality of the the final images is good resulting in PSF with FWHM of 0.85 arcsec in both filters. Finally we used observations of photometric standard stars to perform the absolute photometric calibration of the frames.
| Field | Filter | FoV | N.of frames | Tot.Exptime |
|---|---|---|---|---|
| (arcmin) | (sec) | |||
| 1 | 2.8x7.7 | 90 | 5850 | |
| 2 | 3.8x7.7 | 90 | 5850 | |
| 1 | 2.1x6.2 | 88 | 5720 | |
| 2 | 3.2x6.2 | 88 | 5720 |
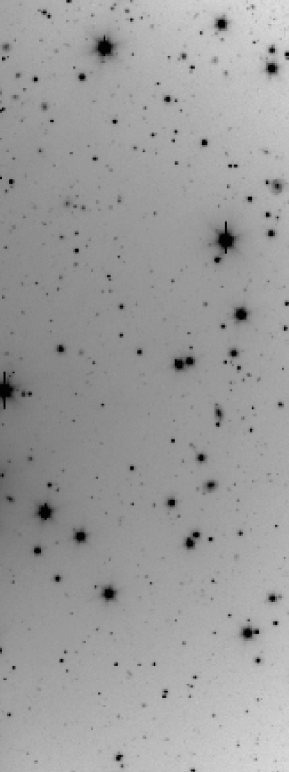
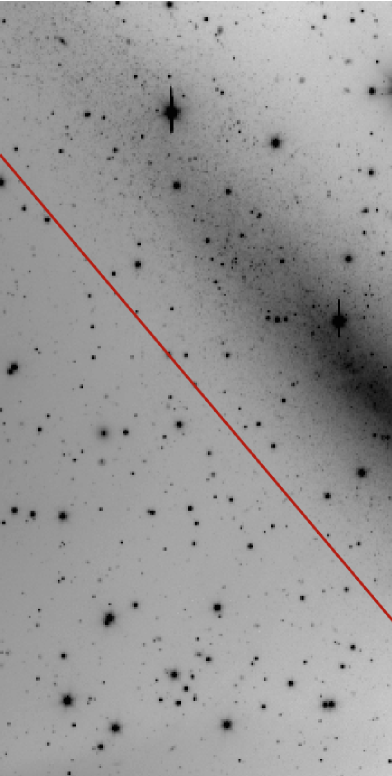
The final observed field is shown in Figure 1 superimposed on a SDSS image of NGC 1560, while Figure 2 shows the coadded band images of the two chips of the OSIRIS detector.

3.1 Stellar Photometry
We performed PSF photometry on the co-added images using the DAOPHOT suite of programs. PSF photometry allowed us to characterize the shape of the sources, so that we could separate stellar from extended objects. Magnitudes were measured with the ALLSTAR routine fitting a PSF constructed with the DAOPSF task, using a number of bright and isolated sources on the individual chips. With a detection threshold of 2.5 , on the band images we measured 2180 sources on chip 1 and 8837 on chip 2, down to 27. In the band images we measured 1195 and 5435 sources down to 27.5 on chip 1 and chip 2, respectively. Chip 2 includes a portion of the disk of NGC 1560, where crowding is high. Since we concentrate on the halo population, in our analysis we only consider sources detected at a distance greater than 1.3 arcmin (corresponding to 1.2 kpc) from the plane of the disk (see Fig. 2), where we count 1619 and 565 sources in the and frames respectively. In the following, this portion of chip 2 will be referred to as chip 2a.
We complement our photometric analysis with artificial stars experiments, in which we add a number of artificial stars of magnitude in the range 24.5 to 26.7 to the -band image. We then perform photometry of the frame including the artificial stars adopting the same DAOPHOT parameters as done on the original image. These experiments allowed us to refine the criteria to select stellar objects from the quality parameters of the DAOPHOT package ( and sharpness) , as well as to assess the error ( as difference between the input and output magnitude) and the completeness of detected stars as a function of their magnitude.
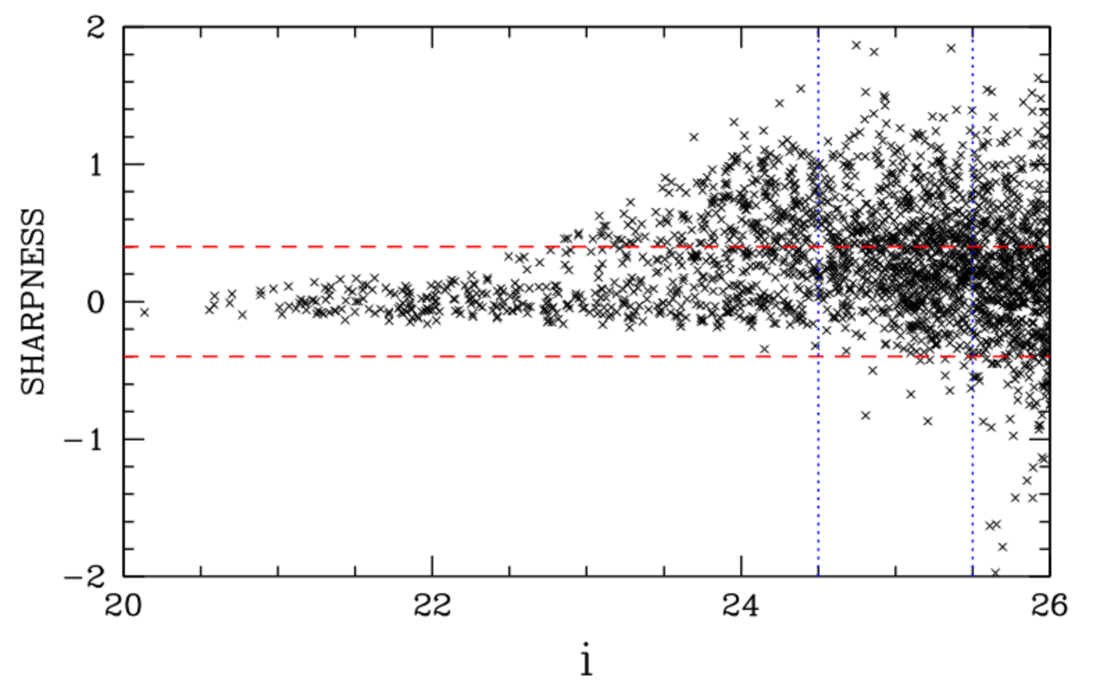
Based on the distribution of the parameter we discarded the objects with 0.5. This criterion excludes 10 % of the sources; most of them are bright, saturated foreground stars. Fig. 3 shows the distribution of the sharpness parameter as a function of the magnitude of the sources, for objects brighter than , that is 1.5 mag fainter than the expected location of the RGB Tip. At most of the sources have sharpness between 0.2 and 0.2, but at fainter magnitudes the spread grows. At a large number of sources with high and positive sharpness values appear. Guided by the results of the artificial stars experiments we selected as bona fide stars the sources with sharpness smaller than 0.4. Upon visual inspection, most sources with sharpness higher than this appear as extended objects. The lower limit to the sharpness parameter adopted is 0.4. The total number of bona fide stars are 983 and 789 respectively on chip 1 and on chip 2a. The distributions of the and sharpness parameters on the -band images have very similar characteristics as those of the -band images. The bona fide stars are 539 in chip 1 and 340 in chip 2a.
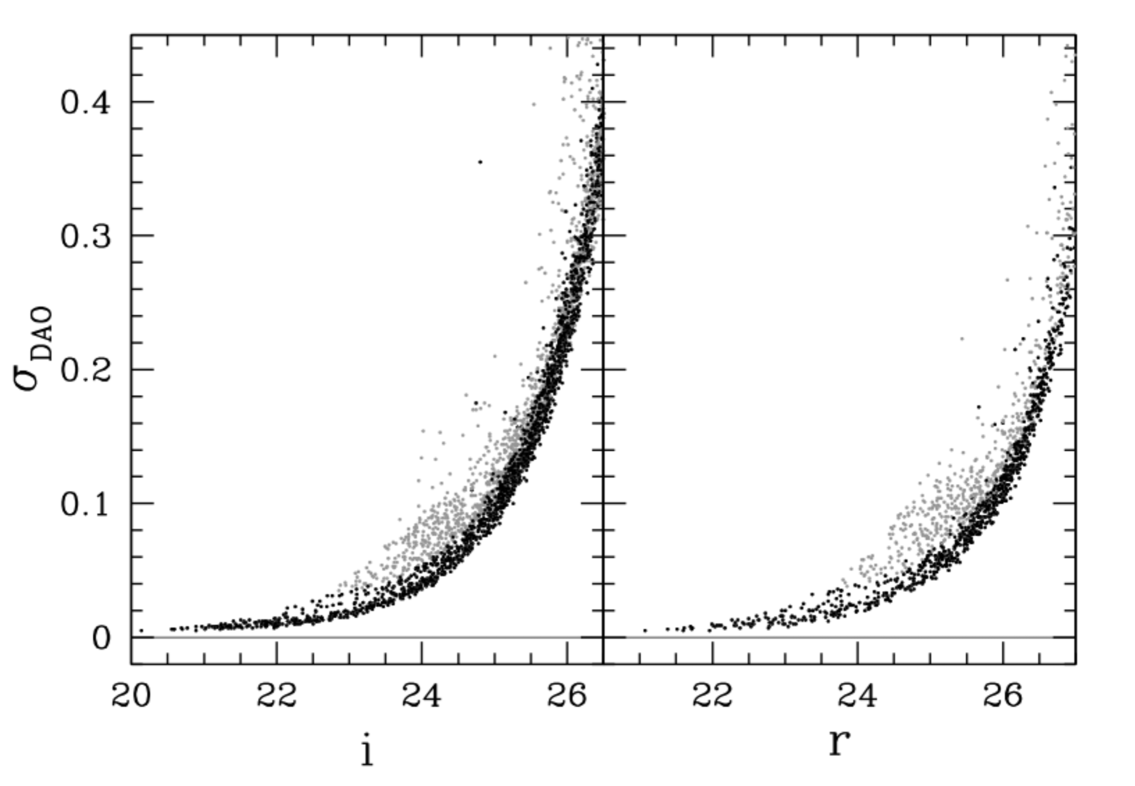
Fig. 4 shows the DAOPHOT photometric accuracy parameter () as function of magnitude for the and bands in the two chips, having again excluded the disk of NGC 1560. The adopted criteria to select the bona fide stars also select the best measured objects.
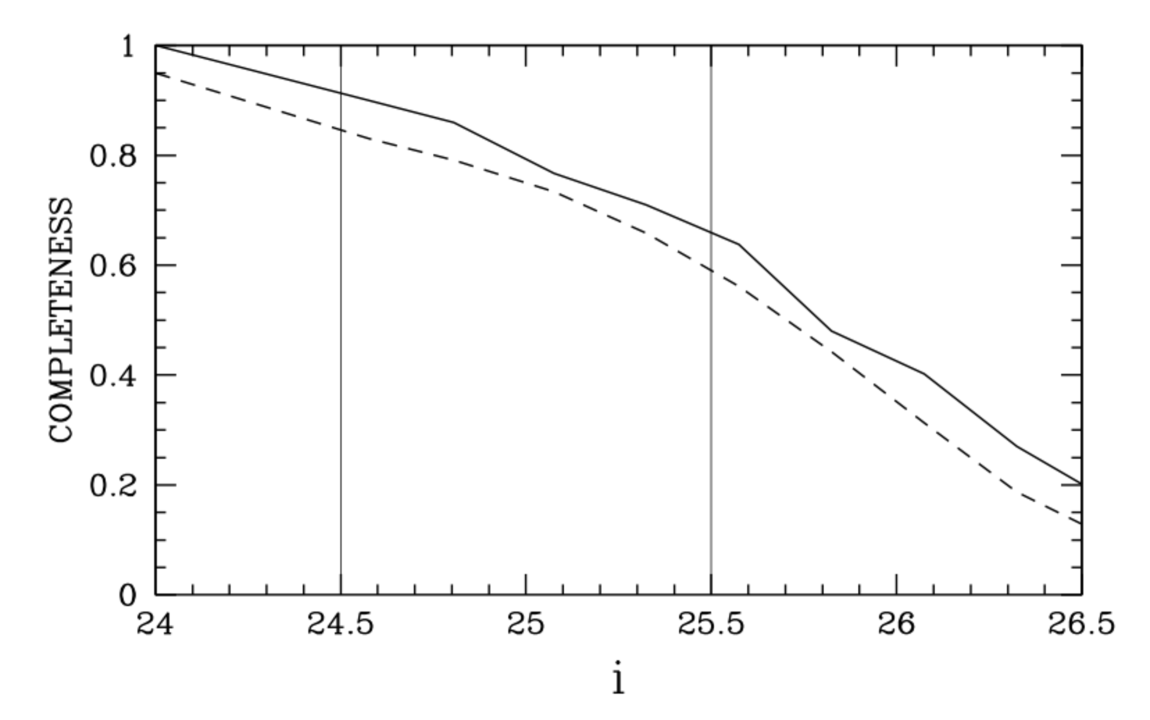
We use the results of the artificial stars experiments to evaluate the completeness of our data as function of magnitude by comparing the number of stars measured on the images with the synthetic stars added, to the number of input artificial stars. Fig. 5 shows the completeness factors as a function of the magnitude. We note that in the magnitude range of interest the completeness of our data is better than 50 % for the bona fide selected sources. The artificial stars experiments were also used to evaluate the true error on the measured magnitude of the bona fide stars. Down to the distribution of is found symmetric around 0 with a dispersion of 0.1, 0.15 and 0.2 for and 26 respectively. At fainter magnitudes the distribution becomes noticeably skewed towards negative values of because sources artificially brightened by blending are more likely to be detected than sources whose brightness is underestimated (see Greggio & Renzini, 2011). We conclude that in the range the quality of our photometry is satisfactory.
4 The Stellar Halo around NGC 1560
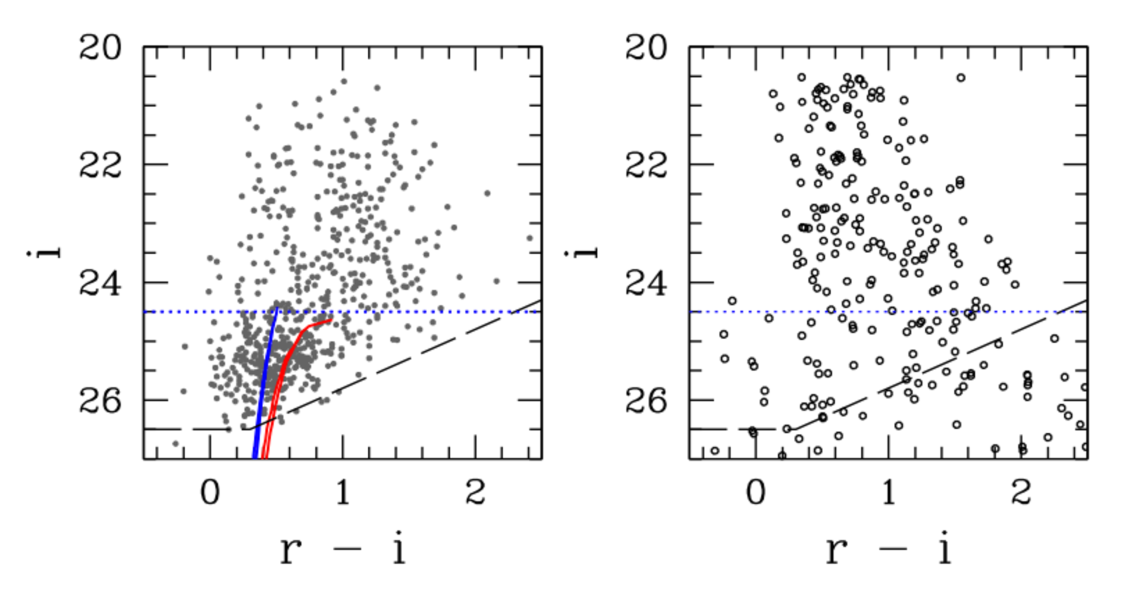
Matching the sources detected in both and we get 302 and 284 bona fide stars respectively on chip 1 and on chip 2a. Fig. 6 shows the relative CMD, to which we superpose 10 Gyr old Padova isochrones with two subsolar metallicities. We compare this CMD with the result of a simulation of the foreground contamination obtained using the TRILEGAL444http://stev.oapd.inaf.it/cgi-bin/trilegal tool (Girardi et al., 2005), at the galactic coordinates of NGC 1560 (see Fig. 6 , right panel). The simulation is computed for an area of 25 arcmin2, close to the area on which our observed CMD is constructed. At magnitudes brighter than our fiducial RGB Tip the observed CMD is very similar to the simulated one, but fainter than RGB Tip there is a clear excess of observed stars with colors appropriate to those of a metal poor old stellar population. The expected number of foreground stars at is significantly smaller than that observed. In addition, at these magnitudes the simulated stars scatter over a much wider color range compared to the data. In the range and we count 274 stars on our CMD, while the simulation of the foreground component contains only 17 objects. We also computed a simulation of the foreground stars using the recently updated Besancon model (Robin et al., 2003)555http://model2016.obs-besancon.fr/ which yields 12 expected foreground objects in this region of the CMD , i.e. even less than the TRILEGAL simulation.This indicates that the observed CMD contains a population of stars members of NGC 1560. In the following, for the foreground stars contamination we will use the more conservative value obtained from TRILEGAL.
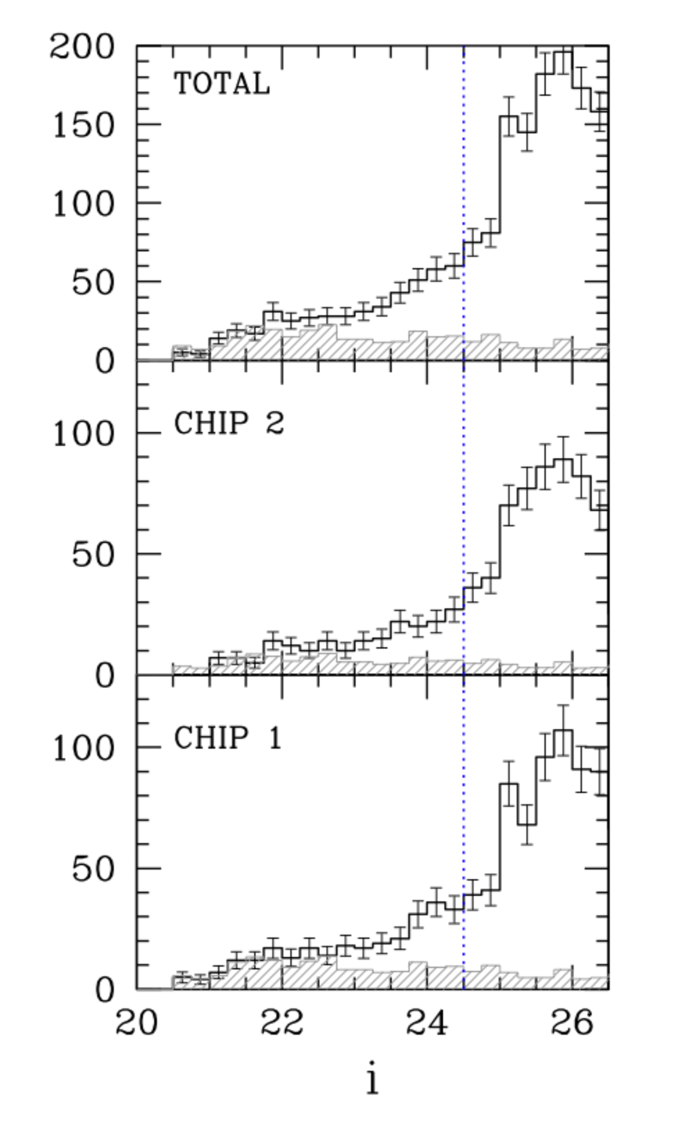
The star counts on the band image shown in Fig. 7 further support our detection of the NGC 1560 stellar halo . Compared to the foreground, the observed star counts are close to the expected level at 23, while they show a mild excess (a factor of 2) at . These excess sources could be either bright Asymptotic Giant Branch (AGB) stars members of the NGC 1560 halo, or Milky Way stars, if the foreground contribution at these magnitudes were underestimated in the adopted Galaxy model. At a remarkable (a factor of 10) difference between the observed counts and the foreground level is apparent (see Fig. 7). This large excess is present in both chips: the surface density of bona fide stars with is 11 per square arcmin in chip 1, 16 per square arcmin in chip 2a, to be compared with the 1.5 objects per square arcmin of the TRILEGAL simulation. Therefore, most of the stars fainter than belong to the stellar halo of NGC 1560.
In order to estimate the stellar mass traced by our halo field we construct a simple stellar population (SSP) model by distributing stars along an old and metal poor isochrone, following a prescribed initial mass function (IMF). We adopt a 10 Gyr old isochrone with a metallicity of from the Padova (Marigo et al., 2008) set. The choice of the metallicity is motivated by the color of the RGB stars in our field (see Fig. 6), while the adopted value of the age is not critical, since the conversion factor between bright RGB star counts and mass of the parent stellar population is almost constant for ages older than 2 Gyr (Greggio & Renzini, 2011). Figure 8 shows the magnitude distribution of this synthetic stellar population, compared to our data. The model is in acceptable agreement with the completeness corrected observed counts. The normalization of the SSP model yields the total stellar mass needed to reproduce the observed star counts, which turns out of , having adopted a Salpeter IMF ( between 0.1 and 100 ). This is the total mass transformed into stars, while the current mass will be a factor 0.7 lower because of the mass returned to the interstellar medium by stellar wind and supernovae over the long lifetime of the stellar population (see Greggio & Renzini, 2011).
Assuming a spherical halo with a surface mass density described by a power law of index of , close to what found for NGC 253 in Greggio et al. (2014), we find that our band image samples 13 % of the total mass. This indicates a value of stellar halo for this galaxy. Varying the power law index, the mass fraction sampled by our field is of 13 % for , of 10% for , and decreases to 4 % as the profile steepens to . Since chip 1 samples the halo in an outer region compared to chip 2, we may derive indications on the slope of the mass distribution by comparing the star counts in the two chips. The number of bona fide stars with is 234 in chip 1 and 223 in chip 2a . Upon correction for incompleteness, these figures become respectively 332 and 348. The counts include the halo members of NGC 1560 as well as the foreground stars, which, according to the TRILEGAL model, should amount to 40 stars in chip 1 and 25 stars on chip 2 in the same magnitude range. The true members on NGC 1560 should therefore be 292 and 323 in chip 1 and 2a respectively. On the other hand, as argued above, the TRILEGAL model matches very well the star counts in the range , but it falls short of the observed counts in , where we do not expect a sizable population of NGC 1560 members. In fact, these stars should be bright AGB objects, which are very rare in stellar populations older than a few Gyrs (e.g. Noël et al., 2013). If we estimate the foreground contribution from the counts at magnitudes just brighter than the RGB tip, ( ), chip 1 and chip 2a should include respectively and 76 foreground stars with . This would leave 212 and 272 members of NGC 1560 halo stars sampled in chip 1 and 2a. From this discussion we estimate that the ratio between the NGC 1560 halo stars in chip 1 and in chip 2a varies between 0.9 and 0.78, depending on the level of the foreground contribution to the counts. For a spherical halo with a surface mass density scaling as a power law the ratio of the mass sampled in chip 1 and chip 2a decreases from 0.7 to 0.13 as the index varies from to . Therefore our data suggest a quite shallow profile of the mass distribution for the halo of NGC 1560.
5 Summary and discussion
We performed deep photometry in a region centered at a projected distance of 3.5 kpc from the center NGC 1560, a low mass, late type spiral galaxy at a distance of 3.27 Mpc. The favorable edge on orientation of this galaxy, coupled with the relatively wide FoV of the observations allowed us to derive a fair census of the sources projected on the halo area around NGC 1560, where we detect a large excess of stars above the expected foreground contribution. Based on the colors and magnitudes of these sources we conclude that they are bright RGB stars nembers of NGC 1560. Their color is appropriate for a metal poor stellar population ([Fe/H] ). We measure this excess sources all over the surveyed region, with no apparent concentration towards the galaxy disk. Therefore we conclude that these stars belong to an extended stellar halo around NGC 1560.
The size of the excess counts indicates a stellar mass of in the sampled region, assuming a Salpeter IMF. Comparing the counts in two regions of our surveyed area we favor a quite shallow mass surface density profile of the halo component, with a slope of for a power law distribution. Assuming a spherical halo with such a shallow profile, and keeping in mind the uncertainty of the foreground contribution, the sampled region collects 13 % of the total halo mass, which then turns out of .
The sampled mass and the profile that we derive depend on the assumptions regarding the contribution of the foreground stars and of the background galaxies. Both the TRILEGAL and the Besancon simulators of the Milky Way population in the direction of NGC 1560 predict a negligible number of foreground sources at magnitudes fainter than the RGB Tip in our sampled fields. On the other hand, the number of compact background galaxies at these faint magnitudes might be relevant. To minimize this kind of contaminants we have selected sources with a small value of the sharpness parameter from the DAOPHOT PSF fitting photometry. Based on the results of the artificial stars experiments, we defined as bona fide stars sources with sharpness smaller than 0.4 (in absolute value). Using a more restrictive criterion the mass sampled on chip 1 and chip 2a varies. For example, changing the threshold from 0.4 to 0.2, the number of bona fide stars decreases by 25 % in both chips. While this corresponds a smaller mass for the stellar halo of NGC 1560, the excess of point like sources with respect to the expected foreground stars remains significant. The detection of an extended stellar halo around NGC 1560 is thus a robust result, while the measurement of its mass and profile is subject to some uncertainty depending on the contribution of unresolved compact galaxies.
We estimate the stellar mass of the main body of NGC 1560 from its I band magnitude (, Buta & McCall (1999)), adopting a Milky Way absorption of , and a mass-to-light ratio of in solar units, which is appropriate for a stellar population with a constant star formation rate over the Hubble time, and a Salpeter IMF. With this assumptions, and our adopted distance modulus of 27.6, the mass NGC 1560 results of , so that the ratio between the mass of the halo and the mass of the main body of the galaxy is 0.1.
Harmsen et al. (2017) summarize the properties of the stellar haloes of Milky Way mass spiral galaxies from the GHOSTS survey. These appear characterized by steep surface mass density profiles (), and a large diversity of stellar halo mass fractions (). Our data for NGC 1560 suggest a quite shallower profile, and a high stellar halo mass fraction. How do these properties compare to the results of numerical simulations?
Detailed computations of the structure of galaxy stellar haloes within the cold dark matter cosmological model are available mostly for galaxies with mass in a range akin to the Milky Way and Andromeda (e.g. Lackner et al., 2012; McCarthy et al., 2012; Cooper et al., 2013; Tissera et al., 2014). Recently Rodriguez-Gomez et al. (2016) have extended the mass range to include objects with stellar mass down to . In their models, the lowest mass galaxies typically host an accreted stellar mass of few percent of the total galaxy mass, but with a large variance, and an accreted mass fraction up to 0.1 is reported for galaxies of . In these models, the accreted stars are distributed in an elongated envelope characterized by a steep density drop. Steep slopes for the outer regions are also found in models of dwarf galaxies (Stinson et al., 2009; Bekki, 2008; Valcke et al., 2008), and in observational data (e.g. Battinelli et al., 2006; D’Souza et al., 2014). Although a direct comparison of our results with those of other galaxies, and of theoretical models, is hindered by differences in mass and methods of analysis, it appears that in the case of NGC 1560, the stellar halo has an extended and flat profile which may pose important constraints to galaxy formation models of low mass spiral galaxies. This halo extends over a wide region: we detect stars at distances 3 larger than the edge of the HI disk, as measured by Gentile et al. (2010). The HI distribution appears undisturbed, the galaxy is isolated, and there is no evidence of a recent interaction. This suggests that the stellar halo of NGC 1560 was acquired at an early epoch, possibly built during the original collapse which led to the formation of the disk.
References
- Barker et al. (2009) Barker, M. K., Ferguson, A. M. N., Irwin, M., Arimoto, N., & Jablonka, P. 2009, AJ, 138, 1469
- Battinelli et al. (2006) Battinelli, P., Demers, S., & Kunkel, W. E. 2006, A&A, 451, 99
- Bekki (2008) Bekki, K. 2008, ApJ, 680, L29
- Buta & McCall (1999) Buta, R. J., & McCall, M. L. 1999, lApJS, 124, 33
- Cepa et al. (2003) Cepa, J., Aguiar-Gonzalez, M., Bland-Hawthorn, J., et al. 2003, in Proc. SPIE, Vol. 4841, -, 1739–1749
- Cooper et al. (2013) Cooper, A. P., D’Souza, R., Kauffmann, G., et al. 2013, MNRAS, 434, 3348
- Cooper et al. (2010) Cooper, A. P., Cole, S., Frenk, C. S., et al. 2010, MNRAS, 406, 744
- D’Souza et al. (2014) D’Souza, R., Kauffman, G., Wang, J., & Vegetti, S. 2014, MNRAS, 443, 1433
- Ferguson et al. (2002) Ferguson, A. M. N., Irwin, M. J., Ibata, R. A., Lewis, G. F., & Tanvir, N. R. 2002, AJ, 124, 1452
- Foster et al. (2014) Foster, C., Lux, H., Romanowsky, A. J., et al. 2014, MNRAS, 442, 3544
- Gentile et al. (2010) Gentile, G., Baes, M., Famaey, B., & van Acoleyen, K. 2010, MNRAS, 406, 2493
- Girardi et al. (2005) Girardi, L., Groenewegen, M. A. T., Hatziminaoglou, E., & da Costa, L. 2005, A&A, 436, 895
- Greggio et al. (2014) Greggio, L., Rejkuba, M., Gonzalez, O. A., et al. 2014, A&A, 562, A73
- Greggio & Renzini (2011) Greggio, L., & Renzini, A. 2011, Stellar Populations. A User Guide from Low to High Redshift
- Harmsen et al. (2017) Harmsen, B., Monachesi, A., Bell, E. F., et al. 2017, MNRAS, 466, 1491
- Jacobs et al. (2009) Jacobs, B. A., Rizzi, L., Tully, R. B., et al. 2009, AJ, 138, 332
- Karachentsev et al. (2004) Karachentsev, I. D., Karachentseva, V. E., Huchtmeier, W. K., & Makarov, D. I. 2004, AJ, 127, 2031
- Lackner et al. (2012) Lackner, C. N., Cen, R., Ostriker, J. P., & Joung, M. R. 2012, MNRAS, 425, 641
- Marigo et al. (2008) Marigo, P., Girardi, L., Bressan, A., et al. 2008, A&A, 482, 883
- Martínez-Delgado et al. (2015) Martínez-Delgado, D., D’Onghia, E., Chonis, T. S., et al. 2015, AJ, 150, 116
- Martínez-Delgado et al. (2010) Martínez-Delgado, D., Gabany, R. J., Crawford, K., et al. 2010, AJ, 140, 962
- Martínez-Delgado et al. (2012) Martínez-Delgado, D., Romanowsky, A. J., Gabany, R. J., et al. 2012, ApJ, 748, L24
- McCarthy et al. (2012) McCarthy, I. G., Font, A. S., Crain, R. A., et al. 2012, MNRAS, 420, 2245
- McConnachie (2016) McConnachie, A. W. 2016, in IAU Symposium, Vol. 317, The General Assembly of Galaxy Halos: Structure, Origin and Evolution, ed. A. Bragaglia, M. Arnaboldi, M. Rejkuba, & D. Romano, 15–20
- Merritt et al. (2016) Merritt, A., van Dokkum, P., Abraham, R., & Zhang, J. 2016, ApJ, 830, 62
- Minniti & Zijlstra (1996) Minniti, D., & Zijlstra, A. A. 1996, ApJ, 467, L13
- Miskolczi et al. (2011) Miskolczi, A., Bomans, D. J., & Dettmar, R.-J. 2011, A&A, 536, A66
- Mouhcine et al. (2010) Mouhcine, M., Ibata, R., & Rejkuba, M. 2010, ApJ, 714, L12
- Mouhcine et al. (2005) Mouhcine, M., Rich, R. M., Ferguson, H. C., Brown, T. M., & Smith, T. E. 2005, ApJ, 633, 828
- Noël et al. (2013) Noël, N. E. D., Greggio, L., Renzini, A., Carollo, C. M., & Maraston, C. 2013, ApJ, 772, 58
- Rich et al. (2012) Rich, R. M., Collins, M. L. M., Black, C. M., et al. 2012, Nature, 482, 192
- Robin et al. (2003) Robin, A. C., Reylé, C., Derrière, S., & Picaud, S. 2003, A&A, 409, 523
- Rodriguez-Gomez et al. (2016) Rodriguez-Gomez, V., Pillepich, A., Sales, L. V., et al. 2016, MNRAS, 458, 2371
- Stinson et al. (2009) Stinson, G. S., Dalcanton, J. J., Quinn, T., et al. 2009, MNRAS, 395, 1455
- Tanaka et al. (2011) Tanaka, M., Chiba, M., Komiyama, Y., Guhathakurta, P., & Kalirai, J. S. 2011, ApJ, 738, 150
- Tissera et al. (2014) Tissera, P. B., Beers, T. C., Carollo, D., & Scannapieco, C. 2014, MNRAS, 439, 3128
- Valcke et al. (2008) Valcke, S., de Rijcke, S., & Dejonghe, H. 2008, MNRAS, 389, 1111