Detection of the Galactic Warm Neutral Medium in Hi 21cm absorption
Abstract
We report a deep Giant Metrewave Radio Telescope (GMRT) search for Galactic Hi 21cm absorption towards the quasar B0438436, yielding the detection of wide, weak Hi 21cm absorption, with a velocity-integrated Hi 21cm optical depth of km s-1. Comparing this with the Hi column density measured in the Parkes Galactic All-Sky Survey gives a column density-weighted harmonic mean spin temperature of K, one of the highest measured in the Galaxy. This is consistent with most of the Hi along the sightline arising in the stable warm neutral medium (WNM). The low peak Hi 21cm optical depth towards B0438436 implies negligible self-absorption, allowing a multi-Gaussian joint decomposition of the Hi 21cm absorption and emission spectra. This yields a gas kinetic temperature of K, and a spin temperature of K for the gas that gives rise to the Hi 21cm absorption. Our data are consistent with the Hi 21cm absorption arising from either the stable WNM, with , K, and little penetration of the background Lyman- radiation field into the neutral hydrogen, or from the unstable neutral medium, with .
keywords:
ISM: atoms – ISM: general – radio lines: ISM1 Introduction
Neutral hydrogen (Hi) is a key constituent of the interstellar medium (ISM) of galaxies, making up almost half the ISM in the Milky Way. The earliest Hi 21cm studies (e.g. Clark, 1965) found evidence that Hi exists in two phases, the cold neutral medium (CNM), which gives rise to the narrow, deep components seen in Hi 21cm absorption spectra towards background radio sources, and the warm neutral medium (WNM), which contributes to the relatively smooth and broad Hi 21cm emission profiles but has very weak Hi 21cm absorption. Similarly, theoretical models indicate that Galactic Hi exists in one of the above two stable phases, with low kinetic temperatures ( K) and high number densities () in the CNM, and high temperatures ( K) and low number densities () in the WNM (e.g. Field, Goldsmith & Habing, 1969; McKee & Ostriker, 1977; Wolfire et al., 1995, 2003). Hi at intermediate temperatures ( K) is expected to be unstable, and to quickly move into one of the two stable phases.
Over the last few decades, Hi 21cm absorption studies have made much progress in characterising conditions in the CNM in the Galaxy (e.g. Radhakrishnan et al., 1972; Dickey, Terzian & Salpeter, 1978; Payne, Salpeter & Terzian, 1983; Heiles & Troland, 2003; Roy et al., 2013), finding that the CNM indeed has K, consistent with theoretical expectations. However, the complexity of the Hi 21cm emission profiles and the difficulty of detecting the WNM in Hi 21cm absorption have made it difficult to verify the prediction of a stable warm phase with K. Indeed, attempts at measuring the WNM temperature by fitting multi-Gaussian models to either a combination of Hi 21cm emission and absorption spectra (Heiles & Troland, 2003, 2003), or interferometric Hi 21cm absorption spectra (Kanekar et al., 2003; Roy, Kanekar & Chengalur, 2013; Murray et al., 2015) have found significant fractions of the Hi to be in the thermally unstable phase, with K. Very few of the above Gaussian components show temperatures within or larger than the stable WNM range, K. However, most of the sightlines in the above studies have complex Hi 21cm absorption profiles, implying that one is typically searching for WNM absorption in the presence of far stronger, multi-component CNM absorption.
The best sightlines for a reliable detection of the WNM in Hi 21cm absorption, and for an accurate estimate of the WNM kinetic temperature, are those with the least complexity in the Hi 21cm absorption profile. Our earlier interferometric Hi 21cm absorption survey of compact radio sources achieved root-mean-square (RMS) Hi 21cm optical depth noise values of per km s-1 channel, and yielded detections of Hi 21cm absorption in 33 of 34 sightlines. The sole sightline without a detection of absorption, towards the quasar B0438436, has one of the lowest Hi column densities of the sample ( cm-2; Kalberla & Haud, 2015), and is at a high Galactic latitude, implying low CNM contamination. The absence of CNM absorption on this sightline, despite the high sensitivity of our survey, suggests that B0438436 is a good target for a clean search for the WNM in absorption. We hence used the Giant Metrewave Radio Telescope (GMRT) to carry out a deep search for Hi 21cm absorption towards B0438436, the results of which are described in this Letter.
2 Observations, data analysis, and results
Our GMRT search for Galactic Hi 21cm absorption towards B0438436 was carried out over May , 2011, using the L-band receivers, with a total observing time of hours over 6 observing sessions. The GMRT Software Backend (GSB) was used as the correlator, with a bandwidth of MHz sub-divided into 512 channels, yielding a total velocity coverage of km s-1 and a velocity resolution of km s-1. We used frequency-switching at the first GMRT local oscillator, on B0438436 itself, to calibrate the system passband; the switching was carried out every five minutes with a throw of 5 MHz. Observations of 3C48 and 3C147 at the start and end of each run were used to calibrate the flux density scale. Since B0438436 is a phase calibrator for the GMRT, no additional phase calibration was necessary. The use of the GSB for these observations implied a far superior data quality and a larger total velocity coverage than those of our earlier GMRT observations of B0438436 (Roy et al., 2013). Allied with our higher sensitivity, this significantly improved our ability to detect wide Hi 21cm absorption lines.
All data were analysed in the Astronomical Image Processing System (AIPS; Greisen, 2003), following standard data editing, calibration, self-calibration, imaging, and continuum subtraction procedures (e.g. Roy et al., 2013). The data from the observing run on 6 May were found to be severely affected by RFI, and were hence excluded from the later analysis. The task cvel was finally used to shift the residual visibilities to the local standard of rest (LSR) velocity frame. These visibilities were then imaged to produce a spectral cube, using natural weighting and excluding baselines shorter than k to reduce contamination from Hi 21cm emission within the primary beam. The Hi 21cm spectrum was obtained by taking a cut through the spectral cube at the location of the quasar; a second-order baseline was then fitted to line-free regions, and subtracted out, to obtain the final Hi 21cm absorption spectrum.
We measured a flux density of 4.2 Jy for B0438436 from the final GMRT continuum image; the error on this value is dominated by uncertainties in the GMRT flux density scale, which we estimate to be %. The flux density is in reasonable agreement with the value of 5.0 Jy listed in the Very Large Array Calibrator Manual.
For Galactic Hi 21cm absorption studies, the spectral RMS noise depends on the observing frequency, due to the contribution from the brightness temperature of the Hi emission in the beam (Roy et al., 2013). We followed the procedure of Roy et al. (2013) to combine the brightness temperature measured in the Parkes Galactic All-Sky Sky Survey (GASS; McClure-Griffiths et al., 2009; Kalberla & Haud, 2015) Hi 21cm emission spectrum with the GMRT system temperature ( K at 1420 MHz), to determine the RMS noise spectrum. Note that this correction is very small for B0438436 as the peak Hi 21cm brightness temperature in the GASS spectrum is only K, far lower than the GMRT system temperature at the observing frequency. The final optical depth RMS noise on the GMRT spectrum is per km s-1 channel.
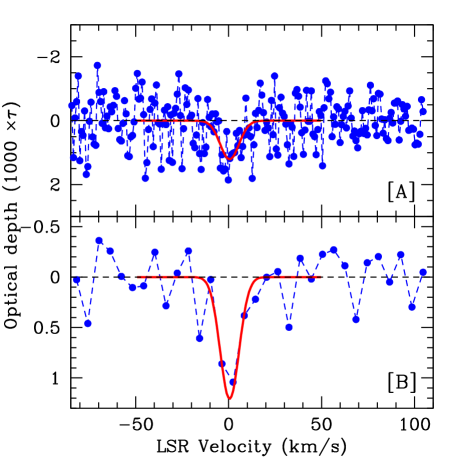
Fig. 1[A] shows our final Galactic Hi 21cm absorption spectrum towards B0438436, with Hi 21cm optical depth plotted versus LSR velocity, after Hanning-smoothing and re-sampling the spectrum, at a velocity resolution of km s-1 (with an optical depth RMS noise of per 0.86 km s-1 channel). Weak absorption can be seen close to zero LSR velocity. Fig. 1[B] shows the spectrum after additional smoothing and re-sampling, at a velocity resolution of km s-1; the RMS optical depth noise on this spectrum is per km s-1. The Hi 21cm absorption is now clearly visible, detected at significance: the velocity-integrated Hi 21cm optical depth (over line channels) is km s-1. The rest of the spectrum, away from the absorption feature, shows no evidence for any structure in the baseline. The Kolmogorov-Smirnov rank-1 and Anderson-Darling tests find that the off-line channels are consistent with being drawn from a Gaussian distribution.
3 Discussion
 |
 |
Neutral hydrogen is usually characterized by two “temperatures”, the kinetic temperature, , and the Hi 21cm line excitation temperature, the spin temperature, . In the case of the high-density CNM, the Hi hyperfine levels are expected to be thermalized by a combination of collisions and Lyman- scattering, with the spin temperature approximately equal to the kinetic temperature (e.g. Wouthuysen, 1952; Field, 1958; Liszt, 2001). Observationally, low spin temperatures ( K) have indeed been found to be associated with the narrow Hi 21cm absorption features that are expected to arise in the CNM (e.g. Dickey, Terzian & Salpeter, 1978; Heiles & Troland, 2003; Roy et al., 2013). However, in the case of the WNM, the low number density implies that collisions are not very effective in thermalizing the Hi 21cm transition. Resonant scattering of Lyman- photons is hence expected to be the main process in driving towards (e.g. Field, 1965; Deguchi & Watson, 1985; Liszt, 2001). It has long been unclear whether the fraction of the Galactic Lyman- background radiation threading into the WNM is sufficient to drive the WNM spin temperature to the kinetic temperature (e.g. Deguchi & Watson, 1985; Liszt, 2001). Theoretical studies suggest that in the WNM, due to both the low WNM number density and the expected low penetration of background Lyman- photons into the WNM (e.g. Liszt, 2001). A few early observational studies did obtain high spin temperature estimates, K (e.g. Kalberla, Mebold & Reich, 1980; Payne, Salpeter & Terzian, 1983; Kulkarni, Heiles & Dickey, 1985), albeit usually on sightlines with complex Hi 21cm absorption and with concerns about stray radiation affecting the Hi 21cm emission spectra. Further, while values K have recently been found at specific velocity ranges along multiple Galactic sightlines (e.g. Carilli, Dwarakanath & Goss, 1998; Dwarakanath, Carilli & Goss, 2002; Heiles & Troland, 2003; Roy et al., 2013), it is not usually straightforward to estimate at the same velocity ranges, making it difficult to test whether the Hi 21cm hyperfine excitation is indeed sub-thermal in the WNM.
Next, the Hi column density along a sightline is related to the velocity-integrated Hi 21cm optical depth by the equation
| (1) |
where is the column density-weighted harmonic mean spin temperature along the sightline. Note that is biased towards low CNM temperatures: for example, if the Hi along the sightline is equally divided between phases with K and K, one would obtain K. Even if 90% of the Hi along the sightline has K, and 10% has K, one would measure K. Exacerbating this issue, spin temperatures in the WNM are expected to be lower than the kinetic temperature, and are hence likely to be significantly lower than the assumed 8000 K (e.g. Liszt, 2001). As such, high values of , K, can only be obtained for sightlines with almost all the gas in the WNM.
In the case of the sightline towards B0438436, the GASS Hi emission spectrum yields an Hi column density of cm-2. Combining this with our measured integrated Hi 21cm optical depth of km s-1 then yields K. This is one of the highest column density-weighted harmonic mean spin temperatures ever measured along a sightline in the Milky Way, comparable to values seen in low-metallicity damped Lyman- absorbers at high redshifts (e.g. Kanekar & Chengalur, 2003; Kanekar et al., 2014). The sightline towards B0438436 is clearly dominated by the WNM, with almost no cold gas present towards the quasar. The lack of CNM along this low- sightline is consistent with the Hi column density threshold of cm-2 that has been suggested for the formation of significant amounts of cold atomic gas in the Milky Way (Kanekar, Braun & Roy, 2011).
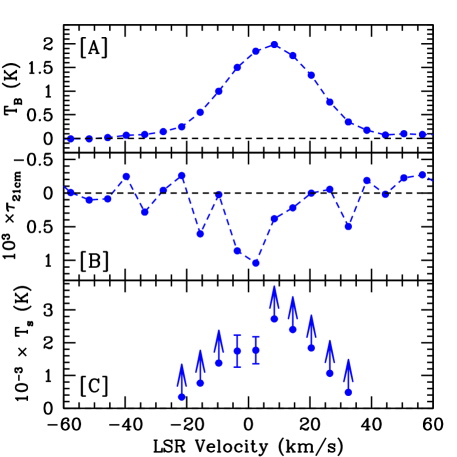
Figs. 2[A] and [B] compare the GMRT Hi 21cm absorption spectrum towards B0438436 with the GASS Hi 21cm emission spectrum at a neighbouring location, with both spectra plotted versus LSR velocity, after smoothing to, and re-sampling at, a velocity resolution of 6.0 km s-1. It is clear that the peak Hi 21cm absorption occurs at a slightly lower velocity ( km s-1) than the peak of the Hi 21cm emission ( km s-1). Indeed, the bulk of gas detected in Hi 21cm emission appears to not be detected in Hi 21cm absorption.
Fig. 2[C] shows the spin temperature, , plotted versus LSR velocity, at velocities where the Hi 21cm emission is detected at significance. Velocity channels with detections of Hi 21cm absorption at significance are shown as filled circles with error bars, while channels with non-detections of Hi 21cm absorption (i.e. with significance) are shown as lower limits to the spin temperature. While the two velocity channels with detections of absorption have K, the two higher-velocity channels have K. These values lie in the expected range for WNM spin temperatures (e.g. Liszt, 2001).
The above results demonstrate that most or all of the gas towards B0438436 is warm, with high spin temperatures, K, consistent with an origin in the stable WNM, at all channels with significant Hi 21cm emission. We also carried out a Gaussian decomposition of the Hi 21cm absorption profile of Fig. 1[A], at a resolution of 0.86 km s-1; a single Gaussian, shown as the solid curves in Figs. 1[A] and [B], provides an excellent fit to the spectrum; this has a full width at half maximum (FWHM) of km s-1, corresponding to a temperature of K. We emphasize that this estimate corresponds to the maximum allowed value of the kinetic temperature, sometimes referred to as the “Doppler temperature” (; e.g. Roy et al., 2013), as non-themal motions may contribute to the line broadening. This estimate of the Doppler temperature is very similar to the column density-weighted harmonic mean spin temperature estimate of K, and may suggest that the gas towards B0438436 is in the unstable phase, with . However, we emphasize that the above kinetic temperature estimate is consistent (within significance) with the standard stable WNM kinetic temperature range ( K). This conclusion is rendered even more unlikely because K at the velocity channels with the strongest Hi 21cm absorption. Deeper Hi 21cm absorption studies are needed to accurately estimate via the Gaussian decomposition approach.
| Component | a | V0b | FWHM | c | d | e |
|---|---|---|---|---|---|---|
| K | km s-1 | km s-1 | K | K | ||
| 1 | ||||||
| 2 | ||||||
| 3 | ||||||
| 4 | ||||||
| 5 |
For each component, the columns are: aThe peak brightness temperature; bThe central LSR velocity; cThe peak Hi 21cm optical depth, or, for non-detections, the upper limit on the peak Hi 21cm optical depth, at a velocity resolution equal to the line FWHM; dThe kinetic temperature inferred from the FWHM; eThe spin temperature or, for components 2–5, the lower limit to the spin temperature.
Attempts have been made in the literature to carry out a joint multi-Gaussian decomposition of the Hi 21cm emission and the Hi 21cm absorption spectra (e.g. Heiles & Troland, 2003; Murray et al., 2014). These have usually encountered difficulties in handling Hi 21cm “self-absorption” along the sightline, by foreground CNM clouds of their own, and of background CNM and WNM, emission. The present sightline towards B0438436 is very interesting in this context because the low peak Hi 21cm optical depth () means that self-absorption is not an issue. The sightline thus allows the possibility of a joint Gaussian decomposition of the Hi 21cm absorption and emission spectra without any effects of self-absorption.
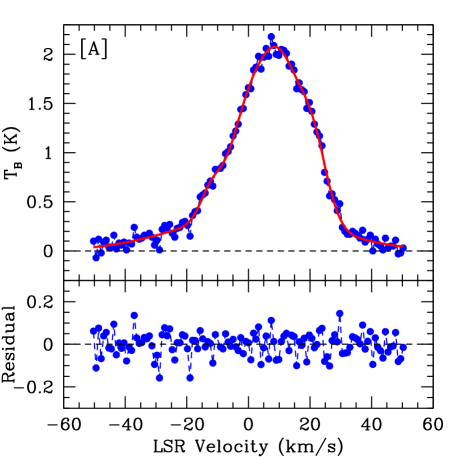
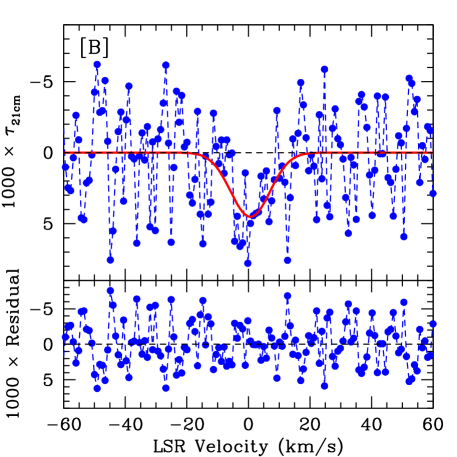
We carried out a joint multi-Gaussian fit to the Hi 21cm emission and Hi 21cm absorption spectra, the former at the original velocity resolution of km s-1, and the latter after Hanning-smoothing and resampling, at a resolution of km s-1. We allowed for Hi 21cm absorption by a single Gaussian component and Hi 21cm emission by multiple Gaussian components. In the fit, the position and FWHM of one of the emission components was constrained to be the same as that of the absorption component (using multiple absorption components did not yield a better fit, in terms of an improved reduced chi-square value). The best-fit model, with a reduced chi-square , contains 5 emission components and one absorption component. The model is plotted in Figs. 3[A] and [B], with the residuals from the fit displayed in the lower two panels; the residuals are seen to be consistent with noise. The properties of the different Gaussian components are summarized in Table 1, whose columns contain (1) the component number, (2) the peak brightness temperature of the component, in K, (3) the central LSR velocity, in km s-1, (4) the component FWHM, in km s-1, (5) the peak Hi 21cm optical depth, or the upper limit to the peak optical depth (estimated at a velocity resolution equal to the component FWHM), (6) the kinetic temperature of the component, , and (7) the component spin temperature , or the lower limit to the spin temperature.
Initially, we note that the third component in Table 1 is extremely wide, with an FWHM of km s-1. Given the relatively high Galactic latitude of B0438436 (), it appears unlikely that this large broadening arises from either Galactic rotation or turbulence. We suspect that it may be due to a residual spectral baseline in the GASS spectrum, although we note that a similar wide component is also visible in the Hi 21cm spectrum from the Leiden-Argentine-Bonn survey (Kalberla et al., 2005). For now, the origin of the broad component remains unclear.
The component with detected Hi 21cm absorption has an FWHM of km s-1, in good agreement with that obtained from the fit to the Hi 21cm absorption alone ( km s-1). The inferred upper limit on the kinetic temperature is then K, in the stable WNM temperature range. We emphasize, as above, that this is formally an estimate of the Doppler temperature , and hence only yields an upper limit to , due to the possibility of non-thermal broadening.
We consider the two extreme possibilities for line broadening: (1) weak non-thermal motions, for which the kinetic temperature is approximately equal to the Doppler temperature, i.e. K, and (2) strong non-thermal broadening, in which case . In the first case, the detected Hi 21cm absorption arises from the stable WNM. The spin temperature of this component is K, significantly lower than the kinetic temperature. Figs. 2 and 5 of Liszt (2001) suggest that this would require the gas to be at low pressures, cm-3 K, and with almost no Galactic Lyman- background penetrating into the Hi. The data would then support a picture of little coupling between the WNM and the background Lyman- radiation field.
In the second case, of strong non-thermal broadening, the measured Doppler temperature only yields an upper limit to . However, the measured spin temperature gives the constraint , since in the WNM. This implies the range for the component detected in absorption. For strong non-thermal broadening, , the detected Hi 21cm absorption would then still arise in warm gas, albeit from the thermally unstable phase, with , i.e. with strong coupling between the unstable neutral medium and the background Lyman- radiation field. We cannot rule out this possibility with the present data.
Finally, the Doppler temperature of component 2 of Table 1 is marginally consistent with its origin in the stable WNM, albeit with large errors. It is interesting that this component has a relatively high lower limit on its spin temperature, K, which suggests a stronger coupling with the background Lyman- radiation. The Doppler temperatures of components 4 and 5 appear consistent with an origin in the unstable phase, although again with large errors. Again, it is interesting that the lower limit on the spin temperature of component 5 is relatively high, approaching the Doppler temperature. We emphasize, however, that the errors in the Doppler temperature estimates are still quite large. Deeper observations of the Hi 21cm absorption towards B043836 are needed to confirm the above results, both the absolute values of the Doppler temperatures, and hence, the relation between the spin and the kinetic temperatures in the stable WNM and the unstable neutral medium.
4 Summary
We have used the GMRT to detect wide, weak Galactic Hi 21cm absorption towards the quasar B0438436. The velocity-integrated Hi 21cm optical depth is very low, km s-1. Combining this with the Hi column density ( cm-2) measured from the GASS Hi 21cm emission spectrum on a neighbouring sightline yields a column density-weighted harmonic mean spin temperature of K, far higher than typical in the Galaxy. The high value indicates that there is little or no CNM along the sightline towards B0438436. A detailed comparison between the Hi 21cm emission and absorption spectra indicates that K over the range of velocities showing the strongest Hi 21cm emission, consistent with the spin temperature range expected in the stable WNM. The extremely low Hi 21cm optical depth further implies that Hi 21cm self-absorption is negligible along this sightline. We carry out a joint multi-Gaussian decomposition of the Hi 21cm emission and the Hi 21cm absorption profiles, to obtain K for the component with detected Hi 21cm absorption, consistent with the stable WNM temperature range. The spin temperature of this component is K, significantly lower than the kinetic temperature. This suggests that the Hi 21cm line excitation is sub-thermal in the WNM along this sightline, possibly due to low gas pressure or low threading of the Galactic Lyman- background into the WNM. However, the present data cannot rule out the possibility that the detected Hi 21cm absorption might arise from warm gas in the thermally-unstable phase, with significant non-thermal line broadening, and the gas spin temperature comparable to the kinetic temperature.
Acknowledgments
We thank the GMRT staff who have made these observations possible. The GMRT is run by the National Centre for Radio Astrophysics of the Tata Institute of Fundamental Research. NK acknowledges support from the Department of Science and Technology via a Swarnajayanti Fellowship (DST/SJF/PSA-01/2012-13). NR acknowledges support from the Infosys Foundation through the Infosys Young Investigator grant.
References
- Carilli, Dwarakanath & Goss (1998) Carilli C. L., Dwarakanath K. S., Goss W. M., 1998, ApJL, 502, L79
- Clark (1965) Clark B. G., 1965, ApJ, 142, 1398
- Deguchi & Watson (1985) Deguchi S., Watson W. D., 1985, ApJ, 290, 578
- Dickey, Terzian & Salpeter (1978) Dickey J. M., Terzian Y., Salpeter E. E., 1978, ApJS, 36, 77
- Dwarakanath, Carilli & Goss (2002) Dwarakanath K. S., Carilli C. L., Goss W. M., 2002, ApJ, 567, 940
- Field (1958) Field G. B., 1958, Proc. I. R. E., 46, 240
- Field (1965) Field G. B., 1965, ApJ, 142, 531
- Field, Goldsmith & Habing (1969) Field G. B., Goldsmith D. W., Habing H. J., 1969, ApJ, 155, L149
- Greisen (2003) Greisen E. W., 2003, in Astrophysics and Space Science Library, Vol. 285, Information Handling in Astronomy - Historical Vistas, Heck A., ed., p. 109
- Heiles & Troland (2003) Heiles C., Troland T. H., 2003, ApJS, 145, 329
- Heiles & Troland (2003) Heiles C., Troland T. H., 2003, ApJ, 586, 1067
- Kalberla et al. (2005) Kalberla P. M. W., Burton W. B., Hartmann D., Arnal E. M., Bajaja E., Morras R., Pöppel W. G. L., 2005, A&A, 440, 775
- Kalberla & Haud (2015) Kalberla P. M. W., Haud U., 2015, A&A, 578, A78
- Kalberla, Mebold & Reich (1980) Kalberla P. M. W., Mebold U., Reich W., 1980, A&A, 82, 275
- Kanekar, Braun & Roy (2011) Kanekar N., Braun R., Roy N., 2011, ApJ, 737, L33
- Kanekar & Chengalur (2003) Kanekar N., Chengalur J. N., 2003, A&A, 399, 857
- Kanekar et al. (2014) Kanekar N. et al., 2014, MNRAS, 438, 2131
- Kanekar et al. (2003) Kanekar N., Subrahmanyan R., Chengalur J. N., Safouris V., 2003, MNRAS, 346, L57
- Kulkarni, Heiles & Dickey (1985) Kulkarni S. R., Heiles C., Dickey J. M., 1985, ApJ, 291, 716
- Liszt (2001) Liszt H., 2001, A&A, 371, 698
- McClure-Griffiths et al. (2009) McClure-Griffiths N. M. et al., 2009, ApJS, 181, 398
- McKee & Ostriker (1977) McKee C. F., Ostriker J. P., 1977, ApJ, 218, 148
- Murray et al. (2014) Murray C. E. et al., 2014, ApJL, 781, L41
- Murray et al. (2015) Murray C. E. et al., 2015, ApJ, 804, 89
- Payne, Salpeter & Terzian (1983) Payne H. E., Salpeter E. E., Terzian Y., 1983, ApJ, 272, 540
- Radhakrishnan et al. (1972) Radhakrishnan V., Murray J. D., Lockhart P., Whittle R. P. J., 1972, ApJS, 24, 15
- Roy et al. (2013) Roy N., Kanekar N., Braun R., Chengalur J. N., 2013, MNRAS, 436, 2352
- Roy, Kanekar & Chengalur (2013) Roy N., Kanekar N., Chengalur J. N., 2013, MNRAS, 436, 2366
- Wolfire et al. (1995) Wolfire M. G., Hollenbach D., McKee C. F., Tielens A. G. G. M., Bakes E. L. O., 1995, ApJ, 443, 152
- Wolfire et al. (2003) Wolfire M. G., McKee C. F., Hollenbach D., Tielens A. G. G. M., 2003, ApJ, 587, 278
- Wouthuysen (1952) Wouthuysen S. A., 1952, AJ, 57, 31