11email: asanna@mpifr-bonn.mpg.de 22institutetext: INAF, Osservatorio Astronomico di Cagliari, via della Scienza 5, 09047 Selargius (CA), Italy 33institutetext: Institute of Astronomy and Astrophysics, University of Tübingen, Auf der Morgenstelle 10, D-72076 Tübingen, Germany 44institutetext: INAF, Osservatorio Astrofisico di Arcetri, Largo E. Fermi 5, 50125 Firenze, Italy 55institutetext: Harvard-Smithsonian Center for Astrophysics, 60 Garden Street, Cambridge, MA 02138, USA 66institutetext: Dublin Institute for Advanced Studies, Astronomy & Astrophysics Section, 31 Fitzwilliam Place, Dublin 2, Ireland 77institutetext: Department of Astrophysics/IMAPP, Radboud University Nijmegen, PO Box 9010, NL-6500 GL Nijmegen, the Netherlands 88institutetext: Instituto de Radioastronomía y Astrofísica UNAM, Apartado Postal 3-72 (Xangari), 58089 Morelia, Michoacán, México
Discovery of a sub-Keplerian disk with jet around a 20 M⊙ young star
It is well established that Solar-mass stars gain mass via disk accretion, until the mass reservoir of the disk is exhausted and dispersed, or condenses into planetesimals. Accretion disks are intimately coupled with mass ejection via polar cavities, in the form of jets and less collimated winds, which allow mass accretion through the disk by removing a substantial fraction of its angular momentum. Whether disk accretion is the mechanism leading to the formation of stars with much higher masses is still unclear. Here, we are able to build a comprehensive picture for the formation of an O-type star, by directly imaging a molecular disk which rotates and undergoes infall around the central star, and drives a molecular jet which arises from the inner disk regions. The accretion disk is truncated between 2000–3000 au, it has a mass of about a tenth of the central star mass, and is infalling towards the central star at a high rate ( M⊙ yr-1), as to build up a very massive object. These findings, obtained with the Atacama Large Millimeter/submillimeter Array at 700 au resolution, provide observational proof that young massive stars can form via disk accretion much like Solar-mass stars.
Key Words.:
Stars: formation – Stars: individual: G023.0100.411 Introduction
Models of massive star formation in the disk accretion scenario predict that circumstellar disks could reach radii between 1000 and 2000 au (e.g., Krumholz et al. 2007; Kuiper et al. 2011; Harries et al. 2017). Observationally, evidence for gas rotation near young stars with tens of Solar masses exists (e.g., Zapata et al. 2010; Qiu et al. 2012; Johnston et al. 2015; Ilee et al. 2016; Beuther et al. 2017; Cesaroni et al. 2017), although the amount of gas mass undergoing rotation is a significant fraction of the star mass, and these envelopes, possibly hosting an inner disk, might be prone to fragmentation due to self-gravity and/or develop spiral instabilities (e.g., Kratter et al. 2010; Kuiper et al. 2011; Klassen et al. 2016; Chen et al. 2016; Meyer et al. 2017, 2018). The interplay between disks and jets provides a mechanism to ensure mass accretion through the disk. Notwithstanding their connection, there is poor evidence of disk-jet systems in the inner few 1000 au of stars with tens of Solar masses (e.g., Beltrán & de Wit 2016), such as those resolved around Solar- and intermediate-mass stars (e.g., Lee et al. 2017a, b; Cesaroni et al. 2005, 2013, 2014). In order to establish the disk accretion scenario as a viable route for the formation of the most massive stars (e.g., Kuiper et al. 2010), we seek to simultaneously resolve the spatial morphology of the disk and the regions where the jet originates, and to determine whether or not the disk gas is in centrifugal equilibrium.
In the recent years, we have identified an “isolated” massive young star in the hot molecular core (HMC) of the star-forming region G023.0100.41, which is located about half way between the Sun and the Galactic center, at a parallax distance of 4.6 kpc (Brunthaler et al. 2009). The HMC emits a luminosity of 4 L⊙ (Sanna et al. 2014), and stands out among the strongest Galactic CH3OH maser sources (Menten 1991; Cyganowski et al. 2009; Sanna et al. 2010; Moscadelli et al. 2011; Sanna et al. 2015). The HMC luminosity corresponds to that of a zero-age-main-sequence (ZAMS) star with a mass of 20 M⊙ and an O9 spectral-type (Ekström et al. 2012). The HMC is located at the center of a collimated CO outflow whose emission extends up to the parsec scales (Araya et al. 2008; Furuya et al. 2008; Sanna et al. 2014); we tracked the driving source of the outflow down to the HMC center, where we imaged a collimated radio thermal jet associated with strong H2O maser shocks (Sanna et al. 2010, 2016). The different outflow tracers are aligned on the sky plane and constrain the direction of the outflow axis within an uncertainty of a few degrees (Sanna et al. 2016). An accurate knowledge of the outflow axis allows us to pinpoint the young stellar object (YSO) position, and thus to circumvent the usual problem of distinguishing between velocity gradients due to expanding or rotational motions.
| Array Conf. | R.A. (J2000) | Dec. (J2000) | VLSR | Freq. Cove. | BP Cal. | Phase Cal. | Flux Cal. | HPBW | |
|---|---|---|---|---|---|---|---|---|---|
| (h m s) | (∘ ′ ′′) | (km s-1) | (GHz) | (kHz) | (′′) | ||||
| (1) | (2) | (3) | (4) | (5) | (6) | (7) | (8) | (9) | (10) |
| C36–6 | 18:34:40.290 | –09:00:38.30 | 77.4 | 216.9, 236.5 | 488.3 | J17510939 | J18510035 | J17331304 | 0.20 |
Here, we exploit the information about the star-outflow geometry in G023.0100.41, and make use of Atacama Large Millimeter/submillimeter Array, ALMA, observations (Sect. 2), to directly resolve a disk-jet system in the vicinity of an O-type YSO. We firstly show that the line emission from dense gas reveals a molecular disk which extends up to radii of 2000–3000 au from the central star; the disk is warped in the outer regions (Sect. 3). Then, we make use of the position-velocity (pv-) diagrams of gas along the disk plane to show that gas is falling in close to free-fall, and slowly rotating with sub-Keplerian velocities; at radii near 500 au, gas rotation takes over, and could approach centrifugal equilibrium at smaller radii, although higher-resolution observations are needed to study the inner regions (Sect. 4). In the process, we image the molecular jet component which arises from the inner disk regions. We corroborate our conclusions by comparing the observed pv-diagrams with those obtained for a disk model around a 20 M⊙ (Appendix A).
2 Observations and calibration
We made use of our previous Submillimeter Array (SMA) observations at 1 mm (Sanna et al. 2014), which covered a range of angular resolutions between and , to set up the requirements for higher resolution observations with ALMA.
We observed the star-forming region G023.0100.41 with the 12 m-array of ALMA in band 6 (211–275 GHz). Observations were conducted under program 2015.1.00615.S during two runs, on 2016 September 5 and 16 (Cycle 3), with precipitable water vapor of 1.5 mm and 0.6 mm, respectively. The 12 m-array observed with 45 antennas covering a baseline range between 16 m and 3143 m, with the aim to achieve an angular resolution of , and to recover extended emission over a maximum scale of .
We made use of the dual-sideband receiver, in dual polarization mode, to record 12 narrow spectral windows, each 234 MHz wide, and an additional wide band of 1875 MHz. The narrow spectral windows were correlated with 960 channels and Hanning smoothed by a factor of 2, achieving a velocity resolution222The CH3CN (–) lines were sampled with 0.35 km s-1 spectral resolution. of 0.7 km s-1. Individual spectral windows were placed to cover a number of molecular lines of high-density tracers ( 106 cm-3) such as methanol (CH3OH) and methyl cyanide (CH3CN). These settings provide a line spectral sampling of 13 channels for an expected linewidth of 9 km s-1. The wide band was correlated with 3840 channels and centered at a rest frequency of 217.860 GHz. This band was used to construct a pure continuum image from the line-free channels.
We spent 1 hour of time on-source during a total observing time of 2 hours, which includes calibration overheads. Time constraints were set to achieve a thermal rms per (narrow) spectral channel of about 2 mJy beam-1 (with 36 antennas), which corresponds to a brightness temperature of 1.4 K over a beam of . Additional observation information is summarized in Table 1.
The visibility data were calibrated with the Common Astronomy Software Applications (CASA) package, version 4.7.1 (r39339), making use of the pipeline calibration scripts. We determined the continuum level in each spectral window separately. We made use of the pipeline spectral image cubes and selected the line-free channels from a spectrum integrated over a circular box of in size, which was centered on the target source. The task uvcontsub of CASA was used to subtract a constant continuum level across the spectral window (fitorder 0). We imaged the line and continuum emission with the task clean of CASA. In each individual map, the ratio between the image rms and the thermal noise, expected from the ALMA sensitivity calculator, is near unity. For the continuum map, we integrated over a line-free bandwidth of 218 MHz selected from the wide spectral window, and achieved a signal-to-noise ratio of about 100. Imaging information is summarized in Table 2.
| Tracer | Eup | Weight | HPBW | rms | Speak | |
|---|---|---|---|---|---|---|
| (GHz) | (K) | (′′) | mJy beam-1 | mJy beam-1 | ||
| Dust Continuum | 217.8240 | … | R0.5 | 0.207 | 0.16 | 14.63 |
| CH3OH (–) E | 218.4400 | 45.4 | R0.5 | 0.184 | 3.4 a | 220.1a |
| CH3OH (–) A+ | 232.4186 | 165.4 | R0 | 0.155 | 1.0 | 114.4 |
| CH3OH (–) A+ | 232.7835 | 446.5 | R0 | 0.155 | 1.0 | 107.3 |
| CH3CN (–) | 220.7090 | 133.1 | R0 | 0.155 | 1.4 | 110.4 |
| CH3CN (–) | 220.6793 | 183.1 | R0 | 0.155 | 1.4 | 98.1 |
3 Results
According to the “observer’s definition” of disk framed in Cesaroni et al. (2007), necessary conditions for a disk detection are (i) a flattened core of gas and dust perpendicular to the outflow direction, and (ii) a velocity gradient along its major axis. We therefore want to analyze the spatial morphology and kinematics of dense gas which lies at the center of the bipolar outflow, and, specifically, along a position angle of on the sky plane (measured east of north). This direction traces the projection of the equatorial plane, hereafter the “disk plane”, perpendicular to the molecular outflow and the radio jet orientation (or, simply, the outflow), which is inclined by less than with respect to the sky plane (Sanna et al. 2014, 2016).
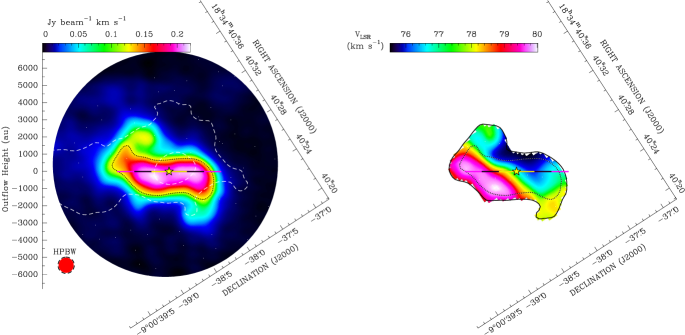
In order to gain an overall view of the mass distribution around the star, we first looked for a molecular tracer of cold and dense gas ( 106 cm-3). In the left panel of Fig. 1, we plot the velocity-integrated map of the CH3OH gas emission at a frequency of 218.440 GHz (in color); this CH3OH transition has an upper excitation-energy of only 45 K (Eup). To emphasize the bulk of the emission, we integrated over a small velocity range (2 km s-1) near the line peak.
For clarity, we have rotated this map in order to align the outflow axis, which lies at a position angle of on the sky plane (Sanna et al. 2016), with the vertical axis of the plot. The blueshifted (approaching) lobe of the outflow points now to the north. The horizontal axis is aligned with the disk plane, which is marked in the plot at multiples of 1000 au from the central star position. The position of the central star was set as to maximize the symmetry of the blue- and redshifted sides of the disk (see Figs. 3 and 5), and has coordinates of R.A. (J2000) 18h34m40283 and Dec. (J2000) –9∘00′38310 ( 30 mas per coordinate). This position also coincides with the peak position of the radio continuum emission observed with the Very Large Array at the same resolution as the ALMA beam (Sanna et al. 2016). The same geometry and symbols will be used in all maps for comparison.
Figure 1 shows that dense gas condenses in the direction perpendicular to the outflow axis. The CH3OH gas emission extends up to a deconvolved radius of 2380 840 au (or 520 mas) from the central star, and has a ratio between the minor-to-major axes of 0.2. These values are calculated by Gaussian fitting the CH3OH emission within the 60% contour level (dotted black contour in Fig. 1). We use this threshold to select the region where the CH3OH iso-contours have a nearly constant height. This piece of evidence satisfies the first condition, that of a highly flattened structure perpendicular to the outflow, and hereafter we refer to the 60% contour level as the “disk profile”. Below the 60% contour level, the CH3OH emission emerges at (relatively) large radii from the star (2000 au) and appears significantly warped with respect to the disk plane. In this paper, we focus on the analysis of the emission within the disk profile.
In the right panel of Fig. 1, we plot the intensity-averaged map of the velocity field of the CH3OH gas (i.e., the first-moment map). There is a clear gradient between the redshifted and blueshifted velocities moving from the left to the right side of the star along the disk plane. This second piece of evidence fulfills the more stringent requirement for confirming a disk candidate. On a closer look, the velocity field is actually skewed along the main outflow direction. This is not surprising, since, around Solar-mass stars, CH3OH emission has been shown to be excited both in the disk and jet regions (e.g., Leurini et al. 2016; Lee et al. 2017c; Bianchi et al. 2017). Indeed, contamination of the velocity gradient across the disk plane, by the blueshifted and redshifted gas velocities due to the outflow emission, to the north and south of the star respectively, can explain this apparent velocity gradient.
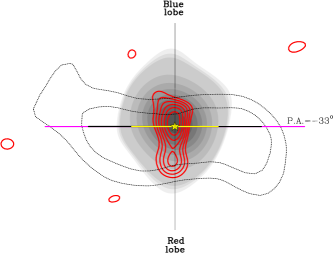
We stress that the physical structure imaged in Fig. 1 (left) does not coincide with the definition of “toroid”, which is a non-equilibrium structure with a mass comparable or greater than that of the central star(s) and a size of the order of 10,000 au (Cesaroni 2005; Beltrán et al. 2005). The rotating toroid surrounding the massive YSO in G023.0100.41 was previously imaged and discussed in Furuya et al. (2008) and Sanna et al. (2014). In Fig. 2, we directly compare the relative orientation of the disk profile with that of the radio thermal jet emission detected at 22 and 45 GHz by Sanna et al. (2016), showing that they are clearly perpendicular.
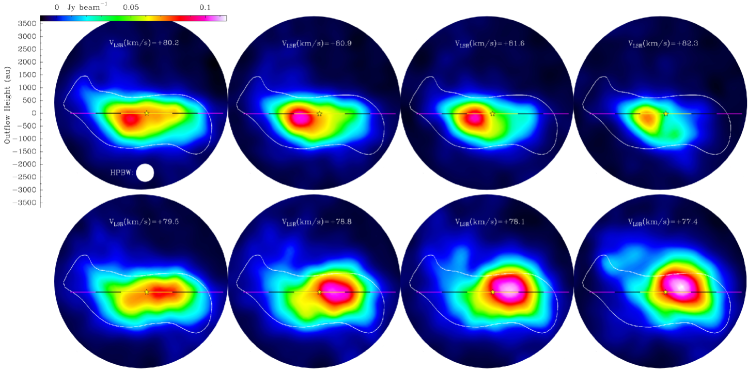
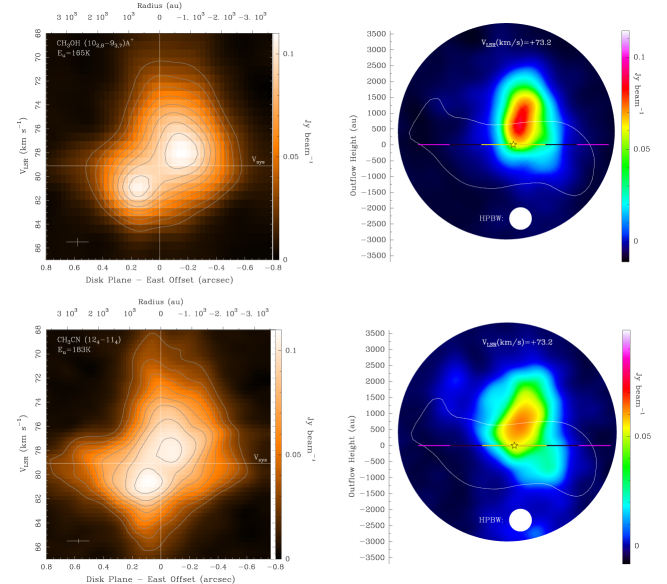
To better investigate the gas kinematics inside the disk profile, in Fig. 3 we plot a number of maps of the CH3OH (–) A+ line emission at different velocities. This transition has an excitation-energy (Eup 165 K) about four times higher than that of the line in Fig. 1. The upper row shows the spatial morphology of the CH3OH gas emission at increasing (redshifted) LSR velocities, from left to right, and underlines the eastern disk side. On the contrary, the lower row shows the CH3OH gas distribution at decreasing (blueshifted) LSR velocities, which arise from the western side of the disk. Each row spans a velocity range of 2.8 km s-1, which is the rotation speed expected around a 20 M⊙ star at an outer radius of 2300 au (assuming centrifugal equilibrium).
Figure 3 resolves the spatial distribution of gas around the star at the different velocities, providing direct proof that the CH3OH gas is rotating clockwise around the outflow axis (as seen from the north), with the approaching and receding sides of the disk to the west and east of the central star, respectively. The pair of maps on the same column to the left shows the transition between the eastern (upper) and western (lower) sides of the disk emission, and can be used to infer the rest velocity of the star (see below). Between velocities of 80 and 79 km s-1, the CH3OH gas emission is maximally stretched along the disk plane on either sides of the star; at higher (lower) velocities, the emission progressively brightens southeastward (northwestward) of the disk plane, in agreement with the redshifted (blueshifted) outflow lobe. A posteriori, this behavior confirms that the observed molecular species can trace both the disk kinematics and the (inner) outflowing gas (see also Fig. 5, right).
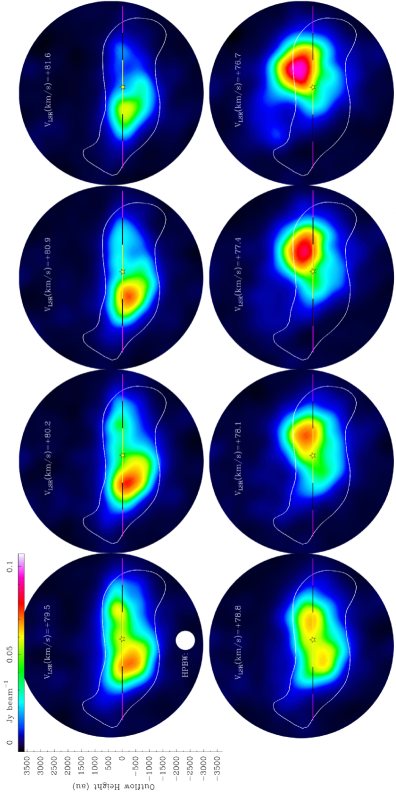
In the Fig. 4, we provide the same analysis for the CH3OH (–) A+ line emission, which has an excitation-energy of 446 K (Eup), and is more affected by the outflow emission. For this line, the transition between the red- and blueshifted sides of the disk occurs at lower velocity than in Fig. 3. The rest velocity of the star, V⋆, was estimated from the median value between Fig. 3 and Fig. 4, and is set to km s-1 with an uncertainty of 0.4 km s-1. We explicitly note that, since the disk plane is not seen exactly edge-on, the blueshifted outflow emission close to the star, which lies between the observer and the disk, shifts the velocity field towards the lower velocities, when weighting the velocity channels by the line intensity. In the first-moment map of Fig. 1, the net result is that the redshifted velocities are down-weighted, and the central velocity is shifted by about km s-1 with respect to the rest velocity of the star.
4 Discussion
In the following, we want to study the dependence of the gas velocity on the distance to the star, and to quantify the disk mass. Together with the observations, we discuss the results of a radiation transfer model for a circumstellar disk around a 20 M⊙ star (Appendix A). We have simulated the disk appearance for our specific observational conditions, and produced synthetic maps of the line and dust emission around the young star, in order to compare the observed pv-diagrams with those expected under two simple assumptions: the disk is falling in towards the central star due to gravitational attraction; the disk is rotating around the central star in centrifugal equilibrium.
4.1 Position-velocity diagrams
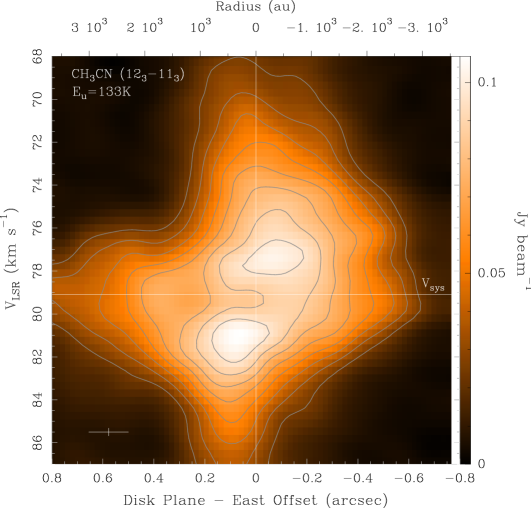
In Fig. 5, we study the velocity profile of gas along the disk plane through the pv-diagrams of two molecular species having a common methyl group, CH3OH and CH3CN. On the same column to the left, we compare the pv-diagrams of the CH3OH (–) A+ and CH3CN (–) line transitions, which have similar excitation-energies of 165 K and 183 K, respectively. The two plots span the same ranges in space and velocity, and the lower intensity contour is drawn as to include an outer radius of 2400 au. Both pv-diagrams are double peaked, and the peaks are symmetrically displaced with respect to the star position and velocity. However, the CH3CN line emission shows a steeper velocity gradient at small offsets from the star, which indicates that this transition traces a region closer to the disk center than the CH3OH transition. This piece of evidence also explains the lower redshifted tail of the CH3CN pv-diagram, which traces the higher rotation speeds approaching the central star, as it can be expected for Keplerian-like rotation (). This component is missing in the roundish contours of the CH3OH emission. In Fig. 6, we plot the pv-diagram of the CH3CN (–) line, which has an upper excitation-energy of 133 K, and shows a similar profile to that of the K 4 line. Their agreement, when compared to the pv-diagram of the CH3OH line, strengthens the idea that the CH3CN gas allows us to peer into the innermost disk regions, and this holds for a broad range of line excitation-energies.
On the other hand, both the CH3CN and CH3OH lines show increasing blueshifted velocities moving close to the star. In the right column of Fig. 5, we show a channel map at the blueshifted velocity of +73.2 km s-1 for both transitions. These maps clearly show a compact (molecular) outflow component, namely the jet, to the north of the star, corresponding to the direction of the blueshifted outflow lobe. Since the blueshifted outflow emission lies in between the observer and the disk, we cannot neglect its influence on the pv-diagrams (see below). Theory predicts that jets are launched and collimated in the inner few 100 au from the central star (e.g., Frank et al. 2014; Kuiper et al. 2015, 2016). The jet width of 1510 73 au (or 329 mas), determined from the deconvoled (Gaussian) size of the CH3OH emission, allows us to set an upper limit of 800 au to the radius where the jet originates. Notably, we do not detect the redshifted lobe of the jet, which lies in the background with respect to the disk, and interpret this result as evidence for the inner disk regions being (partially) optically thick at 1 mm (e.g., Sanna et al. 2014; Forgan et al. 2016).
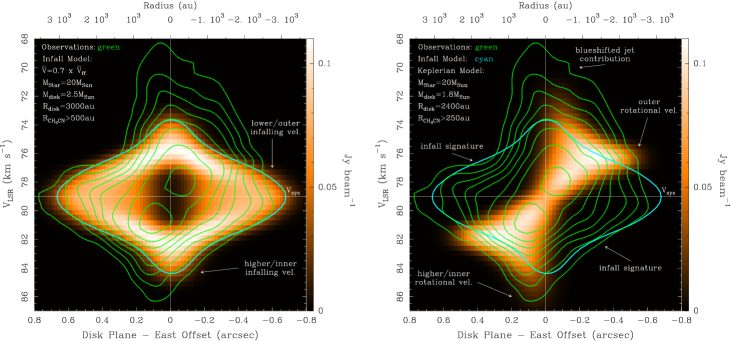
In Fig. 7, we compare the observed pv-diagram of the CH3CN (–) line, which is sensitive to the inner disk velocities, with the modeled pv-diagrams for two different velocities fields. On the left panel, we consider an infalling disk around a 20 M⊙ star (colors), where the gas is moving radially at of the corresponding free-fall velocity (). The disk extends from the dust sublimation radius, where the disk temperature approaches 1500 K, up to a radius of 3000 au from the central star. We find that, this fraction of the free-fall velocity, combined with an inner cutoff near 500 au, best match the velocity range covered by the observed pv-diagram (green contours). Note that, since the infalling motion starts with non-zero velocities at the outer radius, this produces the inner hole near zero offsets in the modeled pv-diagram. The infalling profile well reproduces the observed pv-diagram in the second and fourth quadrants, which are the quadrants forbidden under the assumption of purely rotational motion (right panel).
In the right panel of Fig. 7, we show the comparison of the observed pv-diagram (green contours) with that expected for a disk in Keplerian rotation around a 20 M⊙ star (colors). We also draw the outer contour of the infalling disk model (cyan contour), in order to highlight the regions excluded by simple rotation. At variance with the infalling profile, we find that a Keplerian-like profile better reproduces the higher velocities in the first and third quadrants, when we assume an inner cutoff near 250 au and outer disk radius of 2400 au, similar to the deconvolved size of our disk profile (Fig. 1).
This analysis shows that the velocity field of gas through the disk is a combination of infalling and rotational motions, within a radius of 3000 au from the central star. On the one hand, the detection of a radial flow towards the central star implies that the condition of centrifugal equilibrium does not hold outside a radius of 500 au, where the velocity field has to be a combination of sub-Keplerian rotation and infalling motion. This scenario resembles that of the sub-Keplerian infalling disks modeled by Seifried et al. (2011) under the presence of strong magnetic fields. Our model predicts a mass infall rate at a radius of 500 au of M⊙ yr-1. On the other hand, our data suggest that the inward gas flow slows down in the inner disk regions ( 500 au), where the pv-diagram could resemble that of a centrifugally supported disk (see the right panel of Fig. 7). However, at the moment this possibility is quite speculative, as the inner regions are sampled by only two beams with the current resolution. We explicitly note that, although we fixed the star mass in our model, the simple agreement between observed and modeled pv-diagrams provides indirect confirmation of the central mass determined from the bolometric luminosity.
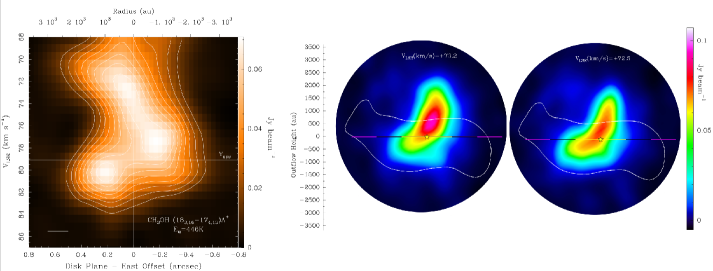
Moreover, in the right panel of Fig. 7 it is evident that there is an excess of blueshifted emission near zero offsets. This emission coincides with the molecular jet detected in our channel maps (right column of Fig. 5). If the molecular species does not trace the disk gas exclusively, and the disk plane is not seen edge-on, we show that the blueshifted outflow emission close to the star leaves a strong imprint in the pv-diagrams. In the Fig. 8, we provide the same pv-analysis for the CH3OH (–) A+ line emission. Interestingly, at the higher excitation-energy of this line, the blueshifted jet emission strongly affects the eastern side of the pv-diagram. In the channel maps (right panels), the spatial distribution of the jet emission bends to the redshifted side of the disk indeed, and progressively aligns to the outflow axis moving away from the disk plane. These maps definitely underline that the jet emission arises in the inner disk regions ( au), providing a mechanism to transfer angular momentum away from the disk, and ensuring an inward flow of mass towards the central star.
Under steady state accretion, the mass infall rate of our model would imply that the final star mass could be as large as three times the current value, assuming the accretion phase lasts for about 105 yr. Nevertheless, it has been recently shown that the accretion process of young massive stars undergoes episodic accretion bursts, with the accretion rate suddenly rising by a few orders of magnitude (Caratti o Garatti et al. 2017; Hunter et al. 2017). Therefore, the net mass accretion onto the central star might exceed that inferred from the model.
4.2 Disk mass
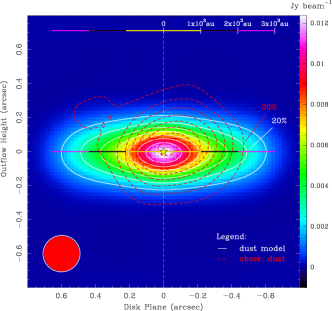
In Fig. 9, we overlap a map of the observed dust continuum emission at 1.37 mm (dashed red contours) with that of the modeled dust emission from the disk at the same wavelength (white contours). We draw the contours of the observed continuum emission down to a 20% level of the peak of 14.6 mJy beam-1. Below this level, corresponding to a radius of about 2000 au from the star, the dust continuum emission suffers contamination from the outer envelope, which is outlined by the lower, dashed, white contour in Fig. 1 (corresponding to about the 10% peak level). Our model predicts a dust continuum peak of 12.4 mJy beam-1, in excellent agreement with the observed intensity.
We compare the disk mass estimated from the dust continuum emission with that predicted by the model. Following Hildebrand (1983), we estimate the disk mass from the continuum flux of 62.9 mJy within the 20% contour. We use an average gas temperature of 279 K, determined from the model between radii of 10 au and 2000 au, and assume a standard gas-to-dust mass ratio of 100 and a dust opacity of 1.0 cm2 g-1 at 1.3 mm (Ossenkopf & Henning 1994, same for the model). From these parameters, we calculate a disk mass of 1.6 M⊙ and assign an uncertainty of 0.3 M⊙, corresponding to an uncertainty of 20% of the measured flux. Our model predicts a disk mass of 2.5 M⊙ within a radius of 3000 au, which decreases to 1.4 M⊙ at 2000 au. Although the model does not account for a dusty envelope surrounding the disk, which might contribute to the observed dust flux, these values are in excellent agreement with the measured disk mass. We conclude that very likely the disk mass is much less ( 10%) than the mass of the star.
4.3 Comparison with Johnston et al. (2015)
Previous ALMA observations by Johnston et al. (2015) reported about a circumstellar disk around a young star in AFGL 4176, which has a mass comparable to G023.0100.41. These two sources have similar distances from the Sun and were observed with comparable resolution as well, allowing for a direct comparison. They might represent two snapshots for the formation of an O-type star, with G023.0100.41 been younger, and having the potential to become three-times more massive than AFGL 4176, eventually. In the following, we highlight common features and differences:
-
•
Both disks extend up to radii of 2000 au from the central star, and have similar average temperatures of 200 K, as determined by LTE analysis of the CH3CN K-ladders.
-
•
There is a large difference () in the estimate of the disk mass for these two objects, of 1.6 M⊙ and 8 M⊙ for G023.0100.41 and AFGL 4176, respectively. However, this difference is due to the different dust opacities at 1 mm assumed in the calculations, of 1.0 cm2 g-1 and 0.24 cm2 g-1 respectively, whereas the integrated fluxes at the same wavelength are similar (50–60 mJy). We argue that the lower dust opacity used by Johnston et al. is more appropriate for diffuse clouds (Draine 2003). If consistent dust opacities are used, the two disks also have similar masses of 2 M⊙, which amount to 10% of the central star mass.
-
•
The main difference between the two disks is related to the disk kinematics. On the one hand, Johnston et al. found Keplerian-like rotation up to the outer disk radii, meaning that nearly centrifugal equilibrium slows down any inward flow of mass through the disk. On the other hand, we find that the disk surrounding G023.0100.41 is infalling and sub-Keplerian, and only at radii of a few 100 au might approach centrifugal equilibrium. According to Kuiper et al. (2011, their Fig. 4), larger Keplerian disks are expected at later times, whereas Keplerian rotation around the youngest stars is confined to the inner disk regions. This evidence suggests that G023.0100.41 is still in an active phase of accretion and much younger than AFGL 4176.
5 Conclusions
We report about Atacama Large Millimeter/submillimeter Array (ALMA) observations, at wavelengths near 1 mm, of dense molecular gas and dust in the vicinity of an O-type young star, with a linear resolution as good as 700 au and a line sensitivity of 1 K. We targeted the luminous hot-molecualar-core G023.0100.41 after selecting a best candidate disk-jet system from our previous observations.
We have resolved a (molecular) disk-jet system around a young star which currently attains a mass of 20 M⊙. We present a kinematic analysis of the position-velocity diagrams of dense gas along the disk midplane, and compare them with the position-velocity diagrams simulated with a radiation transfer model. We show that the disk is falling in close to free-fall and slowly rotating with sub-Keplerian velocities, from radii of about 2000 au and down to 500 au from the central star, where we measure a mass infall rate of M⊙ yr-1. The disk mass is a small fraction of the star mass ( 10%). Furthermore, we are able to image the jet emission which arises from the inner disk radii ( 800 au), and show that its blueshifted emission leaves a strong imprint in the position-velocity diagrams.
Acknowledgements.
This study makes use of the following ALMA data: ADS/JAO.ALMA2015.1.00615.S. ALMA is a partnership of ESO (representing its member states), NSF (USA) and NINS (Japan), together with NRC (Canada), NSC and ASIAA (Taiwan), and KASI (Republic of Korea), in cooperation with the Republic of Chile. The Joint ALMA Observatory is operated by ESO, AUI/NRAO and NAOJ. A.S. gratefully acknowledge financial support by the Deutsche Forschungsgemeinschaft (DFG) Priority Program 1573. RK and AK acknowledge funding from the Emmy Noether research group on “Accretion Flows and Feedback in Realistic Models of Massive Star Formation” funded by the German Research Foundation under grant no. KU 2849/3-1.References
- Araya et al. (2008) Araya, E. D., Hofner, P., Goss, W. M., et al. 2008, ApJS, 178, 330
- Beltrán et al. (2005) Beltrán, M. T., Cesaroni, R., Neri, R., et al. 2005, A&A, 435, 901
- Beltrán & de Wit (2016) Beltrán, M. T. & de Wit, W. J. 2016, A&A Rev., 24, 6
- Beuther et al. (2017) Beuther, H., Walsh, A. J., Johnston, K. G., et al. 2017, ArXiv e-prints [arXiv:1703.07235]
- Bianchi et al. (2017) Bianchi, E., Codella, C., Ceccarelli, C., et al. 2017, A&A, 606, L7
- Brunthaler et al. (2009) Brunthaler, A., Reid, M. J., Menten, K. M., et al. 2009, ApJ, 693, 424
- Caratti o Garatti et al. (2017) Caratti o Garatti, A., Stecklum, B., Garcia Lopez, R., et al. 2017, Nature Physics, 13, 276
- Cesaroni (2005) Cesaroni, R. 2005, Ap&SS, 295, 5
- Cesaroni et al. (2007) Cesaroni, R., Galli, D., Lodato, G., Walmsley, C. M., & Zhang, Q. 2007, Protostars and Planets V, 197
- Cesaroni et al. (2014) Cesaroni, R., Galli, D., Neri, R., & Walmsley, C. M. 2014, A&A, 566, A73
- Cesaroni et al. (2013) Cesaroni, R., Massi, F., Arcidiacono, C., et al. 2013, A&A, 549, A146
- Cesaroni et al. (2005) Cesaroni, R., Neri, R., Olmi, L., et al. 2005, A&A, 434, 1039
- Cesaroni et al. (2017) Cesaroni, R., Sánchez-Monge, Á., Beltrán, M. T., et al. 2017, A&A, 602, A59
- Chen et al. (2016) Chen, H.-R. V., Keto, E., Zhang, Q., et al. 2016, ApJ, 823, 125
- Cyganowski et al. (2009) Cyganowski, C. J., Brogan, C. L., Hunter, T. R., & Churchwell, E. 2009, ApJ, 702, 1615
- Draine (2003) Draine, B. T. 2003, ARA&A, 41, 241
- Dullemond et al. (2012) Dullemond, C. P., Juhasz, A., Pohl, A., et al. 2012, RADMC-3D: A multi-purpose radiative transfer tool, Astrophysics Source Code Library
- Ekström et al. (2012) Ekström, S., Georgy, C., Eggenberger, P., et al. 2012, A&A, 537, A146
- Forgan et al. (2016) Forgan, D. H., Ilee, J. D., Cyganowski, C. J., Brogan, C. L., & Hunter, T. R. 2016, MNRAS, 463, 957
- Frank et al. (2014) Frank, A., Ray, T. P., Cabrit, S., et al. 2014, Protostars and Planets VI, 451
- Furuya et al. (2008) Furuya, R. S., Cesaroni, R., Takahashi, S., et al. 2008, ApJ, 673, 363
- Gerner et al. (2014) Gerner, T., Beuther, H., Semenov, D., et al. 2014, A&A, 563, A97
- Harries et al. (2017) Harries, T. J., Douglas, T. A., & Ali, A. 2017, MNRAS, 471, 4111
- Hernández-Hernández et al. (2014) Hernández-Hernández, V., Zapata, L., Kurtz, S., & Garay, G. 2014, ApJ, 786, 38
- Hildebrand (1983) Hildebrand, R. H. 1983, QJRAS, 24, 267
- Hunter et al. (2017) Hunter, T. R., Brogan, C. L., MacLeod, G., et al. 2017, ApJ, 837, L29
- Ilee et al. (2016) Ilee, J. D., Cyganowski, C. J., Nazari, P., et al. 2016, MNRAS, 462, 4386
- Johnston et al. (2015) Johnston, K. G., Robitaille, T. P., Beuther, H., et al. 2015, ApJ, 813, L19
- Klassen et al. (2016) Klassen, M., Pudritz, R. E., Kuiper, R., Peters, T., & Banerjee, R. 2016, ApJ, 823, 28
- Kratter et al. (2010) Kratter, K. M., Matzner, C. D., Krumholz, M. R., & Klein, R. I. 2010, ApJ, 708, 1585
- Krumholz et al. (2007) Krumholz, M. R., Klein, R. I., & McKee, C. F. 2007, ApJ, 665, 478
- Kuiper et al. (2010) Kuiper, R., Klahr, H., Beuther, H., & Henning, T. 2010, ApJ, 722, 1556
- Kuiper et al. (2011) Kuiper, R., Klahr, H., Beuther, H., & Henning, T. 2011, ApJ, 732, 20
- Kuiper et al. (2016) Kuiper, R., Turner, N. J., & Yorke, H. W. 2016, ApJ, 832, 40
- Kuiper & Yorke (2013) Kuiper, R. & Yorke, H. W. 2013, ApJ, 763, 104
- Kuiper et al. (2015) Kuiper, R., Yorke, H. W., & Turner, N. J. 2015, ApJ, 800, 86
- Lee et al. (2017a) Lee, C.-F., Ho, P. T. P., Li, Z.-Y., et al. 2017a, Nature Astronomy, 1, 0152
- Lee et al. (2017b) Lee, C.-F., Li, Z.-Y., Ho, P. T. P., et al. 2017b, Science Advances, 3, e1602935
- Lee et al. (2017c) Lee, C.-F., Li, Z.-Y., Ho, P. T. P., et al. 2017c, ApJ, 843, 27
- Leurini et al. (2016) Leurini, S., Codella, C., Cabrit, S., et al. 2016, A&A, 595, L4
- Menten (1991) Menten, K. M. 1991, ApJ, 380, L75
- Meyer et al. (2018) Meyer, D. M.-A., Kuiper, R., Kley, W., Johnston, K. G., & Vorobyov, E. 2018, MNRAS, 473, 3615
- Meyer et al. (2017) Meyer, D. M.-A., Vorobyov, E. I., Kuiper, R., & Kley, W. 2017, MNRAS, 464, L90
- Moscadelli et al. (2011) Moscadelli, L., Sanna, A., & Goddi, C. 2011, A&A, 536, A38
- Ossenkopf & Henning (1994) Ossenkopf, V. & Henning, T. 1994, A&A, 291, 943
- Qiu et al. (2012) Qiu, K., Zhang, Q., Beuther, H., & Fallscheer, C. 2012, ApJ, 756, 170
- Sanna et al. (2014) Sanna, A., Cesaroni, R., Moscadelli, L., et al. 2014, A&A, 565, A34
- Sanna et al. (2016) Sanna, A., Moscadelli, L., Cesaroni, R., et al. 2016, A&A, 596, L2
- Sanna et al. (2010) Sanna, A., Moscadelli, L., Cesaroni, R., et al. 2010, A&A, 517, A78
- Sanna et al. (2015) Sanna, A., Surcis, G., Moscadelli, L., et al. 2015, A&A, 583, L3
- Seifried et al. (2011) Seifried, D., Banerjee, R., Klessen, R. S., Duffin, D., & Pudritz, R. E. 2011, MNRAS, 417, 1054
- Viti et al. (2004) Viti, S., Collings, M. P., Dever, J. W., McCoustra, M. R. S., & Williams, D. A. 2004, MNRAS, 354, 1141
- Zapata et al. (2010) Zapata, L. A., Tang, Y.-W., & Leurini, S. 2010, ApJ, 725, 1091
Appendix A Disk model
We built up a semi-analytic model for a circumstellar disk surrounding a young star of 20 M⊙, in order to derive the velocity profile of molecular gas flowing through the disk, and compare the expected pv-diagrams with those obtained with the ALMA observations. Since the outflow axis is inclined by less than with respect to the sky plane, in our model we account for an inclination of between the disk plane and the line-of-sight, as a compromise. We explicitly note that the model does not change significantly within this range of inclinations.
Our semi-analytic models are discretized in order to be usable for the radiative transfer code RADMC-3D (Dullemond et al. 2012). For this purpose, we use a regular two-dimensional, equatorial- and axial-symmetric spherical grid, with 152 cells in the radial direction and 20 cells the in polar direction. The radial coordinates are logarithmically scaled such that the center regions are well resolved. The grid ranges from the stellar radius to a radius of 0.05 pc; the total image size is 0.1 pc. Here, we consider the radiation from the protostellar source as well as the emission from dust continuum and lines for a given molecule. We further assume local thermodynamic equilibrium and prescribe a temperature distribution which is the same for the dust and gas components. We configured RADMC-3D to use ray-tracing, ignoring dust scattering. The spectrum has a total width of 28 km s-1, divided into 80 channels centered around the corresponding line. From these images, we produce FITS-files (Flexible Image Transport System) that are then readable by numerous astronomical software, including CASA.
We consider a constant disk aspect-ratio () of 0.1, and fix the disk density (), temperature (T), and molecular abundance () at a reference radius, R0. The dependence of , T, and on the disk radius is assumed to be a simple power-law of exponents a, t, and q, respectively. The disk density and temperature are assumed to be, respectively, g cm-3 and 300 K at a radius R au, following Kuiper & Yorke (2013). Their respective exponents, a and t, are and , following Gerner et al. (2014). Note that, the choice of temperature is consistent with the (average) rotational temperature (195 K) of the CH3CN (–) spectra, determined within a radius of 3000 au from the HMC center by LTE analysis (Sanna et al. 2014). The dust properties are assumed constant across the disk, with a gas-to-dust mass ratio of 100 and a dust opacity of 1.0 cm2 g-1 at 1.3 mm (Ossenkopf & Henning 1994). We set a CH3CN abundance relative to H2 of at 500 au, and assume a slow decrease with the radius similar to the temperature slope (e.g., Sanna et al. 2014; Hernández-Hernández et al. 2014; Viti et al. 2004).
The output files from the model were processed in CASA with the tasks “simobserve” and “simanalyze”, in order to produce synthetic maps with the same ALMA configuration (alma.cycle3.6.cfg) and observational conditions of the actual maps. In Figs. 7 and 9, we present the results of this procedure for the CH3CN (–) line transition, at a frequency of 220.67929 GHz, and for the dust emission at the same frequency as the ALMA dust continuum map.
We note that the inner hole in the model of Fig. 7 (left) is due to the fact that we did not want to make any assumption about the velocity profile in the outer regions of the disk. Most likely, in these outer regions the gas velocity will approach the systemic velocity, filling the apparent hole in the model.
The main goal of our disk model is to show the range of velocities covered by different (ideal) velocity fields in the pv-diagrams, for which we assumed simple monotonic functions of , T, and , and constant dust properties as well. A posteriori, we can comment on the accuracy of these assumptions based on the brightness distribution of the pv-diagrams. On the one hand, the modeled peak brightness of both the CH3CN line and the dust continuum coincides with the observed values. This agreement supports the choices for and T. On the other hand, in the modeled pv-diagrams of Fig. 7, the CH3CN emission brightens the most at high velocities, which generally correspond to the inner disk regions. This is at variance with the observed pv-diagram, where the peak brightness is confined to the low velocities. This difference might be interpreted as the combination of two effects: the dust properties change inside the disk, providing different line opacities at different distances from the star; inside the disk, the spatial distribution of the CH3CN abundance does not follow a simple power-law of the disk radius.