The Interstellar Medium Properties of Heavily Reddened Quasars & Companions at with ALMA & JVLA
Abstract
We study the interstellar medium (ISM) properties of three heavily reddened quasars at as well as three millimetre-bright companion galaxies near these quasars. New JVLA and ALMA observations constrain the CO(1-0), CO(7-6) and [CI]3PP1 line emission as well as the far infrared to radio continuum. The gas excitation and physical properties of the ISM are constrained by comparing our observations to photo-dissociation region (PDR) models. The ISM in our high-redshift quasars is composed of very high-density, high-temperature gas which is already highly enriched in elements like carbon. One of our quasar hosts is shown to be a close-separation (2) major merger with different line emission properties in the millimeter-bright galaxy and quasar components. Low angular resolution observations of high-redshift quasars used to assess quasar excitation properties should therefore be interpreted with caution as they could potentially be averaging over multiple components with different ISM conditions. Our quasars and their companion galaxies show a range of CO excitation properties spanning the full extent from starburst-like to quasar-like spectral line energy distributions. We compare gas masses based on CO, CI and dust emission, and find that these can disagree when standard assumptions are made regarding the values of , the gas-to-dust ratio and the atomic carbon abundances. We conclude that the ISM properties of our quasars and their companion galaxies are diverse and likely vary spatially across the full extent of these complex, merging systems.
keywords:
galaxies:evolution – galaxies:high-redshift – galaxies:starburst – galaxies:ISM – (galaxies):quasars:individual1 Introduction
In our conventional picture of massive galaxy formation, the most luminous starburst galaxies and quasars are assembled via gas-rich major mergers that trigger both star-formation and accretion onto the central supermassive black hole (e.g. Hopkins:08), thus naturally explaining the correlation between black hole mass and stellar bulge mass in present-day galaxies (Magorrian:98; Kormendy:13). Many studies in the literature dating back to Sanders:88 have postulated that dusty star-forming galaxies (DSFGs)/submillimetre galaxies (SMGs), and quasars represent different evolutionary phases in the merger-driven life-cycle of massive galaxies, with the same gas supply fuelling the starburst and then eventually making its way to the central regions in galaxies to fuel black-hole accretion. Observations of molecular gas in SMGs and quasars also initially revealed apparent differences between the two populations. While SMGs were found to have both nuclear, warm gas components as well as more extended, diffuse colder gas components, suggestive of a multi-phase molecular interstellar medium (ISM) (Riechers:11a; Carilli:11), quasar host galaxies were generally found to be consistent with a single phase ISM (Riechers:11b) with the few resolved observations available suggesting that the gas is distributed on relatively compact scales of a few kiloparsecs (kpc; Carilli:02; Walter:04; Riechers:11b; Willott:13). In a simple picture of galaxy formation, these observations could be explained by quasars representing a later evolutionary stage when the cold gas reservoirs in the galaxy have been substantially depleted and the molecular gas in the quasar host galaxy is therefore located in a compact region close to the central accreting black-hole. Recently, however, such differences in excitation properties between SMGs/DSFGs and quasar host galaxies have been called into question (Sharon:16), not least because the classification of sources into separate categories largely stems from historical definitions and many high-redshift galaxies are undoubtedly hybrids of both populations. In this paper we focus on a population of hybrid DSFG/quasar systems in order to shed more light on any putative evolutionary link between the two populations.
Using wide-field near infra-red surveys, we have discovered a large population of heavily reddened, hyper-luminous (L erg/s) quasars that share many of the characteristics of both DSFGs/SMGs and optically luminous quasars (Banerji:12; Banerji:13; Banerji:15). All our reddened quasars have dust extinctions of A2-6 mags, similar to what is observed in SMGs (Takata:06), as well as broad emission lines in their rest-frame optical spectra implying the presence of 109-1010M⊙ black-holes, comparable to those in optically selected quasars. In Banerji:17 (B17 hereafter), we presented Atacama Large Millimetre Array (ALMA) observations of the CO(3-2) molecular line for four of our reddened quasars at redshifts, . Two further quasars from our sample already had CO detections in the literature (Feruglio:14; Brusa:15). All six quasars were found to have significant reservoirs of molecular gas providing direct observational evidence that reddened quasars reside in gas-rich, highly star-forming host galaxies. Our ALMA observations also revealed the presence of other millimetre-bright, CO-emitting galaxies near one of the quasars, suggesting that reddened quasars are associated with over-dense regions in the high-redshift Universe.
In this paper, we present new observations of several more molecular lines in three of the quasars from B17, as well as their associated companions, to directly constrain the excitation conditions and properties of the ISM in these systems. A companion paper (Banerji et al. 2018b; Paper II hereafter) presents high-resolution observations of the CO(3-2) line in two of the quasars, to better constrain the gas dynamics and gas morphologies. The CO(3-2) line (=345.7960 GHz) studied in B17 has a critical density of n104cm-3, and is therefore tracing warm, moderately high density gas. By observing both lower and higher-J rotational transitions of CO such as CO(1-0) (=115.2712 GHz; n103cm-3) and CO(7-6) (=806.6518 GHz; n105cm-3), we are able to probe the properties of the quiescent, cold, gas as well as the very high-density gas associated with the sites of the most active star formation. The [CI] 3P2-3P1 (CI(2-1) hereafter) line (=809.3420 GHz) lies very close in frequency to CO(7-6) and can therefore be observed with the same ALMA bandpass setup as used for the CO(7-6) observations. With a much lower critical density (103cm-3), compared to most of the CO rotational transitions, CI has been argued to be a better tracer of the total molecular gas mass compared to CO (Papadopoulos:04), especially in the low-metallicity, high cosmic ray ionization rate environments, thought to be present in high-redshift starburst galaxies, where the CO molecule is more easily destroyed. The new observations presented in this paper also provide constraints on the [CI] line luminosities and atomic carbon abundances in our reddened quasars.
The paper is structured as follows. In Section 2 we present the ALMA and JVLA data that forms the basis for our analysis. Section 3 summarises the resulting constraints on the far infrared to radio continuum emission and CO and [CI] line properties in the sample. In Section 4 we infer dust and gas masses and constrain the ISM properties of our quasars. Section 5 presents our final conclusions. Throughout the paper we assume a flat, CDM cosmology with H0=70 km s-1 Mpc-1, =0.3 and =0.7.
2 DATA
2.1 Heavily Reddened Quasars and Companions
The sample studied consists of three heavily reddened quasars from Banerji:12; Banerji:15 - ULASJ01231525 (), ULASJ12340907 () and ULASJ23150143 () - where CO(3-2) emission has already been detected (B17). These quasars are among the reddest sources that have been discovered in our near infra-red search for a population of heavily reddened, intrinsically luminous quasars that are not present in wide-field optical surveys such as the Sloan Digital Sky Survey (SDSS). The three quasars studied here have colours of 2 (Vega), which corresponds to typical dust extinctions towards the quasar continuum of E(B-V)1 (A mag for RV=3.1). In B17, we also detected CO(3-2) emission associated with two neighbouring galaxies near ULASJ12340907 - G1234N (21 from quasar; ) and G1234S (11.5 from quasar ), which are also studied further in this paper. Although both galaxies are also covered by the UKIDSS-LAS survey, from which the quasar was initially selected, they are too faint at near infra-red wavelengths to be detected in UKIDSS. Both galaxies are likely to be highly obscured and our ALMA observations in B17 therefore correspond to the first detections of these new galaxies. We begin by describing the different observations conducted for each of these sources.
2.2 Karl G. Jansky Very Large Array (JVLA) Ka-band Observations
We observed all three quasars with the JVLA in the Ka-band, with the aim of detecting any cold gas reservoirs as traced by the CO(1-0) transition at =115.27120 GHz. The JVLA primary beam also encompasses the two companion galaxies to ULASJ12340907 at these frequencies, so constraints on their CO(1-0) line properties were also obtained. Observations were conducted in 2017 February - March using the compact D configuration. The correlator was configured to 64 bands, each with a bandwidth of 128 MHz. The channel width is 2 MHz. Data were calibrated in the first instance using the VLA Common Astronomy Software Applications package casa v4.7.1. We found that some additional flagging of visibilities was required in the case of both ULASJ1234 and ULASJ2315 before imaging. Spectral line cubes as well as continuum images were produced using the clean algorithm, employing a natural weighting for the visibilities. In the case of the spectral line data, the continuum was subtracted in the u-v plane using two spectral windows either side of the line as well as the line-free channels in the spectral window containing the line. The reduction pipeline applies Hanning-smoothing to the data by default. More details of these observations can be found in Table 1.
The brighter of the two companion galaxies to ULASJ1234 - G1234N, was detected in CO(1-0) emission with the JVLA although the fainter galaxy, G1234S was not. Line images were constructed from the primary-beam corrected clean images centred on the quasar. No continuum emission has been detected from either companion galaxy over the entire bandwidth of the JVLA Ka-band and we therefore did not perform continuum subtraction.
| ULASJ01231525 | ULASJ12340907 | ULASJ23150143 | |
|---|---|---|---|
| Dates Observed | 2017-03-13 | 2017-02-11,2017-02-12,2017-02-17 | 2017-03-03, 2017-03-04 |
| Number of Antennae | 27 | 27 | 27 |
| Exposure Time | 5h | 15h | 10h |
| Beam Size (line) / | 2.812.32 | 2.462.36 | 2.982.07 |
| Beam size (continuum) / | 2.772.35 | 2.512.38 | 2.662.11 |
| Channel R.M.S in 2MHz channels / mJy beam-1 | 0.10 | 0.06 | 0.10 |
| Continuum R.M.S / Jy beam-1 | 3.5 | 2.2 | 5.1 |
2.3 ALMA Band 6 Observations
Two of the quasars - ULASJ1234 and ULASJ2315 - were also observed using ALMA Band 6 with the aim of probing the high-excitation gas via the CO(7-6) transition, as well as the dust continuum at observed frame wavelengths of 1.2mm. Observations were conducted in 2017 March using the most compact available configuration. The correlator was configured to four dual polarization bands of 2 GHz (1.875 GHz effective) bandwidth each providing a channel width of 15.625 MHz. Two of the basebands were centred on the CO(7-6) and CI(2-1) transitions respectively, while the other two basebands were positioned so as to obtain a measurement of the dust continuum emission. More details of these observations can be found in Table 2.
| ULASJ12340907 | ULASJ23150143 | |
| Date Observed | 2017-03-25 | 2017-03-25 |
| Number of Antennae | 43 | 41 |
| Exposure Time / mins | 36.8 | 52.3 |
| Beam Size (line) / | 1.961.76 | 1.981.72 |
| Beam Size (continuum) / | 1.841.66 | 1.661.42 |
| Channel R.M.S in 15.6 MHz channels / mJy beam-1 | 0.27 | 0.24 |
| Continuum R.M.S / Jy beam-1 | 39 | 41 |
All data were calibrated and reduced using the ALMA pipeline in casa (v4.7.0) by executing the appropriate ALMA calibration scripts corresponding to the release date of the observations. Time dependent amplitude and phase variations were calibrated using nearby quasars while flux calibrations made use of observations of Ganymede and Neptune. Dust continuum images and spectral line cubes were produced from the calibrated visibilities using the casa task clean. In the case of ULASJ1234 we used natural weighting of the visibilities to produce both the line and continuum images. For ULASJ2315, natural weighting was used to produce the line image but a Briggs weighting with robust=0.5 was found to produce a better compromise between sensitivity and resolution when producing the continuum image. In B17 we serendipitously detected CO(3-2) emission from two companion galaxies to ULASJ1234. The galaxy closest to the quasar - G1234S - lies within the full-width-half-maximum of the ALMA primary beam in Band 6, but the second companion galaxy - G1234N - does not. We constructed continuum and line images for G1234S from the primary-beam corrected image centred on the quasar, although we note that G1234S lies very close to the 10% response level of the beam where casa truncates the image by default. A natural weighting of the visibilities was used.
For the spectral line cubes, continuum subtraction was carried out in the u-v plane using the casa task uvcontsub, employing the line-free channels to determine the continuum level. The pipeline reduction applies Hanning smoothing to the spectra by default. The final beam sizes for both the line and continuum images, the typical root mean square (RMS) sensitivities, as well as other details of the observations, are summarised in Table 2.
2.4 ALMA Band 3 Observations
ALMA Band 3 observations tracing CO(3-2) emission as well as continuum emission at rest-frame frequencies of 300-370 GHz were presented for all three quasars in B17. In Paper II we present new higher angular resolution, higher signal-to-noise ratio (S/N) observations of ULASJ2315 and ULASJ1234, which represent a factor of 3 improvement in spatial resolution (from 3 to 1) compared to the observations in B17. Both the continuum flux densities and CO(3-2) line properties inferred from these observations are used later in this paper. The results from B17 and Paper II are therefore summarised in Table 3 but readers should refer to these papers for further details of these measurements. Whenever possible, we make use of the higher S/N measurements from Paper II. In Paper II we show that the CO(3-2) emission from ULASJ2315 is clearly resolved both spatially and spectrally into two distinct components with r1.9(=15 kpc at ) and v160 km/s, and this system is therefore a close separation merger. In several of the observations presented here, we do not have the necessary angular resolution to be able to separate the emission from the two components of the merger. We therefore consider both integrated properties of the system (from the low angular resolution data in B17) as well as spatially resolved properties of the quasar host galaxy and the nearby companion galaxy (presented in detail in Paper II). Readers are referred to Paper II for details of the dynamical analysis of the gas emission in both ULASJ2315 and ULASJ1234 and their associated companion galaxies including a comparison of the CO(3-2) gas dynamics with the kinematics of some of the other molecular lines studied in this work.
2.5 Line and Continuum Measurements
In the following section we use our new data to derive constraints on the continuum and emission line fluxes in our quasar host galaxies and companions. In all cases continuum flux densities are estimated by fitting a 2-dimensional elliptical Gaussian to the continuum source in the image plane, although we have checked that our results do not change if the fitting is done in the u-v plane instead. In the case of the emission lines, we first extract 1-dimensional spectra from the continuum subtracted line cubes and then derive line properties by fitting either a single or double Gaussian to the emission line in the 1-d spectrum as detailed below.
3 Results
| ULASJ0123 | ULASJ1234 | G1234N | G1234S | ULASJ2315 (Tot) | ULASJ2315 (QSO) | ULASJ2315 (Gal) | |
| CO Redshift from B17 or Paper II | 2.630 | 2.503 | 2.514 | 2.497 | 2.566 | 2.566 | 2.566 |
| JVLA Ka-band Observations (This Paper) | |||||||
| Continuum / GHz | 33.1730 | 33.7492 | 33.7492 | 33.7492 | 33.4775 | – | – |
| Continuum Sν / Jy beam-1 | 272 | 572† | 6.6 | 6.6 | 35020† | – | – |
| CO(1-0) FWHM / km s-1 | 45060 | 1100470 | 450240 | 530∗ | 450210 | – | – |
| CO(1-0) Line Intensity / Jy km s-1 | 0.110.01 | 0.110.01 | 0.070.01 | 0.05 | 0.080.01 | – | – |
| CO(1-0) Line Luminosity / 106 L⊙ | 1.70.2 | 1.60.2 | 1.10.1 | 0.70 | 1.10.2 | – | – |
| L’CO(1-0) / 1010 K km s-1 pc2 | 3.70.4 | 3.60.4 | 2.30.3 | 1.6 | 2.60.4 | – | – |
| ALMA Band 6 Observations (This Paper) | |||||||
| Continuum / GHz | – | 245.8170 | – | 245.8170 | 242.0485 | 242.0485 | 242.0485 |
| Continuum Sν / mJy beam-1 | – | 1.330.03 | – | 0.910.04 | 0.920.14† | 0.420.04 | 0.440.12† |
| CO(7-6) FWHM / km s-1 | – | 90080 | – | 920330 | 700180 | 58070 | 20070 |
| CO(7-6) Line Intensity / Jy km s-1 | – | 1.970.07 | – | 1.060.06 | 0.520.07 | 0.450.10 | 0.100.03 |
| CO(7-6) Line Luminosity / 108 L⊙ | – | 1.960.07 | – | 1.060.06 | 0.540.07 | 0.470.10 | 0.110.04 |
| L’CO(7-6) / 1010 K km s-1 pc2 | – | 1.250.05 | – | 0.670.04 | 0.350.05 | 0.300.07 | 0.070.02 |
| CI(2-1) FWHM / km s-1 | – | 63090 | – | 880320 | 520120 | 62090 | 6050 |
| CI(2-1) Line Intensity / Jy km s-1 | – | 0.590.07 | – | 1.090.06 | 0.490.07 | 0.470.10 | 0.100.03 |
| CI(2-1) Line Luminosity / 107 L⊙ | – | 5.80.7 | – | 10.80.6 | 5.20.7 | 4.91.0 | 1.00.4 |
| L’CI(2-1) / 109 K km s-1 pc2 | – | 3.70.5 | – | 6.80.4 | 3.20.5 | 3.10.7 | 0.60.2 |
| ALMA Band 3 Observations (B17 and Paper II) | |||||||
| Continuum / GHz | 100.8415 | 86.2308 | 91.4662 | 91.4662 | 102.6883 | 102.6042 | 102.6042 |
| Continuum Sν / Jy beam-1 | 9816 | 717 | 385 | 342 | 25917† | 1608 | 457† |
| CO(3-2) FWHM / km s-1 | 52040 | 87060 | 56070 | 53080 | 35050 | 30060 | 19040 |
| CO(3-2) Line Intensity / Jy km s-1 | 1.400.08 | 0.930.02 | 0.800.02 | 0.450.02 | 0.910.05 | 0.270.02 | 0.280.01 |
| CO(3-2) Line Luminosity / 107 L⊙ | 6.50.3 | 3.970.09 | 3.400.07 | 1.930.07 | 4.00.2 | 1.190.07 | 1.260.06 |
| L’CO(3-2) / 1010 K km s-1 pc2 | 5.30.3 | 3.210.07 | 2.770.06 | 1.560.05 | 3.20.2 | 0.960.06 | 1.010.05 |
3.1 Far Infra-red to Radio Continuum
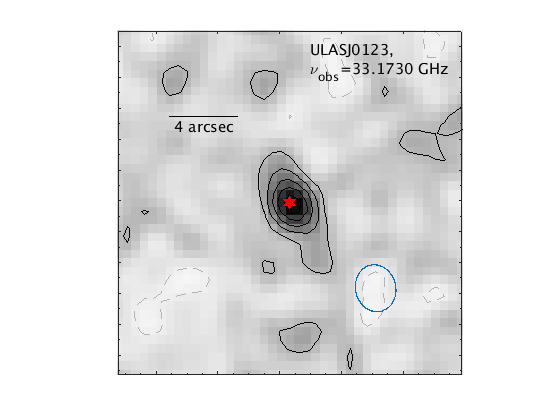
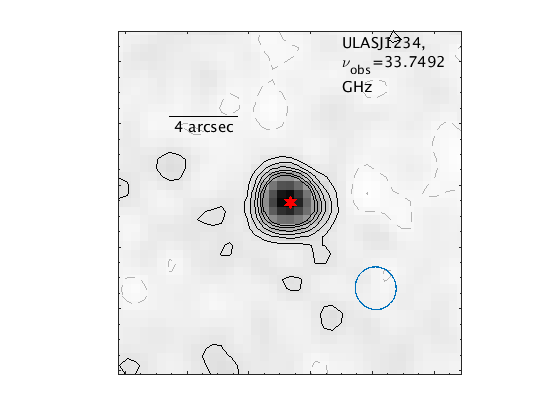
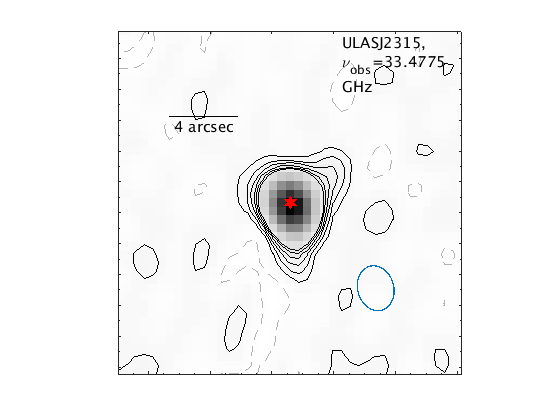
All of our quasars observed with the JVLA were detected in the continuum at rest-frame frequencies of 118-120 GHz. The continuum images are shown in Fig. 1 and the flux densities are summarised in Table 3. Even at the low angular resolution of the JVLA data (major axis of beam 2.5), two of the three quasars are spatially resolved in continuum emission. ULASJ1234 has a spatial extent of 1.3 while ULASJ2315 has a spatial extent of 0.8 along the major axis (after deconvolving from the beam). Neither of the companion galaxies to ULASJ1234 are detected in the continuum and 3 upper limits on their flux densities are quoted in Table 3.
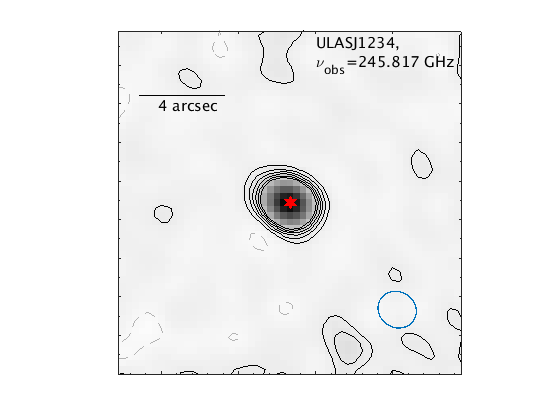
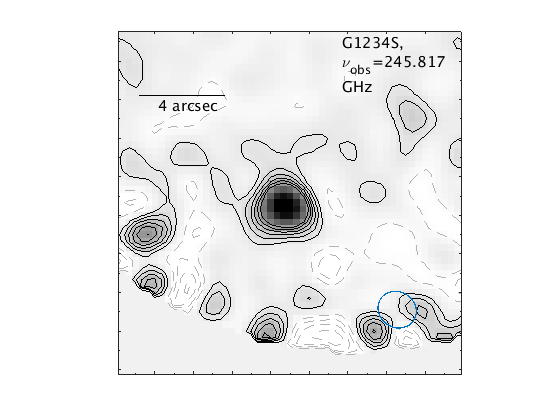
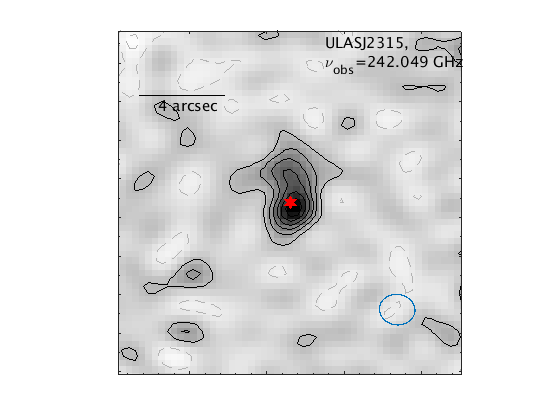
We also detected continuum emission at rest-frame frequencies of 859-862 GHz from both quasars observed with ALMA in Band 6 as well as the single companion galaxy to ULASJ1234 that falls within the ALMA Band 6 primary beam. The continuum flux densities are again summarised in Table 3 and the images are shown in Fig. 2. The continuum emission is unresolved, or only marginally resolved, in the case of ULASJ1234 and its companion galaxy G1234S. However, in the case of the close-separation merger ULASJ2315 (Paper II), spatially extended continuum emission is seen, with the two components of the merger evident in the image in Fig. 2. Using the casa task imfit, we model the dust continuum image as the sum of two 2-dimensional Gaussian components. One of the Gaussian components is centred near the quasar while the second has a best-fit centroid that is 1.85 (15 kpc) to the north of the quasar. The distance is consistent with the physical separation between the two components of the merger inferred from the CO(3-2) gas emission in Paper II. The dust emission from the quasar is unresolved but the emission from the northern companion galaxy is extended with a deconvolved size of 2.0 along the major axis as inferred from imfit. The continuum flux densities of both components of the merger are also presented in Table 3. From hereon, we refer to these two components of the merger as the ‘QSO’ and ‘GAL’ components of ULASJ2315.
 |
|
|
 |
|
|
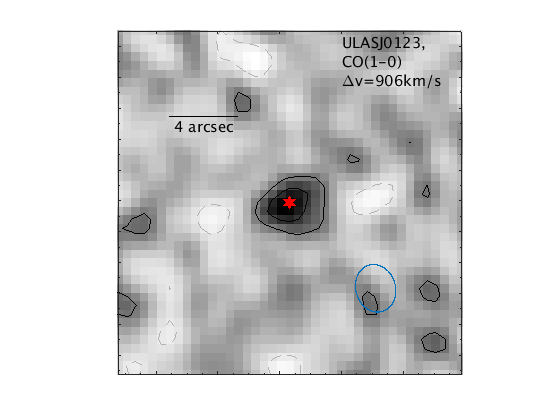
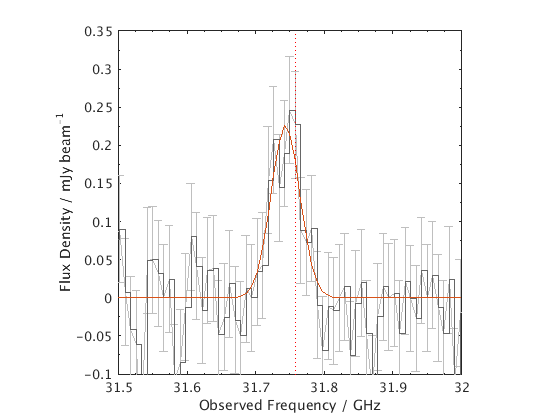
3.2 CO(1-0) Line Properties
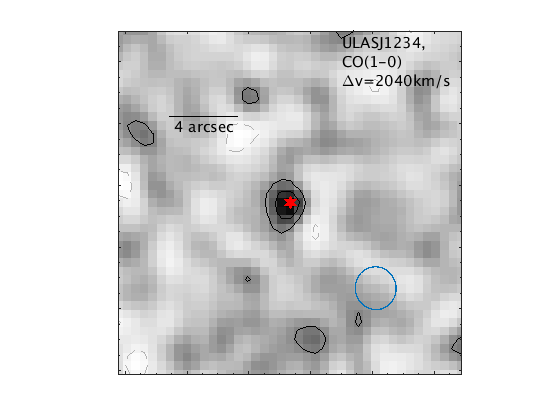
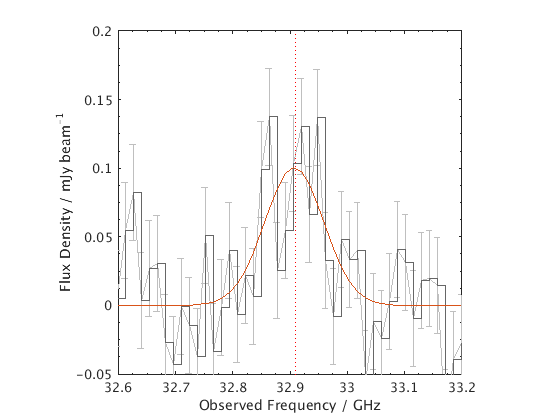
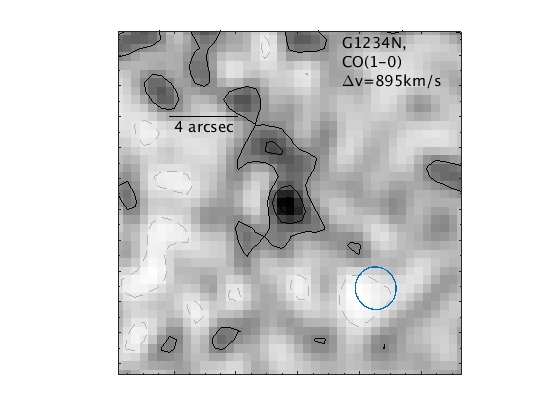
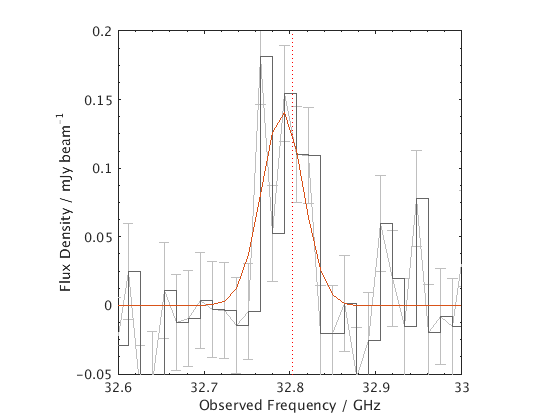
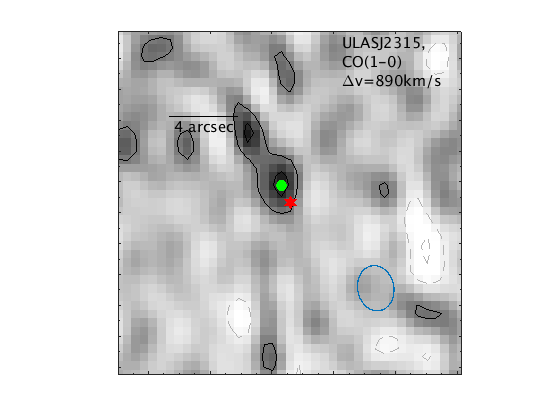
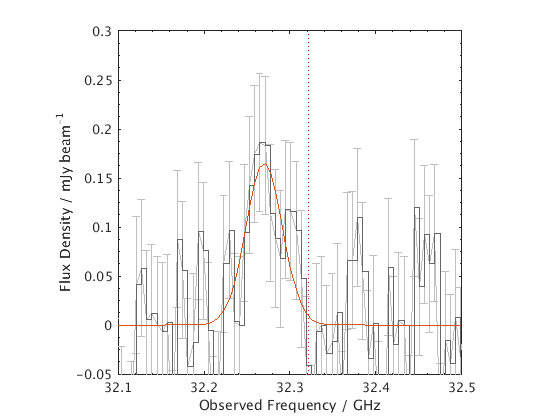
We detected CO(1-0) emission from the three quasars observed with the JVLA as well as from the brighter companion galaxy to the quasar ULASJ1234 - G1234N. The S/N of all the CO(1-0) detections are relatively modest at the native resolution of the data. We have, therefore, re-binned the spectral axis by factors of 4, 7, 7 and 4 for ULASJ0123, ULASJ1234, G1234N and ULASJ2315 respectively, to provide five or six resolution elements across the the full width at half maximum (FWHM) of the line, as inferred from the CO(3-2) observations in B17 and Paper II. The CO(1-0) maps together with the binned CO(1-0) spectra for the four sources are shown in Fig. 3.
We model the CO(1-0) line profiles using a single Gaussian and derive line properties (see Table 3) from the model. The second companion galaxy near the quasar ULASJ1234 - G1234S - is undetected in CO(1-0) and we derive an upper limit on the CO(1-0) brightness temperature, assuming that the line has the same width and velocity centroid as the CO(3-2) emission from this source, which is detected at high S/N in Paper II.
For ULASJ2315, the peak of the CO(1-0) emission appears to be spatially offset from the quasar by 1.10.5. No such offset is seen in the JVLA Ka-band continuum image in Fig. 1 suggesting that the offset between the quasar and the CO(1-0) emission is likely real. In Paper II, and in the ALMA dust continuum image shown in Fig. 2, we have seen that ULASJ2315 is a merger of two galaxies. Although our JVLA observations lack the spatial resolution to be able to resolve the two components, the peak in the CO(1-0) emission is spatially coincident with the northern companion galaxy rather than the quasar. The spectrum in Fig. 3 is extracted at the peak position of the CO(1-0) emission rather than at the quasar centroid, and also shows a velocity offset of 500100 km s-1 relative to the CO(3-2) emission from the quasar. This may also be suggestive of different kinematics affecting the cold and warm gas reservoirs in this system although higher resolution, higher S/N data would be needed to confirm this.
 |
|
 |
|
 |
|
 |
|
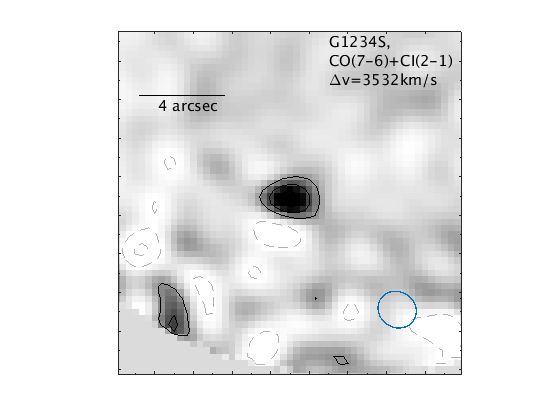
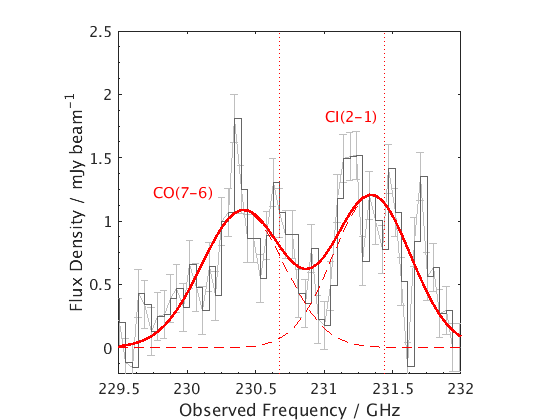
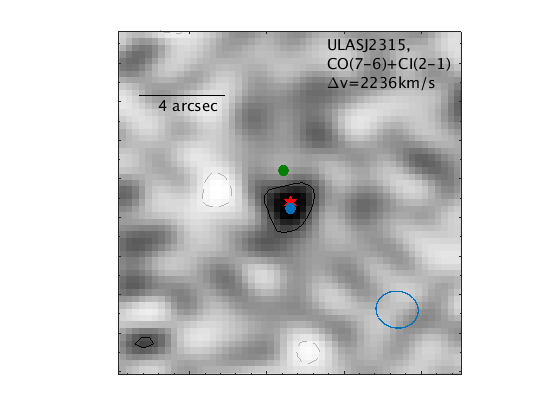
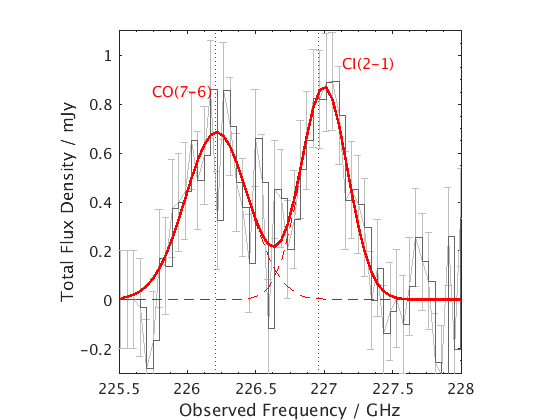
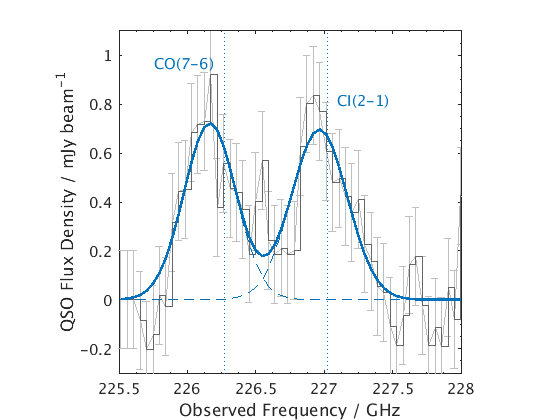
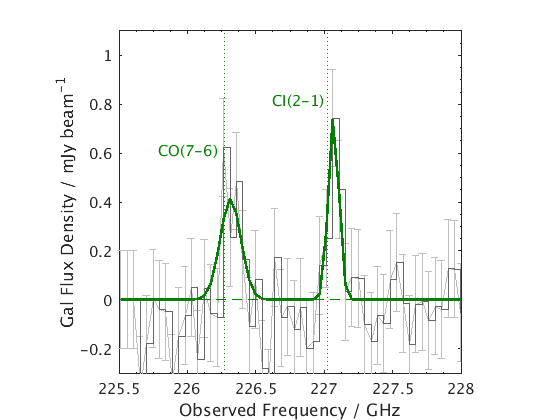
3.3 CO(7-6) and CI(2-1) Line Properties
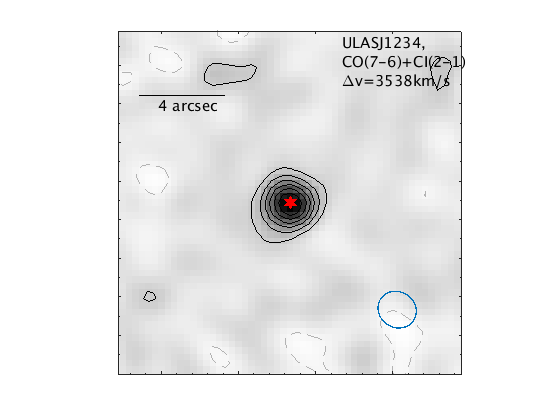
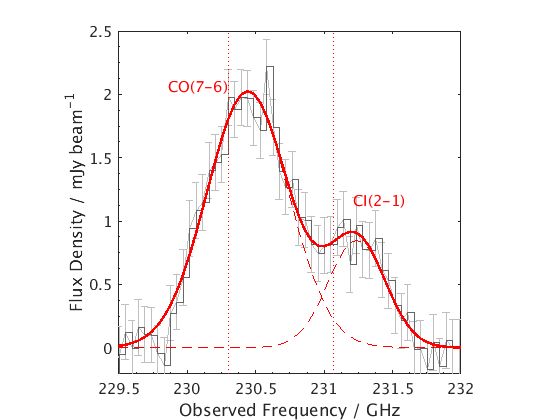
CO(7-6) and CI(2-1) line emission is detected from the two quasars targeted with ALMA as well as the companion galaxy G1234S. The spectra covering both lines, as well as the line maps in this region, can be seen in Fig. 4 and Fig. 5. We model the combined CO(7-6) and CI(2-1) line profiles as the sum of two Gaussian components. In the case of ULASJ2315 we consider the integrated line emission from both galaxies in the system, as well as the “resolved" line emission. The latter is estimated by assuming that the CO(7-6) and CI(2-1) emission is unresolved in each component of the merger in the current Band 6 data, but spatially co-incident with the CO(3-2) emission, which is clearly resolved in Paper II. The derived line properties for all sources are summarised in Table 3.
As can be seen in Fig. 5 and Table 3, the line properties change markedly across the two components of the merger in the ULASJ2315 system. In particular, the quasar host galaxy appears to have broad emission lines whereas the companion northern galaxy is characterised by much narrower line emission and a higher CI(2-1) peak flux-density compared to CO(7-6). The CO(7-6) lines are generally broader than the CI(2-1) lines but the difference is only statistically significant in the case of ULASJ1234 and the galaxy component of ULASJ2315. In both cases, the difference suggests that the high-density, highly excited gas traced by CO(7-6) is probably coming from a different region of the galaxy compared to the lower-density gas traced by CI(2-1).
 |
|
 |
|
 |
|
 |
|
4 Analysis
4.1 Dust Continuum & Non-Thermal Spectral Energy Distribution
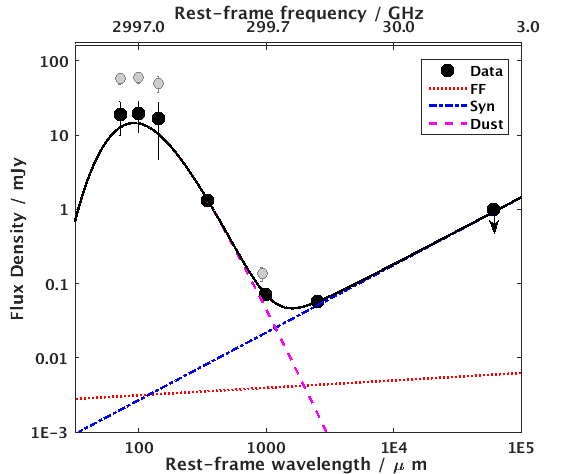
The new ALMA Band 6 and JVLA Ka-band continuum observations when combined with our ALMA Band 3 observations (B17 and Paper II), now allow us to sample the radio to far infra-red spectral energy distribution in these sources (Condon:92). The extended frequency range allows emission from the Rayleigh-Jeans tail of the dust spectral energy distribution (SED) to potentially be separated from free-free emission and non-thermal synchrotron emission. In the case of both ULASJ1234 and ULASJ2315, we sample the far infra-red to radio continuum at 240GHz, 100GHz and 33GHz (840-850 GHz, 350-360GHz, 115-117GHz). In the case of ULASJ0123 we have two continuum data points at 100 GHz and 33 GHz. ULASJ1234 was also detected using Herschel (Banerji:14) although due to the poorer angular resolution of Herschel the photometry is a blend of the quasar and the two other companion galaxies located near it (Section 2.1). ULASJ1234 and ULASJ2315 are both covered by the VLA-FIRST survey and both quasars are undetected at =1.4 GHz with flux density limits of 1 mJy and 0.93 mJy respectively.
We fit SED models that are a composite of a power-law synchrotron component, which dominates at frequencies below 30 GHz, a thermal free-free component with a power-law index of and a single temperature greybody component described by a dust temperature, Td and emissivity index, . Due to the limited number of photometric points we fix the parameters of the greybody to Td=47K and =1.6 (Beelen:06), although the constraints are similar for =1.62.4. For ULASJ2315 we consider integrated fluxes from the entire merger system as we do not resolve the individual components of the merger at all frequencies. The SED-fit parameters for this system should therefore be interpreted with caution as discussed in detail below.
In line with previous studies (e.g. Wagg:14), we characterize the SED of each galaxy by assuming the linear relationships from Yun:02 between the total star formation rate and the three components describing the radio to far infra-red spectral energy distribution - the non-thermal synchrotron (), free-free (), and thermal dust () emission:
| (1) |
| (2) |
| (3) |
| (4) |
Our free parameters are therefore the non-thermal fraction (), synchrotron spectral slope () and star formation rate () with the dust emissivity index () and dust temperature () fixed as previously mentioned.
Models are fit to the data using the Bayesian inference code MultiNest (Feroz:08) in combination with the Python wrapper PyMultinest (Buchner:14) to solve for the free parameters. We assume a log-uniform prior for SFR (10-9000 M⊙yr-1) and uniform priors for log (0.5-1.5) and (0.1-1.6) in order to best explore the full range of reasonable values for these parameters. PyMultiNest explores the parameter space using ellipsoidal nested sampling, returning a posterior probability distribution for each parameter and therefore full covariances for all parameters.
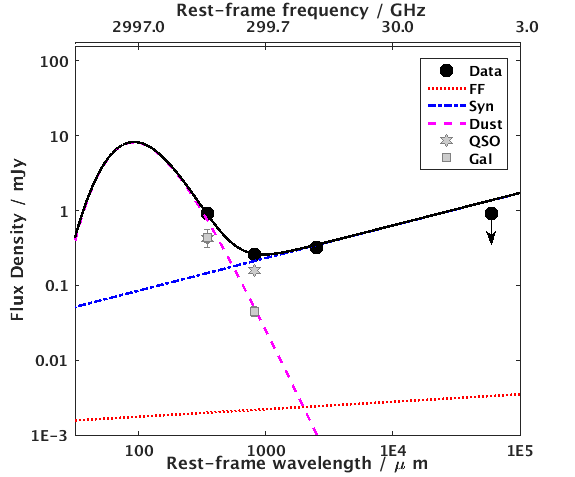
The SED-fitting is carried out for ULASJ1234 and ULASJ2315 only where we have at least 3 continuum detections as well as upper limits from FIRST. As the Herschel photometry at =250, 350 and 500m constrains the peak of the dust SED, we also include this photometry in our SED-fitting for ULASJ1234 assuming equal contributions from the three galaxies to the Herschel fluxes. We have checked that dividing the Herschel flux according to the ratio of ALMA fluxes in the three galaxies does not affect the results significantly. The best-fit SEDs together with the individual components of the SED for our two quasars, are presented in Fig. 6. The free-free contribution to the 33GHz data points is negligible. Using Eq. 2, we estimate that SFRs of 104M⊙yr-1 would be required for the free-free contribution to dominate at these frequencies. In the case of ULASJ2315, we caution that we have used the integrated flux densities summed over both components of the merger as we lack the angular resolution necessary to be able to resolve the individual components of the merger at all frequencies. However, in Fig. 6 we show for reference the derived flux densities of both merger components at high frequencies where we are able to separate out the contribution from the QSO and GAL.
In B17, we presented star formation rates and dust masses based on the single continuum data point at GHz. The new continuum observations presented in this paper allow us to quantify the non-thermal contribution to these frequencies and therefore revise the star formation rates and dust masses. From our best-fit SEDs, we find log10(fnth)=1.20.3 and 1.30.1, and SFRs of 1160120 M⊙ yr-1 and 680100 M⊙yr-1 for ULASJ1234 and ULASJ2315 respectively. The values are consistent with the high SFRs inferred for other FIR-luminous quasar host galaxies at high redshifts (Omont:01; Priddey:03). Dust masses are calculated from the dust SED components of these fits assuming the emission in the Rayleigh-Jeans tail of the SED is optically thin:
| (5) |
where is the mass absorption coefficient of the dust and is given by , is the luminosity distance, is the Planck function and is assumed to be 0.045 m2 kg-1 at =250GHz. The new dust masses are log10(Mdust)=8.32 and 8.09 for ULASJ1234 and ULASJ2315 respectively. In the case of ULASJ2315 our new observations show that non-thermal emission dominates the 100 GHz continuum used to estimate the SFR and dust mass in B17. The new SFR and dust mass have therefore decreased by an order of magnitude relative to the results in B17.
We have also constrained the synchrotron power-law index in both quasars: for ULASJ1234 and in ULASJ2315. The flat synchrotron power-law slope in ULASJ2315 almost certainly arises because the quasar is dominating the 33 GHz JVLA continuum emission, whereas both the quasar and the merging companion galaxy begin contributing to the emission at higher frequencies (see Fig. 6). Higher spatial resolution observations of the ULASJ2315 system at all frequencies, would help constrain the exact form of the SED in the individual components of the merger. Particularly for ULASJ2315, the limited amount of photometry available limits the constraints we can get on the dust SED. We have therefore also fit the SEDs of both quasars after fixing the synchrotron power-law index to values of =0.75 and =0.1, which encompass the full range expected in high-redshift quasars (e.g. Momjian:14). For ULASJ1234, a flat radio spectrum is ruled out by the data and the constraints on the SFR and the non-thermal fraction for =0.75 agree within the errors with the varying- fits. For ULASJ2315, the steep =0.75 SED is highly inconsistent with the FIRST upper limit and assuming =0.1 instead would reduce the SFR by a factor of 1.5 to 43090 M⊙yr-1. However, we again caution against over-interpretation of these numbers given the lack of constraints at the peak of the dust SED and also the fact that we know this source is composed of two separate galaxies, which are not resolved in our low-frequency data.
 |
 |
For ULASJ0123, where continuum emission at 33 GHz is detected with the JVLA, we do not have enough photometric data points to be able to carry out the full SED-fitting described above. Based on the SEDs of ULASJ1234 and ULASJ2315 we assume that free-free emission makes a negligible contribution to the SED, while synchrotron emission dominates the JVLA continuum emission with a power-law index of . Adopting such assumptions, we can estimate the non-thermal emission contributing to the 100 GHz continuum used to infer star formation rates and dust masses in B17. The result is 13 per cent, giving a revised SFR for the quasar host galaxy of 2000400Myr-1 (assuming Td=47K and =1.6) and a dust mass of log10(Mdust/M⊙)=8.63. These results are consistent, within the error-bars, with those derived in B17. The results change by 10% if a flatter synchrotron slope is instead assumed.
Regardless of the exact constraints on the SFRs for these quasar hosts, which depend on the details of de-blending low-resolution observations of these multi-component sources as well as the assumptions made regarding the form of the SED, the inference of significant amounts of star formation in all three quasar host galaxies is strongly evidenced by our data.
Finally, we have also detected dust continuum emission from the two companion galaxies to ULASJ1234 - G1234S and G1234N (Table 3). No continuum emission was detected at lower frequencies with the JVLA for these sources, so it is reasonable to assume that any contribution from non-thermal emission to the ALMA data points is negligible. Estimates of the dust mass and star formation rates in these companion galaxies depend heavily on the assumptions made regarding the dust temperature and dust emissivity index in these galaxies. If we assume canonical values for starburst galaxies - Td=30K and =1.5 (Casey:14), the SFRs are 260 M⊙yr-1 and 190M⊙yr-1 for G1234S and G1234N respectively and the dust masses are log10(Mdust/M⊙)8.7-8.8. However, if a Td=47K and =1.6 SED were assumed instead, as was done for the quasars, the SFRs would increase to 1000 M⊙yr-1 and the dust masses would be lower by 0.4 dex.
4.2 Gas Excitation & Physical Conditions in the ISM
With multiple molecular lines detected in our reddened quasars, as well as several of their companion galaxies, we can now try to better understand the gas excitation and the properties of the interstellar medium in these sources.
4.2.1 The CO(3-2) to CO(1-0) Line Ratio
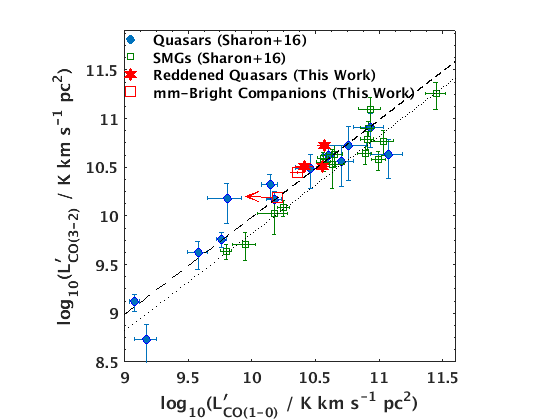
Combining the CO(1-0) fluxes for three of our quasars (Section 3.2) as well as the companion millimetre-bright galaxies to ULASJ1234 (G1234N and G1234S) with the CO(3-2) detections in B17 and Paper II, we can study the ratio of the brightness temperature between these lines: r31=. While historically there has been some evidence for a difference in r31 between the quasar and SMG populations - Carilli:13 suggest r31=0.67 for SMGs and 0.99 for quasar host galaxies - Sharon:16 presents evidence that quasars and SMGs have very similar cold and warm gas reservoirs. In Fig. 7 we plot versus for our sources and compare them to both quasars and SMGs from Sharon:16, which are at a similar redshift to our sample.
Our quasar host galaxies and their companion millimetre-bright galaxies have CO(3-2) and CO(1-0) line emission that is fairly typical of the high-redshift quasar and SMG sample and there is no evidence for a statistical difference in excitation properties. We note, however, that at least one of our sources - ULASJ2315 - is known to be a close separation merger of two distinct galaxies. In Section 3.3, we have seen that the QSO and GAL components have very different CO(7-6) and CI(2-1) line properties. Our observations of CO(1-0) lack the angular resolution to separate emission from the components. However, in Section 3.2, we have seen that the peak of the CO(1-0) emission is spatially coincident with the companion galaxy rather than the quasar host galaxy. If higher spatial resolution observations of CO(1-0) indeed showed this to be the case, and given that our high-resolution observations of CO(3-2) imply comparable CO(3-2) luminosities in the QSO and GAL components (Paper II), this would imply that the QSO and SMG components of the merger have very different values of r31.
It is important to note that many of the published molecular gas detections in SMGs and quasars e.g. with the VLA and Plateau de Bure Interferometer (Barvainis:98; Coppin:08; Carilli:02b) lack the spatial resolution to be able to resolve close separation mergers such as ULASJ2315. Several of the hyper-luminous quasars and SMGs studied in Sharon:16 for example, could plausibly be mergers of quasars and SMGs and some dilution of any putative differences in r31 between quasars and SMGs is therefore expected when considering emission averaged over multiple merging components with different excitation properties.
4.2.2 The CO(7-6) to CI(2-1) Line Ratio
The CO(7-6) and CI(2-1) molecular emission lines have very different critical densities and their line ratio can therefore be used to study the relative amounts of high-density and low-density gas in the ISM. Several recent studies have also suggested that in the high cosmic-ray ionization rate environments that are thought to represent high-redshift starburst and quasar-host galaxies, the CO molecule can be destroyed and dissociate into atomic carbon (Bisbas:15b), leading to higher [CI]-to-CO line ratios. Comparing the relative line intensities of CO(7-6) and CI(2-1), therefore provides us with an effective diagnostic for such processes.
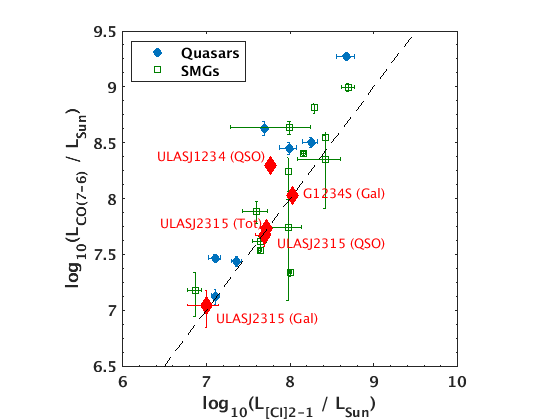
In order to put our galaxies in context, we have compiled a list of quasars and SMGs at similar redshifts where both the CO(7-6) and CI(2-1) lines have been detected (Carilli:13; Gullberg:16). We derived intrinsic line luminosities for the sources in the literature from the line intensities, using published redshifts and magnification factors to correct for the effects of lensing. These line luminosities are plotted in Fig. 8 alongside the measurements for our reddened quasars and their companion galaxies. In the case of ULASJ2315, we present both the integrated luminosities for the entire system as well as the luminosities of the individual components. We find that while ULASJ1234 has a much higher CO(7-6) line luminosity compared to CI(2-1), the two line luminosities are fairly similar for both components of the ULASJ2315 major-merger system. Thus the amount of high-density, high-excitation gas relative to the low-density gas appears to be markedly different in the two reddened quasars. G1234S, the companion galaxy to ULASJ1234, also has a CO(7-6) line luminosity that is comparable to the CI(2-1) line luminosity.
 |
 |
4.2.3 The CO SLED and Photo-Dissociation Region (PDR) Modelling
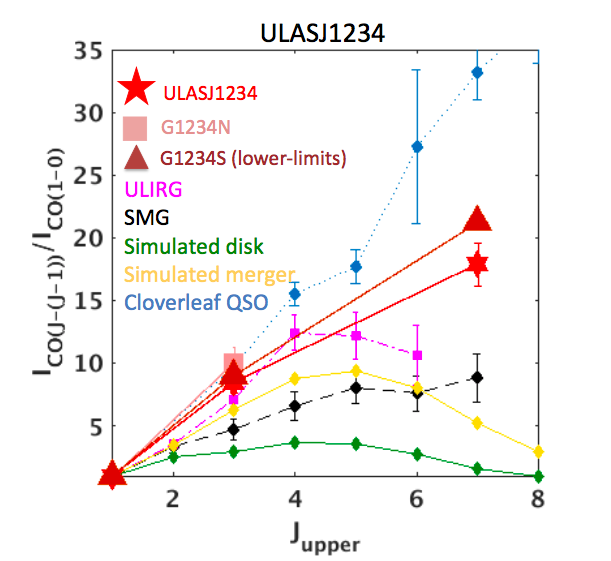
In Fig. 9 we present our constraints on the CO spectral line energy distribution (SLED) for all galaxies in the ULASJ1234 and ULASJ2315 systems. The ULASJ1234 quasar host galaxy has a CO SLED peaking at , which is inconsistent with even the most infrared luminous star-forming galaxies such as ULIRGs and SMGs (Papadopoulos:12; Bothwell:13) and could almost certainly be ascribed to heating from the luminous AGN. The gas excitation is not as extreme as seen in the Cloverleaf quasar for example, but lies somewhere between the quasar and SMG/ULIRG values. The companion galaxy G1234S is similarly extreme in terms of its CO excitation properties. We did not detect CO(1-0) emission from this source but the CO(7-6) emission is considerably higher intensity compared to the CO(3-2) emission and based on the lines available, the CO SLED for this galaxy appears to be very similar to ULASJ1234. This strongly suggests that X-ray or shock-heating could be important in this system even though we currently do not have any evidence for an AGN within it.
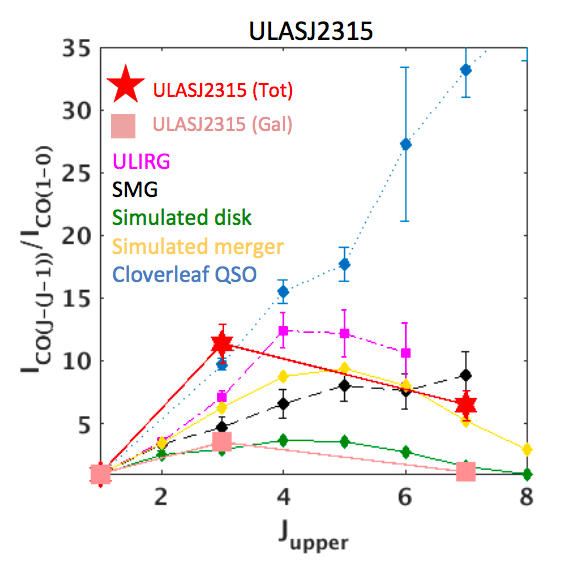
In ULASJ2315 on the other hand, the CO(1-0) emission does not spatially resolve the two components of the major merger. Considering the integrated line properties from both galaxies suggests that the CO SLED peaks at lower-J compared to ULASJ1234 and the SLED is in fact consistent with that seen in both ULIRGs and SMGs despite the presence of the luminous quasar. The ULASJ2315 CO SLED, integrated across both components of the merger, is also in good agreement with simulations of galaxy mergers (Bournaud:15), which were designed to match the observed excitation properties of distant galaxies. In Section 3.2 however we have seen that the CO(1-0) emission in ULASJ2315 is actually spatially co-incident with the companion galaxy rather than the quasar. If all the CO(1-0) emission is in fact coming from the companion galaxy, this would suggest that the galaxy, despite being part of the merger, has a CO SLED that is very similar to what is expected from quiescent disk galaxies (Fig. 9; Bournaud:15). Thus even within this small, relatively uniformly selected quasar sample, we are seeing evidence for a range in gas excitation properties.
We now use all available line ratios for ULASJ1234, ULASJ2315 and G1234S, where we have detected the CO(3-2), CO(7-6) and CI(2-1) molecular line transitions, and compare them to the outputs of Photo Dissociation Region (PDR) models. For ULASJ2315, we consider only the blended emission from the two galaxies in the merger as we do not have the necessary spatial resolution and S/N in all the lines to be able to fully disentangle the different spatial components of the line emission coming from the two distinct components of the merger. We compare the observed line ratios to outputs from the 3D-PDR code111https://uclchem.github.io/ (Bisbas:12). For sources where we also have CO(1-0) line luminosities, we have checked that the constraints do not change significantly when including the CO(1-0) line in the fits. The 3D-PDR code is used to generate a grid of models with uniform densities between and ultraviolet radiation field strengths between where is the radiation field strength in Habing units. We assume a cosmic ray (CR) ionization rate of 100 the Milky Way value - i.e. =10-15s-1 - which is considered typical for starburst galaxies, but we also assess how the results change for models with =10-17, 510-15 and 10-14 s-1. All outputs from the model are integrated line luminosities down to a depth of AV=7 mag, which should be representative of the average properties of star-forming clouds seen in our high redshift galaxies (Pelupessy:06). Qualitatively, the results are very similar for depths of AV=2 and 3 mag.
For G1234S, no constraints on the gas density and radiation field strength were possible even after exploring the full parameter space of the PDR models. As stated earlier, the very high excitation gas seen in this galaxy could indicate that X-ray or mechanical heating dominate over far ultraviolet heating in this system. As this physics is currently not incorporated into our PDR models we are unable to constrain the ISM properties of this galaxy. The constraints on the gas densities and radiation field strength for different values of for the two quasars are given in Table 4. In general we find high gas densities of 105-106 cm-3 in both sources. The available line ratios do not constrain the radiation field strength as well as the density. The exact constraints on the radiation field strength also depend strongly on the CR-ionization rate; lower radiation field strengths are generally preferred for higher CR-ionization rate models as the effect of both is to raise the gas temperature in the ISM. For ULASJ1234 CR-ionization rates as high as 10-14s-1 are allowed by the data. For ULASJ2315 however, such high ionization rate models are excluded and the gas in the galaxy is likely at lower temperatures.
| Source | AV / mag | / s-1 | / | L K km s-1 pc2 | |
|---|---|---|---|---|---|
| ULASJ1234+0907 (QSO) | 7 | 10-17 | 6.33 | 3.25 | 3.40.4 |
| 7 | 10-15 | 6.12 | 4.58 | 3.70.5 | |
| 7 | 510-15 | 5.99 | 2.55 | 4.61.3 | |
| 7 | 10-14 | 5.86 | 1.33 | 5.61.4 | |
| ULASJ2315+0143 (QSO+Gal) | 7 | 10-17 | 5.70 | 1.95 | 4.40.6 |
| 7 | 10-15 | 5.20 | 1.45 | 6.01.0 |
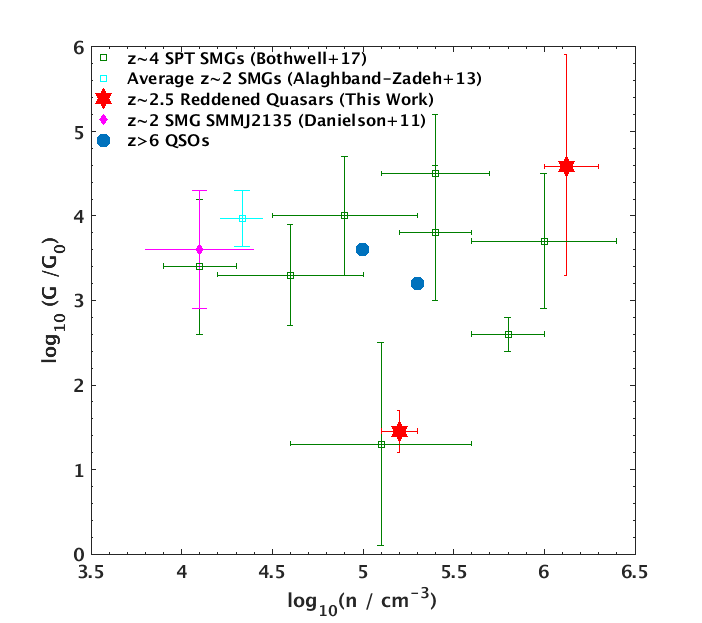
In Fig. 10 we compare the inferred gas densities and radiation field strengths in our two sources for a fiducial CR ionization rate, =10-15s-1, to other high-redshift quasars and SMGs from the literature. Bothwell:17 provides the most direct comparison SMG sample to ours, employing the same PDR-code and model set-up to calculate line ratios. In general our quasars appear to have physical conditions typical of both SMGs and other quasars from the literature. Both quasar host galaxies have high gas densities although they exhibit very different radiation field strengths. Based on our best-fit PDR models, we also derive an excitation temperature for atomic carbon, which then allows us to predict the CI(1-0) line brightness temperature. These values are quoted in Table 4 and used later in the paper.
As hinted at earlier, a caveat of our current modelling is that the 3D-PDR code does not include X-ray and mechanical heating, the effects of which might be expected to be significant in our merging quasar host galaxies. Certainly in the case of ULASJ1234 and G1234S, X-ray heating could be responsible for the high values of the CO(7-6) intensity that we observe in these sources. Observations of other molecular lines such as HCN and HCO+, when combined with the high-J CO lines, could help discriminate between cosmic-ray heating and X-ray heating (Meijerink:11). For ULASJ2315 on the other hand, the similarity of the CO SLED to that of non-AGN populations such as SMGs and ULIRGs, suggests that the effects of X-ray heating are probably not as significant.
Mechanical heating due to shocks from supernova remnants as well as the effects of supersonic turbulence could also contribute to the gas heating and explain the highly excited CO SLEDs seen in some of our sources (Papadopoulos:12). Once again, observations of other lines are necessary to be able to distinguish these processes from the far ultra-violet heating that dominates in the PDR models.
4.3 Mass of Atomic Carbon
The CI(2-1) detections presented in Section 3.3 now add to a growing number of sources in the literature where atomic carbon has been detected (Weiss:05; Walter:11; Alaghband:13; Wang:16; Bothwell:17; Venemans:17). Due to the relative simplicity of the [CI] quantum fine-structure levels compared to the widely studied rotational transitions of the CO molecule, physical parameters such as the excitation temperature and total mass of carbon can be calculated with fewer uncertainties.
We now estimate the total mass of atomic carbon from the CI(2-1) line luminosities (Weiss:03)
| (6) |
where is the [CI] partition function, =23.6K and T2=62.5K are the energies above the ground state. We assume that the line emission from both CI lines is optically thin, and that the lines are in local thermodynamic equilibrium (LTE). We calculate the excitation temperature from the [CI] to [CI] brightness temperature ratios calculated from our best-fit PDR models with =10-15s-1 and AV=7 mags for each of the galaxies:
| (7) |
These excitation temperatures range from 30K in ULASJ2315 to 50 K in ULASJ1234 and are consistent with the values observed in other high-redshift galaxies where both the CI(2-1) and CI(1-0) lines have been detected (Weiss:03; Walter:11). The total mass of carbon is relatively insensitive to the exact value of the excitation temperature for T20K. We find = (4.90.6)106M⊙ for ULASJ1234 and (8.01.3)106M⊙ for the total ULASJ2315 system. For G1234S PDR model-fits aren’t available to directly infer the CI excitation temperature. We therefore assume the average value for high-redshift galaxies from Walter:11. Under these assumptions, we find an atomic carbon mass of (6.20.8)106M⊙ for this galaxy.
4.4 Gas Masses from CO, [CI] and Dust: Implications for the gas-to-dust ratio, carbon abundance and
We have measured the dust continuum emission as well as emission from multiple molecular lines in our high-redshift quasars and their companion galaxies, which has provided direct constraints on the gas excitation in these systems. We can therefore compare gas masses estimated using different tracers in order to test the validity of the assumptions that are implicit in these various gas-mass derivations.
4.4.1 Reconciling CO(3-2) and CO(1-0) based Gas Masses
In B17, we derived gas masses from the brightness temperature of the CO(3-2) line, L assuming an r31 value of 0.8 for the quasar host galaxies and r31=0.67 for the companions (Carilli:13). With both CO(1-0) and CO(3-2) measurements now available, we can directly measure r31 and derive gas masses from the CO(1-0) emission. The constraints on r31 are given in Table 5. For all 3 quasars and both companion galaxies in the ULASJ1234 system, we find , although we caution that for ULASJ2315, the interpretation of the brightness temperature ratio is almost certainly complicated by the fact that this source is part of a major merger with likely very different excitation conditions in the merging galaxies. Nevertheless, the gas masses inferred from the CO(1-0) emission would be lower than those inferred in B17 using CO(3-2). Values of r do not usually occur in high-redshift starburst galaxies, where the ISM is thought to be dominated by molecular gas and the CO emission is optically thick. Given the relatively modest S/N of the CO(1-0) detections, it is likely that we are missing extended, low surface-brightness emission below our detection threshold. Alternatively, the superthermal values of r31, particularly in the case of ULASJ0123 where we find r, could also result from X-ray heating or shock heating of the interstellar gas, which can penetrate much deeper into molecular clouds and therefore maintain a low optical depth in CO emission (Meijerink:06; Ivison:12). Such mechanisms could plausibly be at work in our high-luminosity quasars.
In Table 5, we present gas masses derived from the CO(1-0) as well as the CO(3-2) brightness temperature for all sources. In cases where LL or where we currently have no constraints on L, we assume r31=1.0.
4.4.2 Dust-based Gas Masses
In Section 4.1 we have quantified the contributions from non-thermal emission to the observed continuum fluxes and therefore better constrained the dust SED and the dust masses in these quasars compared to those presented in B17. With some knowledge of the gas-to-dust ratios in our high-redshift galaxies, the dust masses can be used as a proxy for the gas masses (Scoville:14). In B17 we assumed that a gas-to-dust ratio of 91, as measured in nearby galaxies (Sandstrom:13), was appropriate for our high-redshift galaxies. In this work, we allow for a range of gas-to-dust ratios given that this quantity is known to depend on metallicity (Draine:07; Remy-Ruyer:14). We take the gas-phase metallicities of high-redshift star-forming galaxies from Santini:14 to be representative of our high-redshift sample. The range in metallicities - 12+log(O/H)=8.58-9.07 - translates to gas-to-dust ratios of 42-130 based on Draine:07, with a mean value of 62 corresponding to a mean gas-phase metallicity of 8.9 for the star-forming galaxies. We then derive gas masses from the dust masses for all our quasars and companion galaxies assuming these gas-to-dust ratios. We have deliberately not constrained the dust masses or the dust-based gas masses for the two companion galaxies to ULASJ1234,G1234N and G1234S, as we only have a limited amount of photometry and no knowledge of the form of the dust SED in these sources. Hence any dust-based gas mass estimates would be highly uncertain. The dust masses as well as the dust-based gas masses are summarised in Table 5.
There is a large uncertainty in the dust-based gas masses when allowing for a range in metallicities in the sample. Nevertheless, the CO-based gas masses are higher than those predicted from the dust for both ULASJ1234 and ULASJ2315. This could imply values of M⊙(K kms-1pc2)-1, or, alternatively, gas-to-dust ratios of 150-200, which would imply lower metallicities than observed in typical star-forming galaxies at these redshifts.
4.4.3 Gas Masses from Atomic Carbon
It has been argued by several authors that the CI emission can be a more effective tracer of the total gas mass in high-redshift galaxies compared to CO, particularly at low metallicities and for high cosmic ray ionization rates where the CO molecule is known to become an increasingly poorer tracer of total gas mass (Glover:16). In Section 4.2.3 we used the results of our PDR modelling together with the observed brightness temperature of the CI(2-1) line in our sources (Table 3), to predict the CI(1-0) brightness temperature, L. We now use these brightness temperatures to calculate a CI-based gas mass using the relation:
| (8) |
where XCI=CI/H2 represents the atomic carbon abundance, A10=7.9310-8s-1 is the Einstein A coefficient and Q10 is the excitation factor, which depends on the temperature, density and radiation field of the ISM. We assume a value of XCI=3, based on a template of M82 used previously for high-redshift SMGs and quasars (Weiss:03; Weiss:05). Q10 is assumed to be 0.6 (Bothwell:17). The resulting gas masses are once again presented in Table 5. In ULASJ1234 the CI-based gas mass is consistent with the CO-based gas mass and the inferred values of and the atomic carbon abundance are therefore consistent with the canonical values assumed in our gas mass derivations. However, for ULASJ2315, we find a CI-based gas mass that is a factor of 2 higher than that inferred from CO. Given the uncertainties on each measurement, this difference is significant at the 2 level. In G1234S however, the CI-based gas mass estimate is almost 6 higher than that inferred from CO. The CI and CO-based gas masses can be reconciled if 0.8 M⊙(K kms-1pc2)-1, or, alternatively, if the carbon abundance in G1234S is 6 higher than the assumed value of 310-5.
| ULASJ0123 | ULASJ1234 | G1234N | G1234S | ULASJ2315 (Tot) | |
| SFR / M⊙ yr-1∘ | 2000 | 1160 | 190 | 260 | 680 |
| CO(1-0) M / 1010 M⊙ | 3.00.4 | 2.90.3 | 1.80.2 | 1.3 | 2.10.3 |
| r31 | 1.40.2 | 0.90.1 | 1.20.1 | 0.98 | 1.20.2 |
| CO(3-2) M / 1010 M⊙ | 4.20.2 | 2.90.3 | 2.20.2 | 1.250.01 | 2.60.2 |
| log10(Mdust/M⊙)∘ | 8.63 | 8.32 | 8.66 | 8.75 | 8.09 |
| Dust M / 1010 M⊙ | 1.8-5.5 | 0.9-2.7 | – | – | 0.5-1.6 |
| / M⊙ (K kms-1 pc2)-1 | 0.5-1.5 | 0.2-0.8 | – | – | 0.2-0.6 |
| Gas-to-dust ratio | 70100 | 140 | – | – | 170210 |
| CI M / 1010 M⊙ | – | 2.50.3 | – | 7.30.4 | 4.10.7 |
| / M⊙ (K kms-1 pc2)-1 | – | 0.7 | – | 4.6 | 1.6 |
| / 10-5 | – | 2.8 | – | 18.3 | 5.16.1 |
5 Conclusions
We have presented JVLA and ALMA observations of the CO(1-0), CO(7-6) and CI(2-1) molecular lines as well as the far-infrared to radio continuum in three heavily reddened quasars and their associated companion galaxies at . Combining these observations with our previous observations of CO(3-2) emission allows us to study in detail the properties of the interstellar medium and the gas excitation conditions. We find that our quasar host galaxies as well as their companion galaxies have ISM properties consistent with the presence of high-density, high-temperature gas that is already highly enriched in elements like carbon. We detect CI(2-1) emission tracing low-density, diffuse gas in several of our galaxies and compare this to the CO(7-6) line luminosities, which trace dense, more highly excited gas. In general the CO(7-6) and CI(2-1) line luminosities are comparable. The CO spectral line energy distributions even in this small sample span the full range in gas excitation conditions from luminous starburst galaxies to the brightest quasars.
One of our quasar host galaxies (ULASJ2315) is spatially resolved into a close-separation (2) major merger and we present some evidence that the gas excitation conditions vary significantly between the two galaxies. Many previous studies have used low angular resolution observations of similar systems to infer the average line ratios and excitation conditions in high-redshift galaxies and we therefore caution that such results could be biased by potentially averaging over multiple merging components with different properties.
We derive gas masses for our galaxies in three different ways - (i) using CO emission (ii) using dust emission and (iii) using CI emission. We demonstrate that for standard assumptions for the CO-to-H2 conversion factor, gas-to-dust ratio and atomic carbon abundance, these estimates sometimes do not agree. The differences in the gas-mass estimates could indicate a range of values, or, alternatively, high gas-to-dust ratios and enhanced atomic carbon abundances.
In general, our investigations highlight the diversity in the dust and gas distributions and ISM properties of high-redshift quasar host galaxies and their companion starburst galaxies at the main epoch of galaxy formation. With ALMA now opening up the window on high angular resolution observations of dust and gas at high-redshifts, we can begin to move from inferring globally averaged properties to understanding spatial variations in the ISM properties in these complex, merging systems.
Acknowledgements
We thank the anonymous referee for their careful reading and useful comments on the paper. We thank Matt Bothwell and Stefano Carniani for useful discussions. MB acknowledges funding from the UK Science and Technology Facilities Council (STFC) via an Ernest Rutherford Fellowship and from the Royal Society via a University Research Fellowship. GCJ acknowledges support from NRAO through the Grote Reber Doctoral Fellowship Program. PCH acknowledges funding from STFC via the Institute of Astronomy, Cambridge, Consolidated Grant.
This paper makes use of the following ALMA data: ADS/JAO.ALMA#2016.1.01308.S. ALMA is a partnership of ESO (representing its member states), NSF (USA) and NINS (Japan), together with NRC (Canada), NSC and ASIAA (Taiwan), and KASI (Republic of Korea), in cooperation with the Republic of Chile. The Joint ALMA Observatory is operated by ESO, AUI/NRAO and NAOJ.
The National Radio Astronomy Observatory is a facility of the National Science Foundation operated under cooperative agreement by Associated Universities, Inc.