Estimating Carotid Pulse and Breathing Rate from Near-infrared Video of the Neck
Abstract
Objective: Non-contact physiological measurement is a growing research area that allows capturing vital signs such as heart rate (HR) and breathing rate (BR) comfortably and unobtrusively with remote devices. However, most of the approaches work only in bright environments in which subtle photoplethysmographic and ballistocardiographic signals can be easily analyzed and/or require expensive and custom hardware to perform the measurements.
Approach: This work introduces a low-cost method to measure subtle motions associated with the carotid pulse and breathing movement from the neck using near-infrared (NIR) video imaging. A skin reflection model of the neck was established to provide a theoretical foundation for the method. In particular, the method relies on template matching for neck detection, Principal Component Analysis for feature extraction, and Hidden Markov Models for data smoothing.
Main Results: We compared the estimated HR and BR measures with ones provided by an FDA-cleared device in a 12-participant laboratory study: the estimates achieved a mean absolute error of 0.36 beats per minute and 0.24 breaths per minute under both bright and dark lighting.
Significance: This work advances the possibilities of non-contact physiological measurement in real-life conditions in which environmental illumination is limited and in which the face of the person is not readily available or needs to be protected. Due to the increasing availability of NIR imaging devices, the described methods are readily scalable.
1 Introduction
Measuring physiological signals such as heart rate and breathing rate is critical for early diagnosis of chronic cardiovascular and respiratory diseases as well as their long-term monitoring. However, some of the most frequently used devices require attaching irritating electrodes on the skin and/or adding cumbersome straps around the torso. In addition, some of these devices have wires and require maintenance (e.g., replacing electrodes, charging batteries) which limit their use in daily life monitoring and often lead to high attrition rates. Moreover, these devices are not appropriate for certain settings in which the skin is too sensitive (e.g., neonates, burn patients) or in which a high level of unobtrusiveness is desired (e.g., sleep monitoring).
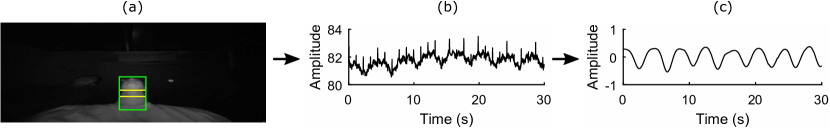
To help minimize the previous challenges, researchers have explored measurement methods that can capture physiological signals remotely and without any skin contact. Some of the most commonly used methods include but are not limited to thermal imaging of faces [10, 9, 6], wireless/radar signals bouncing on torsos [1], and RGB videos of faces in bright conditions [26, 2]. In contrast, this work uses low-cost NIR imaging devices to track subtle carotid pulse and breathing movements from the neck (see Fig. 1). Due to the increasing popularity of such devices, we believe this configuration complements previously explored methods and allows expanding the sensing opportunities to other real-life scenarios. In particular, we believe the proposed approach offers a good alternative in settings in which face-facing cameras may not be possible (e.g., monitoring drivers), the face of the person may want to be protected (e.g., workplace monitoring), and/or the illumination of the environment may be too dynamic or absent (e.g., sleep monitoring).
The work is organized as follows. First, we describe relevant previous work in the context of non-contact physiological measurement. Second, we establish a skin reflection model of the neck and derive how the physiological signals can be separated from the other motion sources. Third, we describe the apparatus and experimental setup used in this work. Fourth, we describe the proposed methods to estimate HR and BR from NIR video. Fifth, we describe the results and discuss the main findings. Finally, we provide some concluding remarks and lines of future work.
2 Previous Work
Non-contact physiological measurement methods have significantly advanced during recent years. For instance, physiological parameters such as HR and BR have been accurately extracted from RGB facial videos in which subtle color changes of the skin caused by blood circulation can be amplified and analyzed [29, 22, 21, 7, 28, 30]. Similar metrics have also been extracted by analyzing subtle face motions associated with the blood ejection into the vessels (a.k.a., ballistocardiography) [2] as well as more prominent chest volume changes during breathing [27, 20, 14]. Most of the previous studies leverage pervasive RGB cameras such as webcams that require a bright environment to work well [33]. However, this requirement may not be possible in many real-life scenarios such as sleep monitoring, dark office spaces, and night surveillance.
To help address this problem, researchers have explored the use of other sensing modalities. For instance, microwave Doppler radar and thermal imaging have been used for non-contact HR and BR measurements [13, 10, 9, 6], and laser Doppler vibrometry has been used to remotely track the carotid pulse [23]. However, measuring these modalities usually requires expensive and custom hardware which is not readily available. A less expensive alternative involves using NIR video monitoring which has recently grown in popularity with the increasing interest in motion sensing and its potential uses in virtual and augmented reality (e.g., Intel RealSense, Leap Motion). Using this modality111Here the modality refers specifically to raw NIR imaging. There are also methods estimating depth maps in NIR for physiological sensing [34, 35], but they rely on structured light sources or time-of-flight sensors associated with extra cost and complexity., researchers have analyzed videos of torsos to diagnose obstructive sleep apnea [5], and have observed pulsatile signals associated with arterial and breathing activity on the arm and the lower leg [25, 32]. However, none of these previous methods directly estimated and evaluated physiological metrics from NIR frames. One exception is the works of van Gastel et al., which considered NIR face videos to estimate HR and BR [11, 12]. In their study, they observed that the relative photoplethysmographic amplitude was significantly reduced in NIR compared to visible light and, therefore, they needed to use three NIR wavelengths (hence three NIR cameras with different optical filters) to appropriately separate pulse-induced intensity variations from motion artifact. Similarly, our work also considers NIR video to estimate HR and BR. Instead of focusing on the face or the torso areas, we focus on the neck which may be more convenient in certain experimental conditions in which front facing cameras are not feasible. In addition, we focus on subtle cardiorespiratory motions instead of photoplethysmographic changes which allow us to rely on a single NIR wavelength.
3 Skin Reflection Model of the Neck
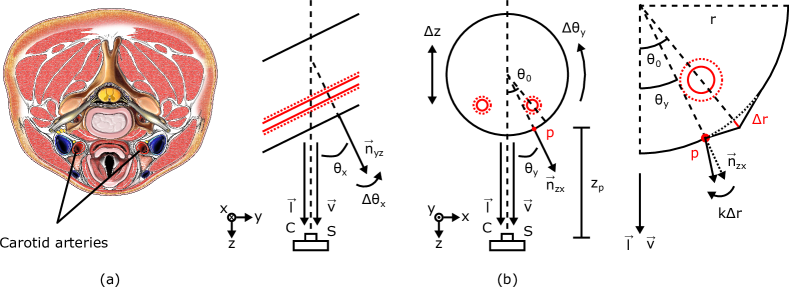
Fig. 2 (a) shows a cross section of the neck and the location of the carotid arteries which can be simplified to a cylindrical model (Fig. 2 (b)). With each cardiac cycle, the heart pumps blood to the periphery, and causes palpable pulsatile changes in the carotid arterial diameter, reflected as subtle skin deformations along the two sides of the neck. To model these deformations in video and its relationship with lighting, we adopted the Blinn-Phong reflection model. Compared with other models commonly used for modeling skin reflection such as the Lambert-Beer law and Shafer’s dichromatic reflection model, the Blinn-Phong reflection model is better at illustrating geometric relationships.
Assuming a surface point on the neck illuminated by a single NIR light source , its illumination captured by a NIR camera can be expressed as
| (1) |
It consists of four terms:
-
1.
is the ambient light intensity, which is the result of multiple reflections from walls and objects. is the ambient component of the light source, and is the ambient reflection coefficient. The whole term is usually considered to be constant for a particular object and uniform at every point.
-
2.
is the diffuse reflection intensity, associated with the absorption and scattering of the light in skin-tissues. is the intensity of the light source after distance attenuation. is the diffuse reflection coefficient, which depends on the nature of the material (skin) and the wavelength of the incident light. In theory, there is a pulsatile component in similar to photoplethysmography due to the variations of hemoglobin absorption. However, in NIR hemoglobin absorption of the skin is one order of magnitude smaller than dermal scattering and two orders of magnitude smaller than melanin absorption [18], causing the component to be much weaker than in visible light [11]. Thus we assume to be a constant. is the direction vector from point toward the light source. is the surface normal at .
-
3.
is the specular reflection intensity, which is a mirror-like light reflection from the skin surface. is the specular reflection coefficient, usually taken to be a material-dependent constant. is the halfway vector defined as , in which is the direction vector from point toward the camera. As we assume is a distant light source at the same location as , . is the shininess coefficient controlling the strength of specular highlight.
-
4.
is the quantization noise of the camera sensor.
The movement of the neck involves rigid motions and non-rigid motions. Assuming a Cartesian coordinate system with its -axis parallel to and its -axis perpendicular to the neck cross section, the rigid motions will include translations along three axes , and , and rotations around the axes , and . Due to the assumption of a distant light source, , and , which are orthogonal to , will have no influence on . With interferences like talking and eating avoided, the skin deformation caused by carotid pulse will be the only non-rigid motion.
Next, we elaborate on how the motions , , and influence the illumination of the neck point . First, the relationship between the light intensity and the camera distance obeys the inverse-square law:
| (2) |
in which is the light source intensity before distance attenuation, is the distance of point to the camera, and , and are constants. To simplify the notation, assume . Since , we can rewrite (2) as
| (3) |
Second, the strengths of both the diffuse reflection and the specular reflection are dependent on the direction of the surface normal . In Fig. 2 (b), is the projection of in the z-x plane, and is the projection of in the y-z plane. Assuming to be the angle between and the axis, and to be the angle between and the axis, we can get
| (4) |
Both and can be separated into a stationary part and a varying part:
| (5) |
| (6) |
in which is a constant, is affected by the rigid rotation around the -axis, and is affected by the rigid rotation around the -axis and the non-rigid deformation (only when the point is close enough to the carotid arteries). To simplify the notations, assume so that (4) can be rewritten as
| (7) |
Finally, by substituting (3) and (7) into (1), becomes
In (8), the camera quantization error can be attenuated by spatially downsampling the video frames, and the product of the small varying terms can be neglected. Then we reach the final expression of
which is approximately a linear combination of the distance change between the neck point and the camera, the anterior-posterior rotation of the neck (e.g. nodding), the neck rotation around the cervical spine, and the skin deformation caused by the carotid pulse.
Among the four motion sources, is usually much stronger than the others, so simply calculating the common average reference of among all neck points will provide an estimate of :
| (10) |
Most human actions can affect . When there is no other large motion, will be dominated by breathing movements, and sometimes also contain a weak ballistocardiography signal. The breathing signal and the pulse-induced ballistocardiography signal can be further separated in the frequency domain.
To extract the carotid pulse deformation from , the strong needs to be attenuated. Since is a global translation homogeneous on almost all neck points whereas only exists on points satisfying , calculating will diminish while preserving . In the remaining signals, is uncorrelated with the other motion sources and , so we can use Principal Component Analysis (PCA) [15] to separate it. In the PCA transformed domain, the first three principal components of with the highest variances will correspond to , and , but their order is not guaranteed.
In brief, the breathing movement can be estimated from , while the pulse signal can be selected from (when ballistocardiography exists in it) and the first three principal components of .
4 Apparatus
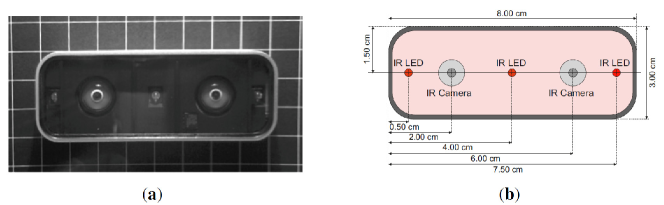
A large variety of NIR imaging devices are available in the market. This work uses the Leap Motion controller, which is a computer hardware sensor device that supports non-contact hand and finger interactions, analogous to a mouse. Using two monochromatic infrared cameras and three infrared LEDs (Fig. 3), the device observes a roughly hemispherical area, to a distance of about 1 m. The LEDs generate NIR light at a wavelength of 850 nanometers, and the cameras capture frames in 8 bits with a pixel resolution of 640 x 240, which are sent through a USB cable to the host computer at a floating frame rate around 62 frames per second (fps) and stored with timestamps. The recording program was written in Python using the Leap Motion SDK, while all the data analysis was done in MATLAB R2015b (MathWorks, Inc., Natick, MA, USA). To make the proposed methods transferable to devices with a single NIR camera, only the frames from one camera were used.
5 Experimental Protocol
Twelve participants (8 males, 4 females) between the ages of 23-34 years were recruited for this study, which was pre-approved by the Massachusetts Institute of Technology review board. The participant sample covers both genders, different ages, and varying skin colors (Asians, Africans and Caucasians). Informed consent was obtained from all the participants prior to each study session.
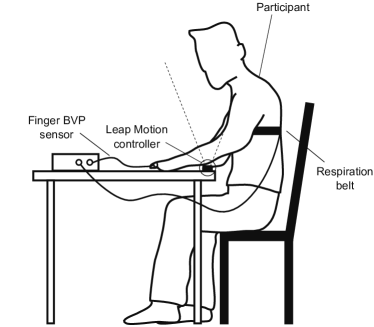
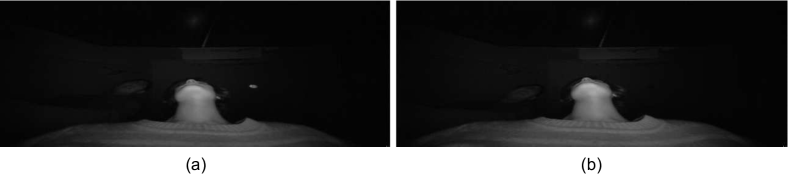
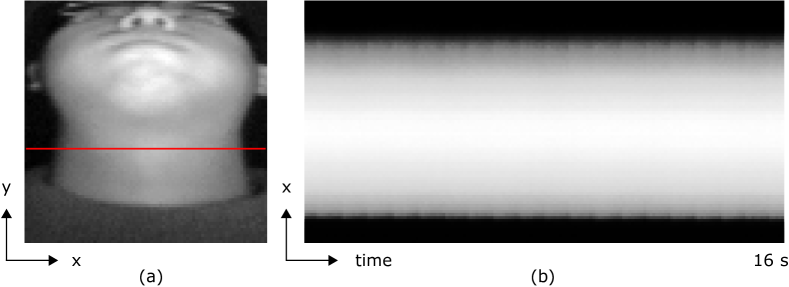
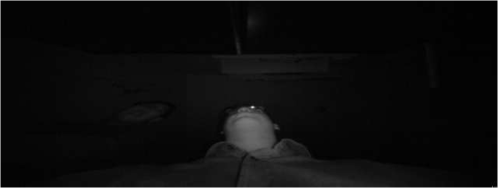
In each experiment, participants were seated at a desk naturally (Fig. 4). The Leap Motion controller was placed on the edge of the desk, parallel with it, and facing upward. Due to different heights and postures of participants, the distance between the controller cameras and the neck of participants varied. Gold standard physiological measurements were obtained with an FDA-cleared sensor (FlexComp Infiniti by Thought Technologies Ltd.) that simultaneously recorded Blood Volume Pulse (BVP) from a finger probe and breathing waveform (BW) from a chest belt at a constant sampling frequency of 256 Hz. The sensor data were synchronized with the NIR frames via timestamps. Every experiment consists of two phases. In the first phase, the room was bright (184 lux at the camera place), while in the second phase all the lights were turned off to make the room fully dark (1 lux at the camera place). Participants were asked to breathe spontaneously and avoid major movement for 1 min during each of the phases. Fig. 5 shows that there is no visible difference in image brightness and quality between infrared frames captured in a bright room and a fully dark room by the NIR cameras.
6 Heart Rate Estimation
This section describes the extraction of heart rate from carotid pulse movements which is depicted in Fig. 6.
6.1 Region-of-interest Detection

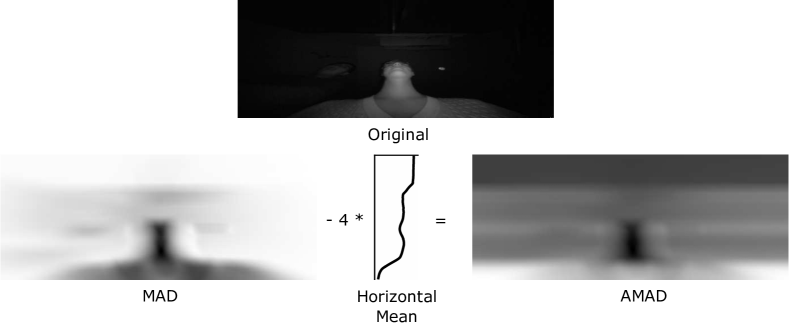
The neck area (a rectangular area including the neck) was automatically located in every NIR video using template matching [4]. In particular, a template (Fig. 7) was created by manually cropping neck areas from 48 static infrared photos of the 12 participants with various postures and lighting conditions, resizing them to the same size (81 by 19 pixels) and taking the average of them. For each video, the template matching algorithm slides the template image over the first frame, and compares the template and patch of the frame by calculating an adjusted mean of absolute differences (AMAD). As shown in Fig. 8, a mean of absolute differences (MAD) metric averages the absolute values of the differences between pixels in the original frame and the corresponding pixels in the template image. To enhance the contrast between the neck and the other body parts, the geometric feature of the neck was exploited. Since in a MAD map the neck is always horizontally the slimmest part compared with the head and the torso, the horizontal mean was calculated and subtracted from every column of the map after multiplication with a factor of 4 (chosen heuristically to balance the neck-torso contrast against the neck-background contrast) to generate the AMAD map:
| (11) |
| (12) |
in which , is the search image with a dimension of , and is the template with a dimension of ( and ).
As described in the experimental setup, there was no restriction on the distance between the camera and the neck of a participant, which caused the sizes of the necks to vary in videos. To make the neck detection more scale-robust, the template was resized by a scale of 0.8 (based on the smallest neck area we observed among the static photos), and AMAD maps were computed twice using both the original template and the resized one. Finally, the lowest AMAD score among the two maps indicated the optimal size of the template and its best position within the frame. The size and the position were then applied to all the frames of the video for neck segmentation.
6.2 Spatial Denoising
To reduce random noise produced by the camera and the sensor circuits, the neck area segmented in every frame was downsampled to half of its size using bicubic interpolation, which helps reduce the computational cost of subsequent operations.
6.3 Frequency Denoising
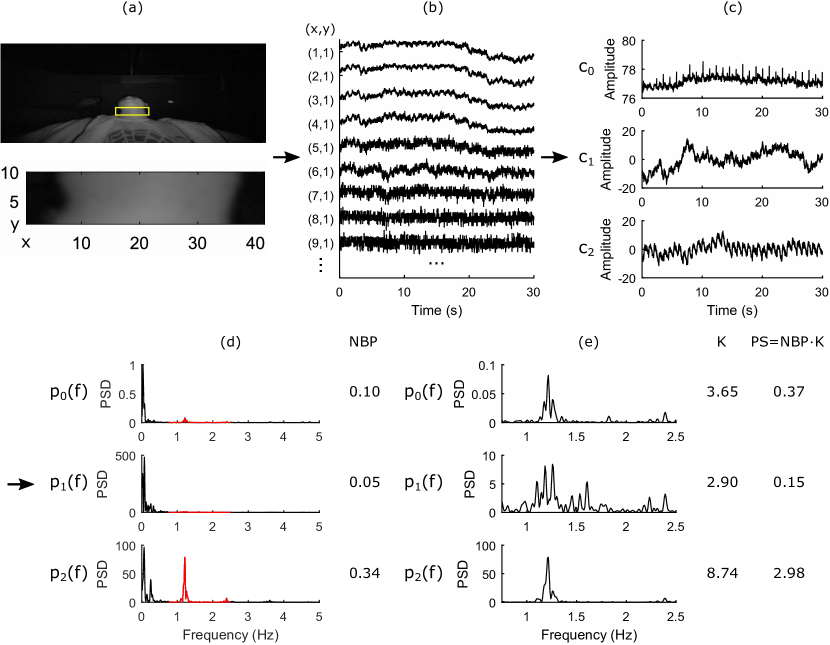
The intensity change of every pixel within the downsampled neck area formed a 1-min time series, which can be considered as a channel of sensor recording. However, a single channel usually exhibited a mixture of the carotid pulse vibration, breathing movement and motion artifacts. To separate the different signals, we used PCA to combine all the channels (all the pixels within the neck area) and convert these correlated time series into a set of linearly uncorrelated components. The component corresponding to the pulse signal was then automatically selected from them based on features in the frequency domain. The procedure is illustrated in Fig. 6 with details given below:
-
1.
A moving window of 30 s in length with overlap (1 s increment) was applied to every 1-min time series.
-
2.
Within each window, a common average reference (CAR) montage was performed by subtracting to each channel the average of all channels. The common average related to the global movement of the neck was saved as a component candidate , which was dominated by breathing movement in most cases but sometimes also showed weak ballistocardiography.
-
3.
PCA was applied on all the channels with the common average removed to return principal component scores in descending order of component variance. According to observation on the three scores with the highest variances, the first component was usually associated with motion artifacts, and the carotid pulse was visible in the second, the third or both depending on the posture of the participant and the distance between the camera and the neck. Therefore, the second and the third principal components were saved as component candidates and .
-
4.
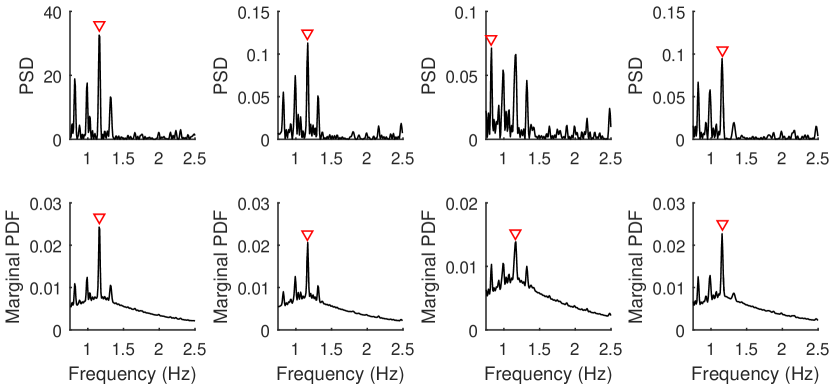
To select the component best representing the pulse, the power spectral density (PSD) estimates , and , ( is the Nyquist frequency), were computed from , and using the Lomb-Scargle method [17, 24], which is good at finding weak periodic signals in otherwise random unevenly sampled data. The method was chosen over other PSD estimation methods, mainly because the Leap Motion controller captures NIR video at a non-constant sampling rate.
-
5.
A single distinct peak in the PSD estimate represents a well-detected HR. However, with the existence of noise, a HR peak might be in company with other peaks and may not be significantly higher and/or sharper. To evaluate the distinction of cardiac pulse in a PSD estimate, a measure called pulse significance (PS) was invented by combining two metrics, the normalized band power (NBP) and the kurtosis. The NBP reflects how high a HR peak is in a PSD estimate. It was calculated as the power within the prospective HR frequency band [0.75 Hz, 2.5 Hz] (corresponding to 45 and 150 beats per minute) divided by the full spectrum power:
(13) The kurtosis, also called the fourth standardized moment, indicates the primary peakedness and lack of shoulder in a distribution [8], which in our method measures how sharp a peak is within the HR frequency band. It was derived as
(14) (15) Finally, the NBP and the kurtosis were multiplied with each other to get the pulse significance:
(16) The component among , and whose PSD estimate had the largest PS was selected for HR extraction, and denoted as .
6.4 Temporal Denoising
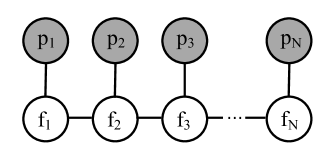
After the optimal component corresponding to the carotid pulse was selected, the HR could be easily read from its PSD estimate by locating the highest peak within the HR frequency band. However, sometimes the motion artifact was so strong that the HR reading of a window significantly deviated from its neighbors, which violated the continuity of the human heart rate. To address the problem, we designed a Hidden Markov Model (HMM, Fig. 9) to smooth readings in consecutive windows and used belief propagation to infer the HR. Each pair of gray and white nodes in the Markov chain corresponded to a time window. The gray nodes were observed PSD estimates, and the white nodes were the heart rates we wished to infer. Each window was connected to only its neighbors, and favored a smooth HR variance. Mathematically, we can write this chain with the probability density function (PDF):
| (17) |
where is the HR frequency of window i, which we wished to infer given . is a normalization factor to guarantee the integral of the PDF equals 1. is known as the data term and is know as the smoothness terms. We defined them to be:
| (18) |
| (19) |
in which the parameter allows control over the relative strength of the data term versus the smoothness term. We used in this study to match the normal variation of physiological parameters under resting state. In use cases where the HR can change more abruptly, should be increased.
Belief propagation was used to obtain the maximum a posteriori (MAP) estimation of the possible HR frequencies by passing messages left-to-right in the chain. The message update equation is
| (20) |
where the expression is all the neighbors of node except node . Finally, in the marginal distribution of each window, the HR was read by finding the maximum. Fig. 10 shows an example of how HMM smoothing corrects a deviated HR data point.
7 Breathing Rate Estimation
This section describes the extraction of breathing rate from movements of the neck which is depicted in Fig. 11.
7.1 Region-of-interest Detection
While the carotid pulse is reflected as local motions on the two sides of the neck, the breathing activity is associated with the global movement of the neck and the torso. To extract the BR, the same neck detection algorithm we used in HR measurement was applied. However, the region-of-interest was expanded to 5 times its height (twice above and twice below) to cover a complete neck area as well as the chin and a small part of the upper chest.
7.2 Spatial Denoising
To improve the signal-to-noise ratio (SNR), the intensities of all pixels within the region-of-interest (ROI) were averaged in every frame to form a single 1-min time series for each video. The same moving window (30 s in length and 1 s in increment) used for HR measurement was employed on the series.
7.3 Frequency Denoising
After spatial averaging, most local motions like the carotid pulse are neutralized, but some global motion artifacts might still exist. To remove noise, a 3rd order band-pass Butterworth filter with cut-off frequencies of 0.08 and 0.5 Hz (corresponding to 4.8 and 30 breaths per minute) was applied to each windowed signal. To maintain synchrony with the gold standard data, zero-phase filtering was performed by processing the signal in both the forward and reverse directions [19].
7.4 Temporal Denoising
The Lomb-Scargle method was used again to obtain the PSD estimate of the filtered signal. The same Hidden Markov Model as in Fig. 9 was applied to consecutive windows of PSD estimates, and BR was selected to be the frequency where the marginal distribution achieved the maximum in every window.
8 Results
This section describes the performance obtained for heart rate and breathing rate estimation from the neck when compared with an FDA-cleared device.
8.1 Heart Rate
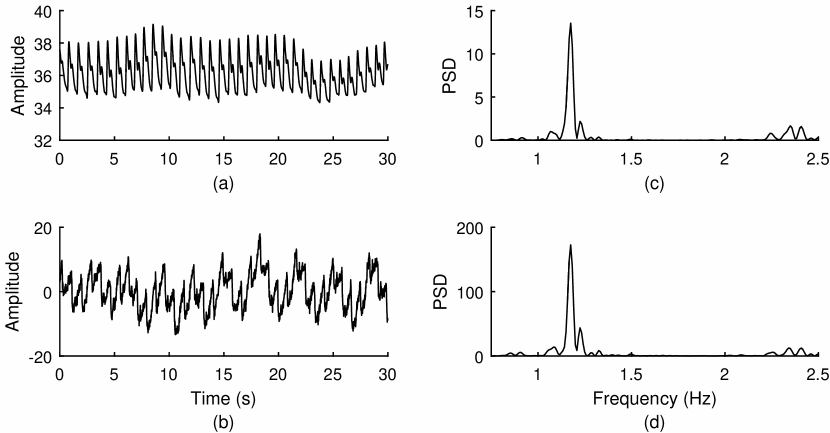
The time series and frequency spectra of the cardiac pulse measured by our proposed methodology and the reference device are compared in an exemplary window in Fig. 12. Though the time series shares the same periodicity, its wave patterns in each period look different. On one hand, this is because the carotid pulse observed over the skin surface can not faithfully reflect the blood volume changes inside the subjacent arteries. On the other hand, the reference BVP exhibits more details because of its higher sampling rate (256 Hz) compared with the NIR camera (around 62 Hz). Nevertheless, in the frequency domain within the prospective HR frequency band [0.75 Hz, 2.5 Hz], the periodograms of the two pulse signals look very similar to each other, including both the fundamental tone (around 1.17 Hz) and the 2nd harmonic (around 2.34 Hz) of the HR.
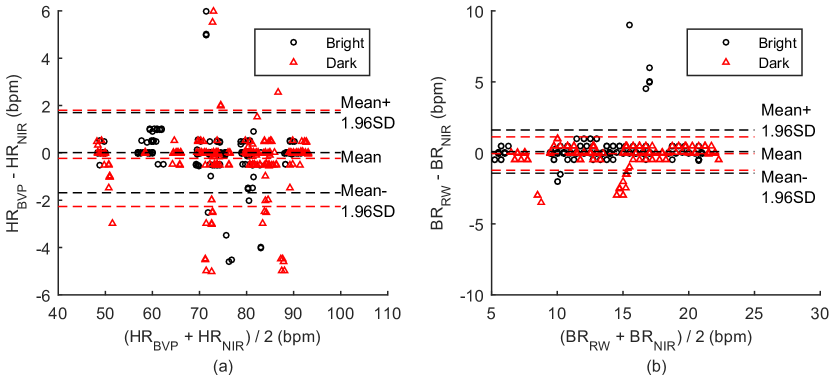
The agreement between the 744 pairs of HR measurements from 12 participants was tested by Bland-Altman analysis [3]. According to Fig. 13 (a), our HR measurements ranged from 48.5 bpm to 93.0 bpm, which almost cover the normal resting adult HR range 60-100 bpm. No trend of increased measurement error can be observed from both low and high ends of the range. With measurements under bright and dark conditions analyzed separately, their Bland-Altman plots, superimposed in the same figure, have similar distributions.
Table 1 summarizes the descriptive statistics for comparing the proposed methodology with the gold standard. The overall mean absolute error (MAE) between them was 0.36 bpm, which proved the high accuracy of our technique. To verify the robustness of our NIR-based method under different lighting environments, a paired t-test was conducted to compare the absolute errors of HR measurements in bright and dark conditions. No significant differences were found in terms of error during bright (M = 0.31, SD = 0.81) and dark (M = 0.41, SD = 0.98) conditions; t(371) = -1.572, p = 0.117.
| Statistic | Overall | Bright | Dark |
|---|---|---|---|
| No. of measurement pairs | 744 | 372 | 372 |
| Mean absolute error (bpm) | 0.36 | 0.31 | 0.41 |
| Mean error (bpm) | -0.11 | 0.01 | -0.23 |
| SD of error (bpm) | 0.96 | 0.86 | 1.04 |
| Root-mean-square error | 0.97 | 0.86 | 1.06 |
| Correlation coefficient | 1.00 | 1.00 | 1.00 |
| Statistic | Overall | Bright | Dark |
|---|---|---|---|
| No. of measurement pairs | 744 | 372 | 372 |
| Mean absolute error (bpm) | 0.24 | 0.22 | 0.26 |
| Mean error (bpm) | 0.02 | 0.09 | -0.05 |
| SD of error (bpm) | 0.70 | 0.77 | 0.60 |
| Root-mean-square error | 0.70 | 0.78 | 0.60 |
| Correlation coefficient | 0.99 | 0.98 | 0.99 |
8.2 Breathing Rate
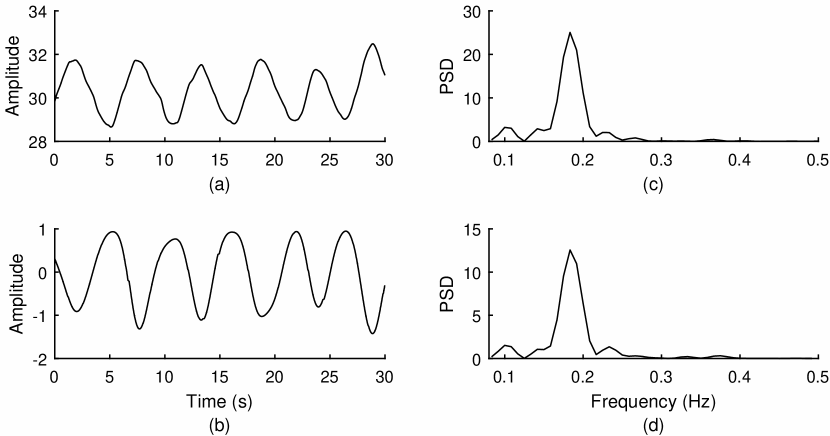
Within a 30-second window, we plotted the time series and frequency spectra of the breathing movement measured by our proposed methodology and the reference device for comparison (Fig. 14). Both the pair of time series and the pair of periodograms within the prospective BR frequency band [0.08 Hz, 0.5 Hz] show high similarity in shape, though the two time series have opposite phases.
A Bland-Altman plot was drawn for all BR measurement pairs in Fig. 13 (b). The measurements covered a BR range between 5.0 and 22.0 breaths per minute, where our method manifested high accuracy consistently except only a few outliers due to severe motion artifacts. The figure marks data points under two different lighting conditions differently, of which both the means and the standard deviations (SD) are alike.
The quantitative statistics for comparing the proposed methodology with the gold standard are listed in Table 2. The overall MAE of BR between the two methods was 0.24 bpm, even smaller than the same statistic for HR. To verify the robustness of our NIR-based method under different lighting environments, a paired t-test was conducted to compare the absolute errors of BR measurements in bright and dark conditions. Similarly to HR, no significant difference was found in terms of error during bright (M = 0.22, SD = 0.75) and dark (M = 0.26, SD = 0.54) conditions; t(371) = -0.936, p = 0.350.
| Participant | Gender | ROI size | |||||
| 1 (Bright) | M | 81x19 | 0.02 | 1.15 | |||
| 1 (Dark) | M | 81x19 | 0.09 | 0.13 | |||
| 2 (Bright) | F | 65x16 | 1.36 | 0.11 | |||
| 2 (Dark) | F | 65x16 | 2.01 | 0.52 | |||
| 3 (Bright) | M | 65x16 | 0.07 | 0.02 | |||
| 3 (Dark) | M | 65x16 | 0.37 | 0.08 | |||
| 4 (Bright) | F | 81x19 | 0.65 | 0.59 | |||
| 4 (Dark) | F | 81x19 | 0.09 | 0.39 | |||
| 5 (Bright) | M | 65x16 | 0.06 | 0.10 | |||
| 5 (Dark) | M | 65x16 | 0.50 | 0.05 | |||
| 6 (Bright) | F | 65x16 | 0.44 | 0.07 | |||
| 6 (Dark) | F | 65x16 | 1.41 | 1.05 | |||
| 7 (Bright) | M | 81x19 | 0.11 | 0.03 | |||
| 7 (Dark) | M | 81x19 | 0.12 | 0.18 | |||
| 8 (Bright) | M | 81x19 | 0.03 | 0.08 | |||
| 8 (Dark) | M | 81x19 | 0.09 | 0.15 | |||
| 9 (Bright) | M | 81x19 | 0.04 | 0.04 | |||
| 9 (Dark) | M | 81x19 | 0.01 | 0.13 | |||
| 10 (Bright) | M | 81x19 | 0.14 | 0.03 | |||
| 10 (Dark) | M | 81x19 | 0.07 | 0.02 | |||
| 11 (Bright) | F | 81x19 | 0.24 | 0.25 | |||
| 11 (Dark) | F | 81x19 | 0.06 | 0.20 | |||
| 12 (Bright) | M | 81x19 | 0.54 | 0.15 | |||
| 12 (Dark) | M | 81x19 | 0.10 | 0.26 | |||
| r with | 0.59 | -0.58 | 0.21 | 0.09 | -0.28 | ||
| p-value | 0.003 | 0.003 | 0.322 | 0.689 | 0.180 | ||
| r with | 0.37 | -0.02 | |||||
| p-value | 0.070 | 0.922 |
-
aROI: region-of-interest, MAE: mean absolute error, HR: heart rate, BR: breathing rate, M: male, F: female.
9 Discussion
This work demonstrates that low-cost NIR imaging devices can be used to provide accurate heart rate and breathing rate estimations from neck motions in well-lit and dark settings. While the results are encouraging for the data we collected, there are several factors that need to be considered when assessing the generalization of our findings.
Table 3 shows a significant positive point-biserial correlation between gender and values (), leading to lower accuracy for female participants. This difference may be partly due to the smaller size of carotid arteries of females [16] which causes the carotid pulse to be subtler too. Table 3 also shows a significant negative point-biserial correlation between the ROI sizes and their values (), leading to lower accuracy for smaller ROI sizes. This difference was partly due to the different heights and/or tendency for some people to naturally bury their heads when working at their desk. In contrast, no significant correlations were observed when considering the relationship between values and gender () and ROI size (). These findings are partly to be expected as breathing movement has no gender-related distinctions, and the ROI size for BR was five times larger than the size of the ROI size for HR, making BR accuracy less sensitive to the variation of pixel numbers. Finally, no significant correlations were observed when considering the selected Principal Components (i.e., , , and ) and the .
An obvious limiting factor of our proposed methodology is neck occlusions. While we do not expect our methods to work when the neck is not visible or fully covered (e.g., when wearing a scarf), our dataset contains several instances of partial neck occlusions. In particular, participants 3, 5 and 7 wore high collar shirts (e.g., Fig. 15), and participant 12 wore a turtleneck sweater. As shown in Table 3, the maximum MAE values for these participants were 0.54 beats per minute and 0.26 breaths per minute, which demonstrates the effectiveness of the methods even with partial neck occlusions.
Finally, our study considered stationary conditions in which participants remained relatively still for few seconds. In particular, our approach makes two assumptions: 1) the rigid motions of the neck are small enough so that the approximation in (9) will hold, and 2) the non-rigid motions are mainly due to the skin deformation caused by carotid pulse. While these assumptions may not hold in certain real-life scenarios (e.g., talking, eating), more robust approaches can be considered to capture and compensate those motion sources. Similarly, our study showed promising results in a pool of 12 healthy individuals. While the performance was fairly consistent across participants, more studies will need to be performed including a larger and more varied pool of participants (e.g., unhealthy individuals, children, elderly people).
10 Conclusion
We have described, implemented and evaluated a novel methodology for measuring HR and BR from NIR video recordings of the human neck, and demonstrated its accuracy under different lighting conditions. While this paper only addressed the recovery of HR and BR, other physiological parameters such as heart rate variability (HRV) could be captured using a similar methodology. As more and more devices with NIR cameras become available, this technology offers new opportunities to provide comfortable physiological measurements and long-term health monitoring.
Acknowledgements
This work is supported by the MIT Media Lab Consortium and the SDSC Global Foundation, Inc.
References
- [1] Fadel Adib et al. “Smart Homes that Monitor Breathing and Heart Rate” In Proceedings of the 33rd Annual ACM Conference on Human Factors in Computing Systems - CHI ’15, 2015, pp. 837–846 DOI: 10.1145/2702123.2702200
- [2] Guha Balakrishnan, Fredo Durand and John Guttag “Detecting pulse from head motions in video” In Proceedings of the IEEE Computer Society Conference on Computer Vision and Pattern Recognition, 2013, pp. 3430–3437 DOI: 10.1109/CVPR.2013.440
- [3] J Martin Bland and DouglasG Altman “Statistical methods for assessing agreement between two methods of clinical measurement” In The lancet 327.8476 Elsevier, 1986, pp. 307–310
- [4] Roberto Brunelli “Template matching techniques in computer vision: theory and practice” Wiley, 2009 DOI: 10.1002/9780470744055
- [5] Wei Wang Ching, Amr Ahmed and Andrew Hunter “Vision analysis in detecting abnormal breathing activity in application to diagnosis of obstructive sleep apnoea” In Proceedings of the Annual International Conference of the IEEE Engineering in Medicine and Biology, 2006, pp. 4469–4473 DOI: 10.1109/IEMBS.2006.260648
- [6] Hui Sup Cho, Young Jin Park, Hong Kun Lyu and Jin Ho Cho “Novel Heart Rate Detection Method Using UWB Impulse Radar” In Journal of Signal Processing Systems 87.2 Journal of Signal Processing Systems, 2017, pp. 229–239 DOI: 10.1007/s11265-016-1177-7
- [7] Gerard De Haan and Vincent Jeanne “Robust pulse rate from chrominance-based rPPG” In IEEE Transactions on Biomedical Engineering 60.10, 2013, pp. 2878–2886 DOI: 10.1109/TBME.2013.2266196
- [8] Lawrence T DeCarlo “On the meaning and use of kurtosis.” In Psychological methods 2.3 American Psychological Association, 1997, pp. 292
- [9] Jin Fei and Ioannis Pavlidis “Thermistor at a distance: unobtrusive measurement of breathing” In IEEE Transactions on Biomedical Engineering 57.4, 2010, pp. 988–998
- [10] Marc Garbey and Nanfei Sun “Contact-free measurement of cardiac pulse based on the analysis of thermal imagery” In IEEE Transactions on Biomedical Engineering 54.8, 2007, pp. 1418–1426
- [11] Mark Gastel, Sander Stuijk and Gerard Haan “Motion robust remote-PPG in infrared” In IEEE Transactions on Biomedical Engineering 62.5, 2015, pp. 1425–1433 DOI: 10.1109/TBME.2015.2390261
- [12] Mark Gastel, Sander Stuijk and Gerard Haan “Robust respiration detection from remote photoplethysmography” In Biomedical Optics Express 7.12, 2016, pp. 4941 DOI: 10.1364/BOE.7.004941
- [13] Eugene F Greneker III “Radar sensing of heartbeat and respiration at a distance with security applications” In Radar Sensor Technology II 3066, 1997, pp. 22–27
- [14] Rik Janssen, Wenjin Wang, Andreia Moço and Gerard Haan “Video-based respiration monitoring with automatic region of interest detection” In Physiological Measurement 37.1, 2016, pp. 100–114 DOI: 10.1088/0967-3334/37/1/100
- [15] Ian Jolliffe “Principal component analysis” Wiley Online Library, 2002
- [16] Jaroslaw Krejza et al. “Carotid artery diameter in men and women and the relation to body and neck size” In Stroke 37.4, 2006, pp. 1103–1105 DOI: 10.1161/01.STR.0000206440.48756.f7
- [17] Nicholas R Lomb “Least-squares frequency analysis of unequally spaced data” In Astrophysics and space science 39.2 Springer, 1976, pp. 447–462
- [18] Michael J. Mendenhall, Abel S. Nunez and Richard K. Martin “Human skin detection in the visible and near infrared” In Applied Optics 54.35, 2015, pp. 10559 DOI: 10.1364/AO.54.010559
- [19] Alan V Oppenheim, Ronald W Schafer and John R Buck “Discrete-time signal processing” Prentice-hall Englewood Cliffs, 1989
- [20] Philips “Philips vitals signs camera” In http://www.vitalsignscamera.com, 2011
- [21] Ming Zher Poh, Daniel J. McDuff and Rosalind W. Picard “Advancements in noncontact, multiparameter physiological measurements using a webcam” In IEEE Transactions on Biomedical Engineering 58.1, 2011, pp. 7–11 DOI: 10.1109/TBME.2010.2086456
- [22] Ming-Zher Poh, Daniel J McDuff and Rosalind W Picard “Non-contact, automated cardiac pulse measurements using video imaging and blind source separation” In Optics express 18.10 OSA, 2010, pp. 10762–10774 DOI: 10.1364/OE.18.010762
- [23] John W Rohrbaugh et al. “The physiology of threat : remote assessment using laser doppler vibrometry” In Journal of Credibility Assessment and Witness Psychology 7.2, 2006, pp. 135–145
- [24] J.. Scargle “Studies in astronomical time series analysis. II - Statistical aspects of spectral analysis of unevenly spaced data” In The Astrophysical Journal 263, 1982, pp. 835 DOI: 10.1086/160554
- [25] Olaf Such, Sabine Acker and Vladimir Blazek “Mapped hemondynamic data aquisition by near infrared CCD imaging” In 19th Annual International Conference of the IEEE Engineering in Medicine and Biology Society 637.C, 1997, pp. 637–639
- [26] Y Sun and N Thakor “Photoplethysmography revisited: from contact to noncontact, from point to imaging” In IEEE Transactions on Biomedical Engineering 63.3, 2016, pp. 463–477 DOI: 10.1109/TBME.2015.2476337
- [27] K.S. Tan, R. Saatchi, H. Elphick and D. Burke “Real-time vision based respiration monitoring system” In 7th International Symposium on Communication Systems Networks and Digital Signal Processing (CSNDSP), 2010, pp. 770–774 DOI: 10.1109/TBME.2005.869784
- [28] L Tarassenko et al. “Non-contact video-based vital sign monitoring using ambient light and auto-regressive models” In Physiological Measurement 35.5, 2014, pp. 807–831 DOI: 10.1088/0967-3334/35/5/807
- [29] Wim Verkruysse, Lars O Svaasand and J Stuart Nelson “Remote plethysmographic imaging using ambient light” In Optics express 16.26 Optical Society of America, 2008, pp. 21434–21445
- [30] Wenjin Wang, Albertus Den Brinker, Sander Stuijk and Gerard De Haan “Algorithmic Principles of Remote-PPG” In IEEE Transactions on Biomedical Engineering PP.99, 2016, pp. 1–12 DOI: 10.1109/TBME.2016.2609282
- [31] Frank Weichert, Daniel Bachmann, Bartholomäus Rudak and Denis Fisseler “Analysis of the accuracy and robustness of the Leap Motion Controller” In Sensors (Switzerland) 13.5, 2013, pp. 6380–6393 DOI: 10.3390/s130506380
- [32] F.. Wieringa, F. Mastik and A. W Van Der Steen “Contactless multiple wavelength photoplethysmographic imaging: a first step toward “SpO2 camera” technology” In Annals of Biomedical Engineering 33.8, 2005, pp. 1034–1041 DOI: 10.1007/s10439-005-5763-2
- [33] Hao-Yu Wu “Eulerian video processing and medical applications”, 2012
- [34] Junyi Xia and R. Siochi “A real-time respiratory motion monitoring system using KINECT: Proof of concept” In Medical Physics 39.5, 2012, pp. 2682–2685 DOI: 10.1118/1.4704644
- [35] Cheng Yang, Gene Cheung and Vladimir Stankovic “Estimating heart rate via depth video motion tracking” In Proceedings - IEEE International Conference on Multimedia and Expo 2015-Augus, 2015 DOI: 10.1109/ICME.2015.7177517