Superconducting and magnetic phase diagram of
RbEuFe4As4 and CsEuFe4As4 at high pressure
Abstract
The recently discovered (Rb,Cs)EuFe4As4 compounds exhibit an unusual combination of superconductivity () and ferromagnetism (). We have performed a series of x-ray diffraction, ac magnetic susceptibility, dc magnetization, and electrical resistivity measurements on both RbEuFe4As4 and CsEuFe4As4 to pressures as high as . We find that the superconductivity onset is suppressed monotonically by pressure while the magnetic transition is enhanced at initial rates of and for RbEuFe4As4 and CsEuFe4As4 respectively. Near , onset and become comparable. At higher pressures, signatures of bulk superconductivity gradually disappear. Room temperature x-ray diffraction measurements suggest the onset of a transition from tetragonal (T) to a half collapsed-tetragonal (hcT) phase at (RbEuFe4As4) and (CsEuFe4As4). The ability to tune and into coincidence with relatively modest pressures highlights (Rb,Cs)EuFe4As4 compounds as ideal systems to study the interplay of superconductivity and ferromagnetism.
I Introduction
The iron-based superconductors crystallize in several closely related crystal structures. The most recently discovered of these is the so-called “1144” structure type, which was reported for compounds with the formula Fe4As4, where = Ca or Sr and = K, Rb, or Cs Iyo et al. (2016). These structures can be viewed as an ordered stacking of Fe2As2 layers sandwiched between alternating layers of and . Unlike the closely related “122” compounds such as BaFe2As2, which require doping or pressure to exhibit high values, the stoichiometric 1144 compounds exhibit at ambient pressure. Subsequently, it was found that the same structure type forms when the alkaline earth element is replaced by the rare earth element Eu, resulting in RbEuFe4As4 and CsEuFe4As4 Kawashima et al. (2016); Liu et al. (2016a, b).
The Eu variants of the 1144 structure exhibit an unusual coexistence of superconductivity () and what is nominally ferromagnetism (). The large ordered moment of 6.5 per formula unit is consistent with magnetism deriving from Eu2+ ions Liu et al. (2016a). Mössbauer spectroscopy measurements confirm that the magnetism derives from Eu2+ moments (which orient perpendicular to the crystallographic -axis), and indicate that there is no magnetic order of Fe moments down to at least Albedah et al. (2018a, b). A recent pre-print concluded that the Eu magnetism is quasi-2D in nature with strong magnetic fluctuation effects Smylie et al. (2018). However, there are as yet no reports of e.g., neutron scattering measurements to establish the magnetic structure, so it is possible that the order is a more complicated modulated structure, rather than simple ferromagnetism Sinha et al. (1982); Burlet et al. (1986).
It is thought that superconductivity and magnetism are able to coexist in these compounds because of a weak coupling between the Eu planes and the FeAs planes. Weak coupling between superconductivity and the Eu magnetism is confirmed by the fact that nonmagnetic CaRbFe4As4 Iyo et al. (2016) exhibits nearly the same as RbEuFe4As4 and CsEuFe4As4. Furthermore, a study of the (Eu1-xCax)RbFe4As4 series found that while vanishes with increasing Ca concentration, remains essentially constant Kawashima et al. (2018). The observations described above place the (Rb,Cs)EuFe4As4 compounds in the class of local moment ferromagnetic superconductors such as ErRh4B4 Fertig et al. (1977) and HoxMo6S8 Ishikawa and Fischer (1977). However, these materials exhibit a destruction of the superconducting state at the onset of ferromagnetism, unlike in (Rb,Cs)EuFe4As4. In contrast, the uranium-based superconducting ferromagnets such as URhGe Aoki et al. (2001), UGe2 (under pressure) Saxena et al. (2000), and UCoGe Huy et al. (2007) show the onset of weak itinerant ferromagnetism at temperatures above the superconducting . We use the terminology ferromagnetic superconductor (FMS) to indicate and superconducting ferromagnet (SFM) to indicate .
Experiments aimed at tuning the superconducting and magnetic transitions via pressure, chemical substitution, and applied magnetic fields have played a central role in our understanding of magnetic superconductors Kakani and Upadhyaya (1988); Wolowiec et al. (2015). To date, there appear to be only two reports of chemical substitution experiments on (Rb,Cs)EuFe4As4 compounds. In addition to the Eu Ca, substitution study described above Kawashima et al. (2018), Liu et al. explored the effect of Ni substitution on the Fe site Liu et al. (2017). Increasing Ni concentration has little impact on the Eu magnetism, but produces the emergence of possible spin density wave order at 5% Ni, a crossover from FMS to SFM near 6.5% Ni, and finally the disappearance of superconductivity above 8% Ni. The rapid suppression of was attributed partly to the disorder induced by Ni substitution.
High pressure experiments have the potential to tune and without introducing intrinsic disorder. In this paper we report a series of high pressure measurements on polycrystalline samples of both RbEuFe4As4 and CsEuFe4As4. Using a combination of x-ray diffraction, dc magnetization, ac magnetic susceptibility, and electrical resistivity measurements, we have mapped the phase diagrams of both compounds to pressures as high as
II Experimental Methods
Polycrystalline samples of RbEuFe4As4 and CsEuFe4As4 were synthesized as previously reported Liu et al. (2016a, b). These samples were subjected to a variety of high pressure measurements, each using different diamond anvil cells (DAC). Pressure was determined via the fluorescence spectrum of small pieces of ruby located inside the sample chamber, near the sample Chijioke et al. (2005). For measurements at low temperature, the pressure was measured in situ at low temperature, thus avoiding potential errors in pressure determination due to the changes in pressure that typically occur on cooling from room to low temperature.
Angle-dispersive x-ray diffraction (XRD) experiments on RbEuFe4As4 and CsEuFe4As4 powder samples were carried out at beamline 13BM-C (PX∧2), Advanced Photon Source (APS), Argonne National Laboratory Zhang et al. (2017). The X-ray beam was monochromated with silicon (311) to () with bandwidth. A Kirkpatrick-Baez mirror system was used to focus the beam to (FWHM) at the sample position. The MAR165 Charge-Coupled Device (CCD) detector (Rayonix) was used to collect diffraction patterns. Powdered LaB6 was used to calibrate the distance and tilting of the detector.
For the diffraction measurements, high pressure was achieved in Mao-type symmetric DACs with c-BN seats to allow access to high diffraction angles. Two experimental runs were performed on CsEuFe4As4. In the first run, a pair of diamond anvils with culet were used up to . A Re gasket was pre-indented from initial thickness to . During the second run, a pair of diamond anvils with Re gasket thickness of were used to achieve pressures up to . A single experimental run was performed on the RbEuFe4As4 sample, using diamond anvils of culet up to . The Re gasket was pre-indented to and a hole of was EDM drilled. All XRD experiments were carried out at room temperature. The pressure is cross checked with solid Ne diffraction peaks above using the equation of state from Ref. Dewaele et al. (2008). A gas membrane pressure controller was used to adjust the pressure. In all the experiments, Ne was used as pressure medium. The typical exposure time was 60 seconds per image. The 2-D diffraction images were integrated using the DIOPTAS software Prescher and Prakapenka (2015). LeBail refinements on the high pressure XRD data were performed in GSAS-II Toby and Von Dreele (2013).
High-pressure dc-magnetization measurements were performed in a Quantum Design MPMS using a miniaturized Tozer-type turnbuckle DAC Graf et al. (2011); Giriat et al. (2010). The diamonds had culets of . A Berylco25 gasket was pre-indented from 250 to . The pressure medium was 1:1 n-pentane:isoamyl alcohol, which is known to be nearly hydrostatic to at room temperature Klotz et al. (2009). The ruby manometer signal was collected via fiber optic access through a custom sample rod. Pressure was applied at room temperature for these measurements.
The ac-magnetic susceptibility measurements were performed using a balanced-primary/secondary-coil system that has been described elsewhere Deemyad et al. (2001). The diamond anvil cell is an Almax-Easylab “Chicago DAC” Feng et al. (2014), which is designed to fit inside the bore of a Quantum Design PPMS. Samples with approximate dimensions of were extracted from a larger chunk of polycrystalline material and loaded into the sample chamber. The diamonds had culets of and a Berylco25 gasket was indented from 250 to . Daphne oil was used as a pressure medium. Two SR830 lock-in amplifiers are used in order to simultaneously measure the first and third harmonic of the ac magnetic susceptibility Ishida and Goldfarb (1990). The primary provides an excitation field of RMS at . The detection coil is connected through a Stanford Research SR554 transformer/preamplifier. For these measurements, the signal is dominated by a large, temperature-dependent background signal deriving from the gasket and nearby parts of the DAC. In order to eliminate this contribution, we have measured the temperature-dependent background susceptibility and subtracted it from the data. The ruby manometer signal was collected via optical fiber and a lens system which is mounted to the diamond anvil cell. Pressure changes were carried out at room temperature.
For the resistivity measurements, small pieces of sample with dimensions of about were cut from a larger piece of polycrystal for each of the measurements. The measurements were carried out in a OmniDAC gas-membrane-driven diamond anvil cell from Almax-EasyLab. The cell was placed inside a custom, continuous-flow cryostat built by Oxford Instruments. Optical access to the cell for visual observation and measurement of the ruby manometer is provided through windows at the bottom of the cryostat and an optical fiber entering via a feed-through at the top. One of the diamonds used was a designer-diamond anvil containing eight symmetrically arranged, deposited-tungsten microprobes encapsulated in high-quality-homoepitaxial diamond Weir et al. (2000). This diamond had a culet diameter of , and the opposing anvil had a culet diameter of . Resistance was measured in the van der Pauw geometry with currents of 1 mA. Gaskets were pre-indented from to thickness and were made of 316 stainless steel. Quasihydrostic soft, solid steatite was used as the pressure-transmitting medium. The temperature at which pressure was applied varied in different experimental runs as specified in the text and figures.
III Crystal structure
Representative XRD patterns are shown in Fig. 1. At additional peaks from solid Ne pressure medium (marked by asterisks) appear in the diffraction pattern. The lattice parameters and obtained from LeBail refinements with space group P4/mmm are shown in Fig. 2. Both and decrease smoothly with pressure up to (CsEuFe4As4) and (RbEuFe4As4). The volume as a function of pressure in the low pressure structure for both compounds is fit with the third-order Birch-Murnaghan equation Birch (1978). For CsEuFe4As4, we find and . For RbEuFe4As4, we find and . Due to the absorption of the c-BN seat and spotty nature of the data, Rietveld refinement was not successful.
With further increase of pressure, anomalous compression is evidenced by the negative compressibility of and a gradual collapse of the lattice constant evidenced by a change in the slope of vs . These features are also visible in the ratio plotted in the lower panels of Fig. 2. Such tetragonal to collapsed-tetragonal structural transitions are common in 122 compounds Kreyssig et al. (2008); Jørgensen et al. (2009); Uhoya et al. (2010); Jayasekara et al. (2015). Similar anomalous compression has been observed in CaKFe4As4 near Kaluarachchi et al. (2017) and in the 122 analog EuFe2As2 around Uhoya et al. (2010); Yu et al. (2014). The relatively small changes in the lattice parameters at the structural transition for CaKFe4As4, combined with density functional theory (DFT) calculations, lead the authors of Ref. Kaluarachchi et al. (2017) to propose that the transition is to a “half-collapsed” tetragonal phase. In this phase, As-As bonds form across the Ca layer, but not across the K layer. At still higher pressures, one might thus expect another collapse transition as As-As bonds form across the K layer. In the present results on RbEuFe4As4 and CsEuFe4As4 we find changes in the and lattice constants that are consistent with the half collapse scenario since they are comparable to those found for CaKFe4As4 and substantially smaller than those found for KFe2As2 Nakajima et al. (2015) and CaFe2As2 Kreyssig et al. (2008).

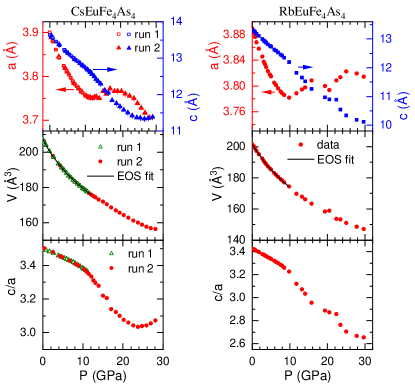
In the case of the RbEuFe4As4 data, we see two anomalies in the lattice constant vs pressure data. This is most clearly visible in the vs P data, where begins to increase at , passes through a maximum and then again begins to increase with pressure near . These two features may be connected with a sequence of transitions from tetragonal (T) to half-collapsed (hcT) starting at , followed by a transition from hcT to fully collapsed tetragonal (cT) starting at . In the case of CsEuFe4As4, the data suggest that the transition to the hcT phase begins at , while an eventual cT phase likely appears at a pressure somewhere above .
IV Magnetic measurements
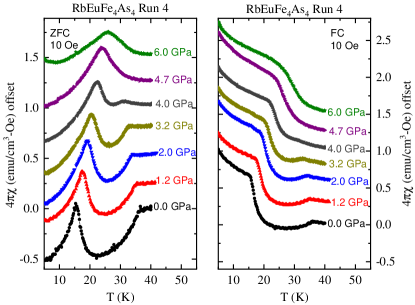
Figure 3 presents the results of dc magnetization measurements on RbEuFe4As4 at several values of the applied pressure. The data were collected with an applied field of . The zero-field-cooled (ZFC) and field cooled (FC) measurements are plotted in separate panels and the data have been offset for clarity. The measurement marked was collected with the sample loaded inside the pressure cell sample chamber. At zero pressure, both the superconducting transition () and the magnetic transition () are clearly visible. The data have been plotted using the estimated volume of the sample such that a full Meissner effect would generate a change in the signal of . The measurements indicate a shielding fraction of , which is consistent with the relatively large size of the ferromagnetic anomaly compared to the superconducting drop. We note that the exact volume of the tiny, irregularly shaped sample is difficult to estimate precisely and the error in this calibration could be as large as . The type-II nature of the superconductivity is evident from the smaller magnitude of the diamagnetic drop in for the FC measurements compared to the ZFC measurements.
As pressure increases, the magnetic transition moves to higher temperature and the diamagnetic signal at moves to lower temperature and becomes smaller. Somewhere between 4.0 and clear signatures of the superconducting transition vanish. Extrapolation of the two transition temperatures suggests that they do not meet until . The disappearance of the superconducting signal at a somewhat lower pressure might be due to substantial flux pinning on cooling through the superconducting transition when is just below .
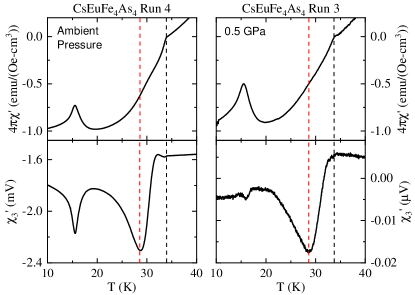
Figure 4 shows a comparison of the real parts of the first () and third harmonic () of the ac susceptibility for CsEuFe4As4. Results are shown for both a large piece of sample at ambient pressure and for a small piece of sample loaded in the diamond cell at the lowest applied pressure, . The data have been plotted in units such that corresponds to full shielding, by using estimates of the sample volume. Both the ambient pressure sample and the sample loaded in the diamond cell show diamagnetic signals that are consistent with full shielding.
While the interpretation of is simple, the interpretation of is less straightforward. It is known that the shape of the transition can have a complicated dependence on measurement conditions. Analysis of the frequency dependence of can provide insight into the flux dynamics of the material Gioacchino et al. (2010); Di Gioacchino et al. (1999). From a practical standpoint, provides a complementary way to track the transition temperatures as a function of pressure. Figure 4 demonstrates that the superconducting onset temperature in occurs at approximately the same temperature as the onset in . In addition, the minimum in just below is in good agreement with the midpoint of the superconducting transition measured via . As we will see later, the minimum in also corresponds very closely with the midpoint of the resistive transition. Though the feature at is visible in the high pressure data, it is substantially smaller in relative magnitude than the corresponding feature in the large, ambient pressure sample.
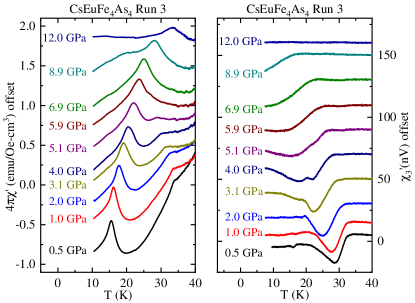
Having established the approximate shielding fraction and relationship between first and third harmonic signals, we now turn to the high-pressure ac susceptibility results. Figure 5 shows a selection of ac magnetic susceptibility measurements for CsEuFe4As4. The trends are very similar to those observed in the dc measurements on RbEuFe4As4, though the measurements extend to higher pressures. Increasing pressure causes an increase in and a decrease in . When the superconducting and magnetic transition are very close in temperature ( and ) it becomes difficult to distinguish the location of . However at higher pressure () there appears to be a diamagnetic superconducting signal just below , which is lower than . This suggests that a significant fraction of the sample remains superconducting when . However, the proximity of and , together with the broadness of the superconducting transitions, make it impossible to obtain an unambiguous estimate of the superconducting volume fraction at the higher pressures. Nonetheless, by , which is above the structural transition, there is clearly no trace of a superconducting transition - though the signal at remains.
Figure 5b shows the corresponding measurements of , which were measured simultaneously with the first harmonic at each pressure. An onset in the signal is still visible up to , but is supressed to below by . The minimum in , which corresponds approximately to the midpoint of the superconducting transition, can be tracked to . Both onset and midpoint indicate a monotonic suppression of with pressure.
V Electrical resistivity measurements
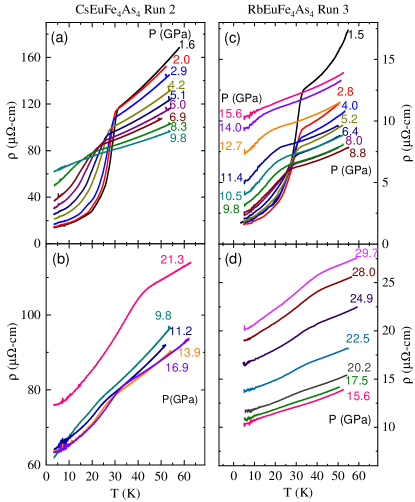
Figure 6 shows resistivity versus temperature curves for CsEuFe4As4 and RbEuFe4As4 at selected pressures spanning the entire pressure range studied. In order to present the data clearly and avoid excessive overlapping of the curves, we have plotted the data corresponding to superconducting transitions in the upper panel, and those corresponding to magnetic transitions in the lower panel. The resistivity does not drop completely to zero for either compound. At the lowest temperatures, roughly 20% of the normal state resistance remains. We tested 3-4 samples of each compound at the lowest achievable pressure () and never achieved zero resistance. Typically, at the lowest temperatures, the resistance dropped to 20-40% of the normal state resistance above (though in one case, the drop was only 10%). The absence of zero resistance can not be an artifact of the measurement technique, since similar measurements on superconductors with the same designer anvil have produced zero resistance VanGennep et al. (2017); Jackson et al. (2017). It is possible that the substantial shear forces associated with the solid-steatite pressure medium contribute to a poor connectivity and sizable inter-grain resistance even below . We also note that the low pressure values of the resistivity vary substantially from sample to sample. This is likely related to several factors: the uncertain geometry of the very tiny samples, the varying strain in the solid pressure medium, and possible impurity phases in the polycrystalline samples. High pressure measurements on single crystals would likely resolve these issues.
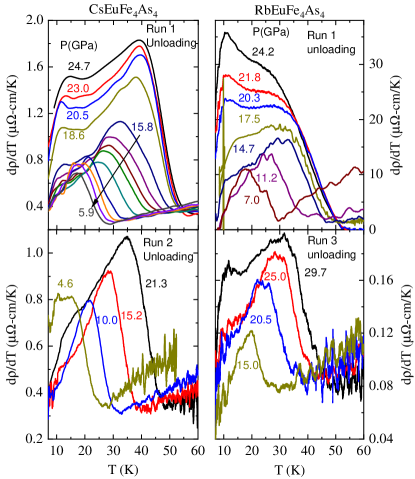
Despite the issues described above, the resistivity data show clear trends that allow us to track both and as a function of pressure. For both compounds decreases smoothly with pressure. The drop in the resistance above becomes smaller at higher pressures and eventually vanishes. Once the signatures of superconductivity vanish, another weaker anomaly appears in the resistivity. This feature moves to higher temperature and becomes more pronounced with increasing pressure. At lower pressures in particular, the weaker anomaly is difficult to see in the raw resistivity data (Fig. 6b,d), but is clearly visible in the derivative of this data. Derivative () data are presented for several different experimental runs in Fig. 7. The high pressure anomaly in the resistivity is clearly due to the magnetic ordering transition, since it shows the same pressure dependence as (see Fig. 8).
VI Phase diagrams
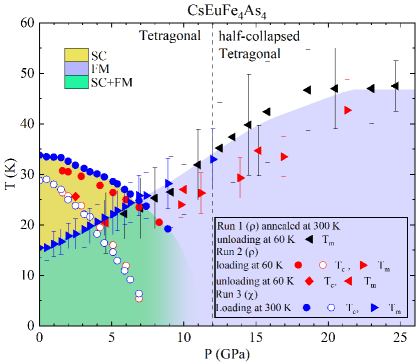
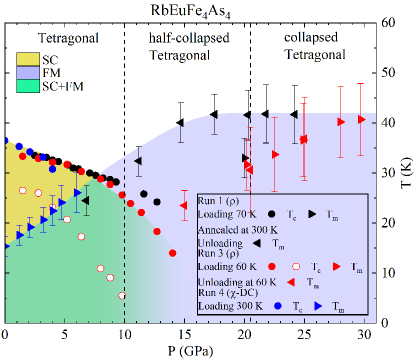
Combining the data from six different pressure runs, consisting of magnetic or resistivity measurements at more than 90 different pressures, together with the room-temperature x-ray diffraction data, we arrive at the phase diagrams presented in Figure 8. The dashed vertical lines indicate the critical pressures for the onset of the structural transitions, which have been determined at room temperature from the pressure at which the lattice constant begins to increase. While it is possible that these transition pressures have some temperature dependence, in the case of CaKFe4As4, it was found that the ThcT transition pressure was not strongly dependent on temperature Kaluarachchi et al. (2017). Both CsEuFe4As4 and RbEuFe4As4 exhibit quite similar phase diagrams. The similarity in the phase diagrams for both compounds is not surprising given that, at , the values of , , and the compressibility of the two compounds are nearly identical.
Under pressure, increases to a maximum value near at . The initial () values of the slope are for RbEuFe4As4 and for CsEuFe4As4. We do not detect any significant anomaly or change in slope of the vs pressure curve at the onset of the ThcT transition. With increasing pressure, is suppressed monotonically. Assembling data from multiple measurements suggests that the onset of the superconducting transition falls below at for both compounds. In the case of the Cs compound, we have evidence from a single temperature sweep that a substantial fraction of the sample remains superconducting when (see and data for in Fig. 5).
The criteria for the superconducting onset temperature is given by the intersection of linear fits to the data just above and just below the the onset of the transition. Magnetic ordering temperatures, , are determined using the peak in (Figs. 3 and 5), or the the midpoint of the feature in (Fig. 7). The open symbols in the phase diagrams correspond to the midpoint of the superconducting transition. The midpoint values are estimated by taking either the temperature where the resistivity has dropped to 50% of the normal state value just above the onset or by taking the minimum in (see Fig. 4). For the CsEuFe4As4 phase diagram, where both types of data are available, there is very good agreement between the superconducting transition midpoints determined from resistivity and . In the case of CsEuFe4As4, the midpoint goes to zero roughly at . For RbEuFe4As4, the midpoint of the superconducting transition vanishes at a slightly higher pressure ().
For some of the measurements, the sample was annealed at room temperature at high pressure, while for other measurements pressure application occurred at low temperature and the sample was maintained at throughout the course of the experiment (see key to Fig. 8). For the superconducting transition, the data are in good agreement for both types of pressure application. The data may suggest that samples compressed at low temperatures tend to present the magnetic transition at a lower temperature than samples subjected to high pressure at room temperature. This can be seen by comparing the black and red triangles in the high pressure part of the phase diagram. The effect is most pronounced for the RbEuFe4As4 sample, though a small effect with the same trend appears to exist in the CsEuFe4As4 data as well. One possibility is that is sensitive to the hydrostaticity of the pressure conditions. Annealing the sample at room temperature under pressure may tend to relieve strain in the sample. The phase diagrams of several 122-type iron-based superconductors are well known to be sensitive to the degree of hydrostaticity Paglione and Greene (2010); Stewart (2011). Another possibility is that kinetic effects due to low temperature compression alter the pressures ranges for which different crystal structures are present in the sample Jackson et al. (2017); Desgreniers et al. (2015). There are not yet low-temperature/high-pressure x-ray diffraction studies on EuFe4As4 compounds to test whether this might be the case.
VII Discussion
Among 1144 materials, to date, only CaKFe4As4 appears to have been the subject of a study under applied pressure Kaluarachchi et al. (2017). For CaKFe4As4, pressure causes a similar decrease in critical temperature with pressure, though at a slightly higher rate than we find for RbEuFe4As4 and CsEuFe4As4. At the structure collapses to an hcT phase, and bulk superconductivity vanishes (though traces of filamentary superconductivity remain) Kaluarachchi et al. (2017). For (Rb,Cs)EuFe4As4, an important question is whether bulk superconductivity begins to vanish at the onset of the structural transition or, perhaps, at , where dips below . The former possibility seems probable since we see substantial signatures of superconductivity in the susceptibility for CsEuFe4As4 at pressures above .
Another interesting question is whether the initial ThcT transition corresponds to As-As bonds developing across the Eu layer or, alternatively, across the Rb/Cs layer. Analysis of our x-ray data has not allowed us to unambiguously choose between these possibilities. Comparison with the behavior of other 122 compounds at high pressure Huhnt et al. (1998); Terashima et al. (2009); Matsubayashi et al. (2011); Kurita et al. (2011, 2012); Kobayashi et al. (2012); Kumar et al. (2014) gives some insight. Several Eu-based 122 compounds are known to exhibit pressure-induced TcT transitions that are connected to a valence change from Eu2+ to non-magnetic Eu3+ Huhnt et al. (1998); Ni et al. (2001); Uhoya et al. (2010). For comparison with CsEuFe4As4 and RbEuFe4As4, we first look to EuFe2As2.
At ambient pressure, EuFe2As2 exhibits antiferromagnetic order () deriving from Eu2+ ions. EuFe2As2 exhibits pressure induced superconductivity (coexisting with antiferromagnetic order) over a narrow range of pressures near Miclea et al. (2009). Under pressure eventually begins to increase and then transforms to ferromagnetism at Matsubayashi et al. (2011). A TcT transition commences at (at low temperature) Yu et al. (2014). At roughly the same pressure, the ferromagnetic ordering temperature passes through a maximum and begins to decrease. The magnetic order and moment of the Eu ion appear to be completely suppressed by Matsubayashi et al. (2011). These observations are consistent with a valence transition from Eu2+ to non-magnetic Eu3+ that commences near the structural transition, but is not complete until significantly higher pressures. Examination of the phase diagrams in Fig 8, shows that the pressure dependence of the magnetic ordering temperature does not exhibit any clear anomaly at the onset of the ThcT transitions. On the other hand, it does appear that begins to saturate within the hcT phases. Therefore, from our versus data alone, it is not possible to categorically select which layer (Eu or alkali metal) initially collapses. However, as discussed below, consideration of structural trends in iron-based 122 compounds strongly suggests that the initial collapse occurs in the Eu layer.
Yu et al. Yu et al. (2014) examined the critical pressure for the TcT transition pressure in AFe2As2 compounds ( = Ca, Sr, Ba, and Eu). They noted that the critical pressure showed a trend of increasing with increasing cation radius. This trend is consistent with the findings of DFT calculations on CaKFe4As4 Kaluarachchi et al. (2017), which indicate that the Ca layer collapses first () while the K layer only collapses at higher pressures () Martienssen and Warlimont (2005). The ionic radius of Eu2+ () is smaller than that of both Rb+ () and Cs+ () Martienssen and Warlimont (2005). Consequently, in CsEuFe4As4 and RbEuFe4As4, the collapse of the Eu layer should occur first, with the alkali metal layer collapsing at higher pressure. This picture is also consistent with our observation that the sample containing the smaller Rb+ ion exhibits a second collapse transition beginning at , while for the sample containing the larger Cs+ ion, the second collapse does not occur below . Comparison with the trend of the TcT pressure versus ionic radius presented in Ref. Yu et al. (2014) suggests that the Cs layer in CsEuFe4As4 should collapse at a pressure of , which is just at the limit of the range of our measurements.
VIII Conclusion
In summary, we find that both RbEuFe4As4 and CsEuFe4As4 exhibit very similar phase diagrams under pressure. X-ray diffraction measurements suggest a transition to a half-collapsed tetragonal phase at pressures of and for RbEuFe4As4 and CsEuFe4As4, respectively. For RbEuFe4As4, an additional structural transition to a fully collapsed tetragonal phase may occur at . For both materials, the magnetic transition temperature, , increases with pressure while the superconducting transition temperature decreases. The two transitions coincide near a critical pressure , indicating that a crossover from FMS to SFM occurs prior to the onset of the tetragonal half-collapsed-tetragonal transition. The relatively modest pressures required to tune this crossover make EuFe4As4 compounds a very interesting system to further explore the interplay of superconductivity and (local moment) magnetism in a clean, stoichiometric material.
The present measurements have been performed using polycrystalline samples which show somewhat broad transitions. Recently, single crystalline specimens Bao et al. (2018) have been grown which show substantially sharper transitions. It would be particularly interesting to further examine the narrow pressure range around in such crystals in order to explore e.g., the influence of the FMS to SFM crossover on the upper critical field curve.
Acknowledgments
This work was supported by National Science Foundation (NSF) CAREER award DMR-1453752. High pressure technique development was partially supported by a National High Magnetic Field Laboratory User Collaboration Grant. The National High Magnetic Field Laboratory is supported by the NSF via Cooperative agreement No. DMR-1157490, the State of Florida, and the U.S. Department of Energy. Designer diamond anvils were supported by DOE-NNSA Grant No. DE-NA0002928 and under the auspices of the U.S. Department of Energy by Lawrence Livermore National Laboratory under Contract DE-AC52-07NA27344. Support from COMPRES under NSF Cooperative Agreement EAR-1606856 is acknowledged for COMPRES-GSECARS gas loading system, the PX2 program and partial support of W. Bi. P. Materne would like to acknowledge support from Deutsche Forschungsgemeinschaft (DFG, German Research Foundation) in the project MA 7362/1-1. We thank S. Tkachev for help with the Ne loading of the DACs at the APS. Y. Liu and G. Cao acknowledge the support by the National Science Foundation of China (under Grants No. 11474252). We thank G. R. Stewart, K. Quader, P. J. Hirschfeld, and R. Valentí for helpful comments.
References
- Iyo et al. (2016) A. Iyo, K. Kawashima, T. Kinjo, T. Nishio, S. Ishida, H. Fujihisa, Y. Gotoh, K. Kihou, H. Eisaki, and Y. Yoshida, J. Am. Chem. Soc. 138, 3410 (2016).
- Kawashima et al. (2016) K. Kawashima, T. Kinjo, T. Nishio, S. Ishida, H. Fujihisa, Y. Gotoh, K. Kihou, H. Eisaki, Y. Yoshida, and A. Iyo, J. Phys. Soc. Jpn. 85, 064710 (2016).
- Liu et al. (2016a) Y. Liu, Y.-B. Liu, Z.-T. Tang, H. Jiang, Z.-C. Wang, A. Ablimit, W.-H. Jiao, Q. Tao, C.-M. Feng, Z.-A. Xu, and G.-H. Cao, Phys. Rev. B 93, 214503 (2016a).
- Liu et al. (2016b) Y. Liu, Y.-B. Liu, Q. Chen, Z.-T. Tang, W.-H. Jiao, Q. Tao, Z.-A. Xu, and G.-H. Cao, Sci. Bull. 61, 1213 (2016b).
- Albedah et al. (2018a) M. A. Albedah, F. Nejadsattari, Z. M. Stadnik, Y. Liu, and G.-H. Cao, J. Phys. Condens. Matter 30, 155803 (2018a).
- Albedah et al. (2018b) M. A. Albedah, F. Nejadsattari, Z. M. Stadnik, Y. Liu, and G.-H. Cao, Phys. Rev. B 97, 144426 (2018b).
- Smylie et al. (2018) M. P. Smylie, K. Willa, J. K. Bao, K. Ryan, Z. Islam, H. Claus, Y. Simsek, Z. Diao, A. Rydh, A. E. Koshelev, W. K. Kwok, D. Y. Chung, M. G. Kanatzidis, and U. Welp, (2018), arXiv:1805.04216 .
- Sinha et al. (1982) S. K. Sinha, G. W. Crabtree, D. G. Hinks, and H. Mook, Phys. Rev. Lett. 48, 950 (1982).
- Burlet et al. (1986) P. Burlet, A. Dinia, S. Quezel, J. Rossat-Mignod, J. Génicon, A. Benoit, J. Flouquet, R. Tournier, R. Horyn, O. Peña, and M. Sergent, J. Magn. Magn. Mater. 54-57, 1534 (1986).
- Kawashima et al. (2018) K. Kawashima, S. Ishida, K. Oka, H. Kito, N. Takeshita, H. Fujihisa, Y. Gotoh, K. Kihou, H. Eisaki, Y. Yoshida, and A. Iyo, J. Phys. Conf. Ser. 969, 012027 (2018).
- Fertig et al. (1977) W. A. Fertig, D. C. Johnston, L. E. DeLong, R. W. McCallum, M. B. Maple, and B. T. Matthias, Phys. Rev. Lett. 38, 987 (1977).
- Ishikawa and Fischer (1977) M. Ishikawa and . Fischer, Solid State Commun. 23, 37 (1977).
- Aoki et al. (2001) D. Aoki, A. Huxley, E. Ressouche, D. Braithwaite, J. Flouquet, J. P. Brison, E. Lhotel, and C. Paulsen, Nature 413, 613 (2001).
- Saxena et al. (2000) S. Saxena, P. Agarwal, K. Ahilan, F. Grosche, R. Haselwimmer, M. Steiner, E. Pugh, I. Walker, S. Julian, P. Monthoux, G. Lonzarich, A. Huxley, I. Sheikin, D. Braithwaite, and J. Flouquet, Nature 406, 587 (2000).
- Huy et al. (2007) N. T. Huy, A. Gasparini, D. E. de Nijs, Y. Huang, J. C. P. Klaasse, T. Gortenmulder, A. de Visser, A. Hamann, T. Görlach, and H. v. Löhneysen, Phys. Rev. Lett. 99, 067006 (2007).
- Kakani and Upadhyaya (1988) S. L. Kakani and U. N. Upadhyaya, Journal of Low Temperature Physics 70, 5 (1988).
- Wolowiec et al. (2015) C. Wolowiec, B. White, and M. Maple, Physica C 514, 113 (2015).
- Liu et al. (2017) Y. Liu, Y.-B. Liu, Y.-L. Yu, Q. Tao, C.-M. Feng, and G.-H. Cao, Phys. Rev. B 96, 224510 (2017).
- Chijioke et al. (2005) A. D. Chijioke, W. J. Nellis, A. Soldatov, and I. F. Silvera, J. Appl. Phys. 98, 114905 (2005).
- Zhang et al. (2017) D. Zhang, P. K. Dera, P. J. Eng, J. E. Stubbs, J. S. Zhang, V. B. Prakapenka, and M. L. Rivers, J. Vis. Exp. 119, e54660 (2017).
- Dewaele et al. (2008) A. Dewaele, F. Datchi, P. Loubeyre, and M. Mezouar, Phys. Rev. B 77, 094106 (2008).
- Prescher and Prakapenka (2015) C. Prescher and V. B. Prakapenka, High Press. Res. 35, 223 (2015).
- Toby and Von Dreele (2013) B. H. Toby and R. B. Von Dreele, J. Appl. Crystallogr. 46, 544 (2013).
- Graf et al. (2011) D. E. Graf, R. L. Stillwell, K. M. Purcell, and S. W. Tozer, High Pressure Research 31, 533 (2011).
- Giriat et al. (2010) G. Giriat, W. Wang, J. P. Attfield, A. D. Huxley, and K. V. Kamenev, Rev. Sci. Instrum. 81, 073905 (2010).
- Klotz et al. (2009) S. Klotz, J.-C. Chervin, P. Munsch, and G. L. Marchand, J. Phys. D 42, 075413 (2009).
- Deemyad et al. (2001) S. Deemyad, J. S. Schilling, J. D. Jorgensen, and D. G. Hinks, Phys. C 361, 227 (2001).
- Feng et al. (2014) Y. Feng, D. M. Silevitch, and T. F. Rosenbaum, Rev. of Sci. Instrum. 85, 033901 (2014).
- Ishida and Goldfarb (1990) T. Ishida and R. B. Goldfarb, Phys. Rev. B 41, 8937 (1990).
- Weir et al. (2000) S. T. Weir, J. Akella, C. Aracne-Ruddle, Y. K. Vohra, and S. A. Catledge, Appl. Phys. Lett. 77, 3400 (2000).
- Birch (1978) F. Birch, J. Geophys. Res.: Solid Earth 83, 1257 (1978).
- Kreyssig et al. (2008) A. Kreyssig, M. A. Green, Y. Lee, G. D. Samolyuk, P. Zajdel, J. W. Lynn, S. L. Bud’ko, M. S. Torikachvili, N. Ni, S. Nandi, J. B. Leão, S. J. Poulton, D. N. Argyriou, B. N. Harmon, R. J. Mcqueeney, P. C. Canfield, and A. I. Goldman, Phys. Rev. B 78, 184517 (2008).
- Jørgensen et al. (2009) J.-E. Jørgensen, J. S. Olsen, and L. Gerward, Solid State Communications 149, 1161 (2009).
- Uhoya et al. (2010) W. Uhoya, G. Tsoi, Y. K. Vohra, M. A. McGuire, A. S. Sefat, B. C. Sales, D. Mandrus, and S. T. Weir, J. Phys. Condens. Matter 22, 292202 (2010).
- Jayasekara et al. (2015) W. T. Jayasekara, U. S. Kaluarachchi, B. G. Ueland, A. Pandey, Y. B. Lee, V. Taufour, A. Sapkota, K. Kothapalli, N. S. Sangeetha, G. Fabbris, L. S. I. Veiga, Y. Feng, A. M. dos Santos, S. L. Bud’ko, B. N. Harmon, P. C. Canfield, D. C. Johnston, A. Kreyssig, and A. I. Goldman, Phys. Rev. B 92, 224103 (2015).
- Kaluarachchi et al. (2017) U. S. Kaluarachchi, V. Taufour, A. Sapkota, V. Borisov, T. Kong, W. R. Meier, K. Kothapalli, B. G. Ueland, A. Kreyssig, R. Valentí, R. J. McQueeney, A. I. Goldman, S. L. Bud’ko, and P. C. Canfield, Phys. Rev. B 96 (2017).
- Yu et al. (2014) Z. Yu, L. Wang, L. Wang, H. Liu, J. Zhao, C. Li, S. Sinogeikin, W. Wu, J. Luo, N. Wang, K. Yang, Y. Zhao, and H.-k. Mao, Scientific Reports 4, 7172 (2014).
- Nakajima et al. (2015) Y. Nakajima, R. Wang, T. Metz, X. Wang, L. Wang, H. Cynn, S. T. Weir, J. R. Jeffries, and J. Paglione, Phys. Rev. B 91, 060508 (2015).
- Gioacchino et al. (2010) D. D. Gioacchino, A. Marcelli, A. Puri, and A. Bianconi, J. Phys. Chem. Solids 71, 1046 (2010).
- Di Gioacchino et al. (1999) D. Di Gioacchino, F. Celani, P. Tripodi, A. M. Testa, and S. Pace, Phys. Rev. B 59, 11539 (1999).
- VanGennep et al. (2017) D. VanGennep, A. Linscheid, D. E. Jackson, S. T. Weir, Y. K. Vohra, H. Berger, G. R. Stewart, R. G. Hennig, P. J. Hirschfeld, and J. J. Hamlin, J. Phys. Condens. Matter 29, 09LT02 (2017).
- Jackson et al. (2017) D. E. Jackson, D. VanGennep, Y. K. Vohra, S. T. Weir, and J. J. Hamlin, Phys. Rev. B 96, 184514 (2017).
- Paglione and Greene (2010) J. Paglione and R. L. Greene, Nature Physics 6, 645 (2010), review Article.
- Stewart (2011) G. R. Stewart, Rev. Mod. Phys. 83, 1589 (2011).
- Desgreniers et al. (2015) S. Desgreniers, J. S. Tse, T. Matsuoka, Y. Ohishi, Q. Li, and Y. Ma, Appl. Phys. Lett. 107, 221908 (2015).
- Huhnt et al. (1998) C. Huhnt, W. Schlabitz, A. Wurth, A. Mewis, and M. Reehuis, Physica B 252, 44 (1998).
- Terashima et al. (2009) T. Terashima, M. Kimata, H. Satsukawa, A. Harada, K. Hazama, S. Uji, H. S. Suzuki, T. Matsumoto, and K. Murata, J. Phys. Soc. Jpn. 78, 083701 (2009).
- Matsubayashi et al. (2011) K. Matsubayashi, K. Munakata, M. Isobe, N. Katayama, K. Ohgushi, Y. Ueda, N. Kawamura, M. Mizumaki, N. Ishimatsu, M. Hedo, I. Umehara, and Y. Uwatoko, Phys. Rev. B 84, 024502 (2011).
- Kurita et al. (2011) N. Kurita, M. Kimata, K. Kodama, A. Harada, M. Tomita, H. S. Suzuki, T. Matsumoto, K. Murata, S. Uji, and T. Terashima, Phys. Rev. B 83, 214513 (2011).
- Kurita et al. (2012) N. Kurita, M. Kimata, K. Kodama, A. Harada, M. Tomita, H. S. Suzuki, T. Matsumoto, K. Murata, S. Uji, and T. Terashima, J. Phys. Conf. Ser. 391, 012132 (2012).
- Kobayashi et al. (2012) H. Kobayashi, S. Ikeda, Y. Sakaguchi, Y. Yoda, H. Nakamura, and M. Machida, J. Phys. Condens. Matter 25, 022201 (2012).
- Kumar et al. (2014) R. S. Kumar, Y. Zhang, A. Thamizhavel, A. Svane, G. Vaitheeswaran, V. Kanchana, Y. Xiao, P. Chow, C. Chen, and Y. Zhao, Appl. Phys. Lett. 104, 042601 (2014).
- Ni et al. (2001) B. Ni, M. M. Abd-Elmeguid, H. Micklitz, J. P. Sanchez, P. Vulliet, and D. Johrendt, Phys. Rev. B 63, 100102 (2001).
- Miclea et al. (2009) C. F. Miclea, M. Nicklas, H. S. Jeevan, D. Kasinathan, Z. Hossain, H. Rosner, P. Gegenwart, C. Geibel, and F. Steglich, Phys. Rev. B 79, 212509 (2009).
- Martienssen and Warlimont (2005) W. Martienssen and H. Warlimont, eds., Springer Handbook of Condensed Matter and Materials Data (Springer-Verlag Berlin Heidelberg, 2005) Note: The radii mentioned in the text are for six-coordinated ions.
- Bao et al. (2018) J.-K. Bao, K. Willa, M. P. Smylie, H. Chen, U. Welp, D. Y. Chung, and M. G. Kanatzidis, Cryst. Growth Des. (in press; DOI:10.1021/acs.cgd.8b00315) (2018).