|
|
Segregation of polymers under cylindrical confinement: Effects of polymer topology and crowding |
| James M. Polson,∗ and Deanna R.-M. Kerry‡ | |
|
|
Monte Carlo computer simulations are used to study the segregation behaviour of two polymers under cylindrical confinement. Using a multiple-histogram method, the conformational free energy, , of the polymers was measured as a function of the centre-of-mass separation distance, . We examined the scaling of the free energy functions with the polymer length, the length and diameter of the confining cylinder, the polymer topology (i.e. linear vs ring polymers), and the packing fraction and size of mobile crowding agents. In the absence of crowders, the observed scaling of is similar to that predicted using a simple model employing the de Gennes blob model and the approximation that the free energy of overlapping chains in a tube is equal to that of two isolated chains each in a tube of half the cross-sectional area. Simulations were used to test the latter approximation and reveal that it yields poor quantitative predictions. This, along with generic finite-size effects, likely gives rise to the discrepancies between the predicted and measured values of scaling exponents for . For segregation in the presence of crowding agents, the free energy barrier generally decreases with increasing crowder packing fraction, thus reducing the entropic forces driving segregation. However, for fixed packing fraction, the barrier increases as the crowder/monomer size ratio decreases. |
1 Introduction
Overlapping polymers confined to a narrow channel experience a reduction in their conformational entropy, leading to an effective repulsion that drives separation of the chains.1, 2 This effect has been the subject of much study in recent years due to its possible role as a mechanism for chromosome separation in replicating bacteria.3, 4, 5 While recent evidence suggests that entropic forces alone may be insufficient to achieve complete segregation of chromosomes,6, 7, 8, 9, 10, 11 a complete picture of the mechanism of bacterial chromosome segregation continues to be elusive.12, 13, 9, 14, 15 It remains plausible that entropy makes a significant contribution to this process. Thus, using the basic theoretical tools of polymer physics to study separation of confined polymers should help elucidate its role in bacterial chromosome segregation.2 In addition, such theoretical insight will be of value for interpreting results of in vitro experiments of DNA separation in nanochannels.16
Polymer segregation under confinement in channels has been the subject of numerous simulation studies3, 17, 18, 19, 20, 21, 22, 23, 24, 25, 26, 27, 28, 29, 30, 31 These studies have mostly employed simple bead-spring polymer models composed of monomers. In relation to the bacterial chromosome, it has been proposed that each bead can be viewed as a representation of a topological domain of – base pairs32 formed by a combination of negative supercoiling of the DNA and stabilization by nucleoid-assisted proteins.2 Generally, the focus of these simulations has been characterizing the demixing dynamics of initially overlapping chains, as well as quantifying the degree of miscibility of separated polymers in equilibrium. Most have examined fully flexible linear polymers,3, 17, 18, 19, 20, 21, 23, 24, 26, 28, 31 though a number have also considered ring polymers.22, 25, 27, 29, 30 Others have considered the effects of of bending rigidity26, 31 and macromolecular crowding.27, 30 Typically, the results are analyzed and interpreted using analytical approximations for the variation of the conformational free energy with the separation distance of the polymer centres of mass. For example, Refs. 26 and 29 employ an expression for the free energy derived using the de Gennes blob model in combination with approximating the free energy of two overlapping chains in a tube to be equal to that of two polymers in separate tubes, each with half the cross-sectional area of the real channel.22 While such approximations are convenient and conceptually elegant, finite-size effects for the blob model are expected to be significant for the system sizes typically employed in such simulations.33 In addition, the accuracy of the approximation suggested in Ref. 22 has thus far not been measured. Consequently, some caution is required when using such expressions for the free energy for a quantitative analysis of polymer segregation dynamics.
An alternative to using such analytical approximations is to measure the free energy function directly in simulations by means of probability histograms. Surprisingly, there have been only a few such studies. For example, Shin et al. measured a relatively small overlap barrier for overlapping ring polymers subject to confinement in a tube of finite length,27 while Minina and Arnold calculated and characterized the portion of the free energy function associated with the initial induction phase of segregation.28, 29 One complication that arises in the calculation of free energy functions for overlapping polymers under strong confinement is the presence of large overlap free energy barriers. In such cases, more advanced simulation methods can be required to avoid poor statistics. Recently, we used Monte Carlo (MC) simulations employing umbrella sampling with a multiple histogram method to calculate the overlap free energy functions of linear polymers for a hard-sphere chain model system.31 We studied the scaling of the functions with polymer length and confinement dimensions for both infinite- and finite-length tubes, as well as the effects of bending rigidity. Generally, we found the results to be in reasonable agreement with the analytical predictions, with quantitative discrepancies in scaling exponents that were thought to be due to finite-size effects. One notable observation for flexible chains was the presence of a regime over a range of centre-of-mass separations in which the polymers where in contact and compressed, but not overlapping. MC dynamics calculations revealed that upon separation from an initially fully overlapping state, the polymers initially remained in conformational quasi-equilibrium until this regime was entered.31
The purpose of this study is to continue our examination of the properties of the free energy function for a system of two cylindrically confined polymers. We employ the same MC methods used previously to study similar hard-sphere model systems. We focus on the effect of polymer topology by carrying out calculations for ring polymers and comparing the results with those of linear polymers. These calculations are relevant for chromosomes of bacteria such as E. coli, which possess ring topology. As in Ref. 31 we examine the scaling of the free energies with respect to polymer length and confinement dimensions and compare the results with predictions from a simple analytical model. We also carry out calculations to measure the accuracy of the approximation of Ref. 22 employed in the analytical model and find a significant quantitative discrepancy with the true overlap free energy. We also study the effect of macromolecular crowding on the free energy function by incorporating mobile crowding agents into the system. Crowding effects are likely important for bacteria, within which approximately 30–35% of the volume fraction is occupied by RNA, ribosomes and other biomacromolecules. We examine the effect of varying both the packing fraction and the size of the crowding agents. Generally, we find that increasing the crowder density decreases the barrier height, while at fixed crowder packing fraction, decreasing the size of the crowding agents increases the barrier height.
This article is organized as follows. In Section 2 we briefly describe the model used in the study, while Section 3 outlines the MC method used to calculate the free energy functions. Section 4 presents the main results of the study, which are interpreted and discussed in detail. Results for ring and linear polymer systems in the absence of crowding agents are presented, for both infinite- and finite-length confining cylinders, after which results for systems with crowding agents are presented. In Section 5 we summarize the key findings of this study.
2 Model
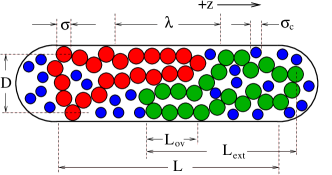
We employ a minimal model of two polymer chains confined to a cylindrical tube. Each polymer is modeled as a chain of hard spheres, each with a diameter of . Thus, the pair potential for non-bonded monomers is for and for , where is the distance between the centres of the monomers. Pairs of bonded monomers interact with a potential if and , otherwise. Thus, the bond length fluctuates slightly about its average value. Most of the simulations examined ring polymers, though in some cases linear polymers were also considered.
The polymers are confined to a hard cylindrical tube of diameter . Thus, each monomer interacts with the wall of the tube with a potential for and for , where is the distance of the monomer centre from the central axis of the cylinder. Thus, is defined to be the diameter of the cylindrical volume accessible to the centres of the monomers and the actual diameter of the cylinder is . We consider both infinite- and finite-length tubes. In the latter case, each end of the cylinder is capped with a hemisphere whose diameter is equal to that of the cylinder. The length, , of the capped tube is defined be that of the cylindrical portion of the confinement volume.
In some simulations, the confining cylinder was also occupied by mobile crowding agents, which were modeled as hard spheres of diameter . In this study, we consider crowder sizes in the range . In some cases, we consider effectively infinite cylinder length by employing periodic boundary conditions along the direction. The polymer/crowder system is characterized by the crowder packing fraction, , where the is the volume of the confining spherocylinder or cylinder, in the case of where periodic boundary conditions are used.
The simulations measure the free energy as a function of , the distance between the polymer centres of mass along the direction. In addition, the variation of the overlap length, , and the chain extension length, , with are also examined.
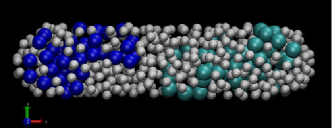
An illustration of the model system showing the definitions of the various parameters is shown in Fig. 1, along with a snapshot from a simulation.
3 Methods
Monte Carlo simulations employing the Metropolis algorithm and the self-consistent histogram (SCH) method35 were used to calculate the free energy functions for the confined-polymer model system described in Section 2. The SCH method efficiently calculates the equilibrium probability distribution , and thus its corresponding free energy function, . We have previously used this procedure to measure free energy functions in our previous study of polymer segregation,31 as well as in simulation studies of polymer translocation36, 37, 38, 39 and backfolding of confined polymers.40
To implement the SCH method, we carry out many independent simulations, each of which employs a unique “window potential” of the form:
| (1) |
where and are the limits that define the range of for the -th window. Within each window of , a probability distribution is calculated in the simulation. The window potential width, , is chosen to be sufficiently small that the variation in does not exceed a few . The windows are chosen to overlap with half of the adjacent window, such that . The window width was typically . The SCH algorithm was employed to reconstruct the unbiased distribution, from the histograms. The details of the histogram reconstruction algorithm are given in Ref. 35.
Polymer configurations were generated by carrying out single-monomer moves using a combination of translational displacements and crankshaft rotations. In addition, whole-polymer displacements of each polymer along the axis were also carried out to increase the efficiency of sampling . Each trial move was rejected if it resulted in overlap between particles or between a particle and a confinement surface; otherwise it was accepted. Initial polymer configurations were generated such that was within the allowed range for a given window potential. Prior to data sampling, the system was equilibrated. As an illustration, for a polymer chain, the system was equilibrated for typically MC cycles, following which a production run of MC cycles was carried out. On average, during each MC cycle a displacement or rotation move for each monomer as well as a whole-polymer displacement along is attempted once.
In the results presented below, quantities of length are measured in units of and energy in units of .
4 Results
Consider first the case of two polymers confined to a cylinder of infinite length in the absence of crowding agents, i.e. = and =0. Figure 2 shows the variation of with centre-of-mass separation distance for a pair of ring polymers of length =200 in a tube of diameter =4. The figure also shows the variation of the polymer overlap length and the extension length with for the same system.
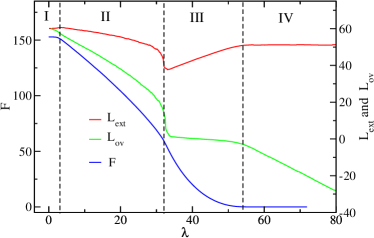
There are four distinct regimes for the functions, which we designate I, II, III and IV, as labeled in Fig. 2. In regime IV, the separation is sufficiently large that the polymers are not in contact. Consequently, varying does not change the conformational entropy and thus both and are constant. As further decreases, the polymers make contact, reducing the number of accessible conformations. Thus, the entropy decreases and rises. As the polymers are initially brought together, the overlap distance remains 0 and the extension length decreases. Thus, in regime III the polymers are in contact but not overlapping along and are compressed. At 30, and abruptly increase, and then continue to increase gradually as decreases further. This new regime, i.e. regime II, is marked by a change in the curvature of . Here, the polymers overlap along the axis and the degree of overlap increases with decreasing , but at a slower rate than in regime II and with negative curvature. Finally, at very low values of the separation distance, i.e. 4, the system enters regime I, which is characterized by constant and a slight decrease in the average extension length. This corresponds to a state where one polymer is nested within the other, as will be clarified below. The trends in , and for the ring polymers are identical to those observed previously for linear polymers.31
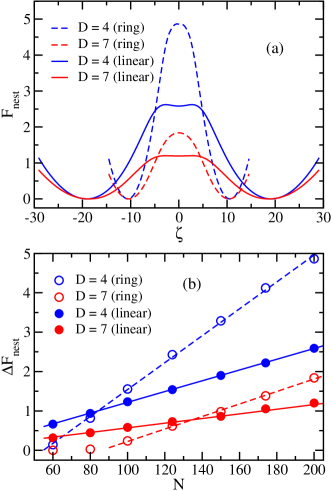
Let us first examine the case of regime I. Here, the centres of mass of the polymers are close together and one polymer tends to nest within the other. At the lowest free energy state the polymer extension length difference is nonzero. In Fig. 3(a), free energy functions are plotted for =200 polymers with perfectly overlapping centres of mass, i.e. =0. Results are shown for ring and linear polymer systems for =4 and 7. Due to the symmetry of the system, , and two equivalent minima are separated by a free energy barrier at =0. The nesting free energy barrier height, , is a measure of the degree of preference for the nesting configurations over those for with equal extension lengths at =0. Generally, increases linearly with . The rate of increase, , is greater for ring than for linear polymers. In addition, increases as the tube diameter decreases. Finally, the equilibrium chain extension length difference is only weakly affected by varying , though it is significantly greater for linear polymers than for rings.
Minina and Arnold have studied the effects of the nesting free energy barrier on the early stages of segregation of initially overlapping polymers.28, 29 They identify an induction phase in which the system surmounts the barrier in an activated process in order to break the symmetry of the system and begin segregation, and they derive expressions that predict the form and scaling of . The theoretical model employs two main theoretical tools: (1) the de Gennes blob model and (2) the approximation that the confinement free energy of two overlapping chains is equal to the that for two isolated polymers confined to cylinders of half the cross-sectional area.22 We will review these concepts in detail and employ them in our analysis of other results below. From their analysis, Minina and Arnold predict that , where is the number of de Gennes blobs for a single polymer of length in a tube of diameter , and where is the Flory exponent. The free energy minima are expected to scale . In addition, they predict that ring and linear polymer barrier heights scale , and it can further be shown that their analysis predicts . From Fig. 3 the linear relation between and holds, but only when exceeds approximately , the number of monomers in a blob. For example, the -intercept for the data for linear polymers is , which is equal to . The predicted barrier scaling rate suggests that the ratio of the slopes for =4 and 7 are . This is somewhat larger than the measured ratio for the slopes of 2.2 for both linear and ring polymers. The prediction that is consistent with the simulation results (data not shown). On the other hand, the scaling predicts , while the curves in Fig. 3 clearly show much smaller shifts in with increasing . Finally, the ratio of the slope for ring and linear polymers is predicted to be , which is noticeably less than the measured value of 2.5 for both =4 and =7.
To summarize, the predicted scaling of is generally accurate for variation of , but leads to more significant quantitative inconsistencies for variations in tube diameter . The prediction for the relation between the free energy functions for linear and ring polymers suffers to a comparable degree. The good and poor quality of the predicted scaling with and , respectively, was observed previously28, 29 and explained in terms of the limitations validity of the de Gennes blob model predictions for low and (and therefore low and ).33 It is likely that this at least partially explains the discrepancies seen here. For example, in the case of linear polymers for =4 and 7, , i.e. the length of the non-overlap portions of each polymer is only about =5. This is comparable to the tube diameter, which implies that there is only about one blob in each non-overlap region. Given this fact, finite-size effects are hardly surprising.For much larger systems, the number of such blobs will be larger, and consequently the resulting finite-size effects are expected to be smaller.
It is noteworthy that regime I is characterized by a free energy function with a barrier that increases with system size, and is also characterized by that part of which is constant with respect to , independent of system size. This suggests two possible dynamical pathways during the early stages of segregation starting from =0. One route is that suggested by Minina and Arnold28, 29 in which a fluctuation causes one half of the nested polymer to overcome the barrier in , break the symmetry, and enter regime II where the gradient in then drives segregation. In the other scenario, the polymer remains in a nested state, but its centre of mass diffuses relative to the other until one end of the polymer reaches that of the other polymer, after which the system jumps into regime II. It is by no means obvious which mechanism (or some combination) is relevant for any given set of system parameters. The preferred route will likely depend on the barrier height , as well as on the diffusion coefficients associated with each process, and all these quantities depend on , and polymer topology.
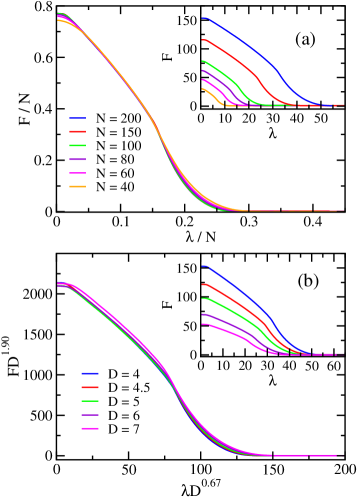
Next, we consider the scaling behaviour of the system for the other regimes. Figure 4 illustrates the effects of varying and the tube diameter on the free energy functions. The insets of the Fig. 4(a) and (b) show the measured free energy functions for various and , respectively. The trends are straightforward. The free energy barrier height, , decreases monotonically with increasing and . In addition, increasing and reduces the range of over which the polymers are in contact. This latter feature is simply a result of the reduction of the extension length of the polymer along as and each increase (data not shown); that is, as decreases, the polymers must be closer together before intermolecular contact has the effect of reducing the conformational entropy and increasing . The main parts of Fig. 4(a) and (b) show the quantitative scaling results for . Figure 4(a) shows that curves for vs at fixed tend to collapse onto a universal curve, while Fig. 4(b) shows that plotting vs also produces curves that collapse onto a single curve. Small deviations are noted for low and large , but otherwise, the data collapse is very good. Together, these results suggest that the free energy functions are of the form:
| (2) |
where is a universal function that satisfies and where the exponents have values =1.90 and =0.67.
Let us now compare the scaling properties of for ring polymers and linear polymers. Figure 5 compares the variation in the free energy barrier, , with polymer length for ring polymers and linear polymers. Results for tube diameters of =4 and =7 are shown. In each case, is proportional to . Note that this is consistent with the more general result of Eq. (2), since . In addition, this scaling was noted earlier for linear polymers in Ref. 31. For =4, fits to the data yield values of the barrier height per monomer of =0.799 for ring polymers and 0.378 for linear polymers. For =7, we find =0.263 for ring polymers and 0.132 for linear polymers.
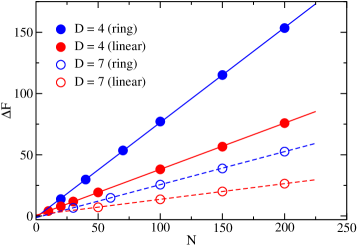
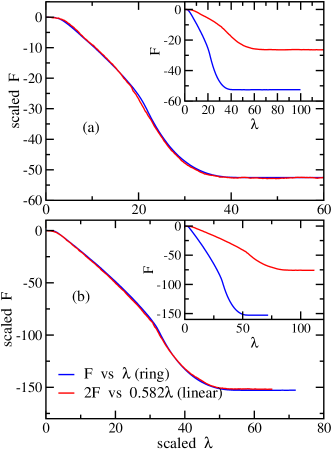
Figure 6 compares free energy functions for ring and linear polymers of length =200 for =4 in (a) and for =7 in (b). The insets show the unscaled functions for each case. While the qualitative features are the same for both polymer topologies, as noted earlier, the quantitative results differ appreciably. Generally, for the same and , ring polymers have higher free energy barriers. In addition, the range of for regime IV extends to lower for rings compared to linear polymers. The explanation for the latter trends is straightforward. The mean extension length is shorter for rings than for linear polymers, and consequently the polymers must get closer (i.e. lower ) before the polymers make contact and rises.
A prediction for the scaling of with and for both rings and linear chains that is consistent with the form of Eq. (2) can be obtained using simple scaling arguments. Let us consider first the case of a system of linear polymers. In regime II, each polymer has monomers in the overlap region and monomers in the non-overlap region. Employing the de Gennes blob model, the length of the non-overlap region is , where is a non-universal constant. To determine , we employ an approach used by Račko and Cifra26 building on an idea introduced by Jung et al.22 When two polymers overlap along the tube, each overlapping portion effectively occupies a tube of half the cross-sectional area of the real tube. Thus, the effective diameter is . Consequently, it follows that . From these relations, it is readily shown that the centre-of-mass separation distance satisfies . Inverting the equation it follows that: where is a function obtained from solving the quadratic equation for . The overlap free energy of the two chains is determined by assigning to each blob in the overlap region for both polymers. Again using an effective diameter of for monomers in this region, it follows that . Using the previous result for , we find
| (3) |
Next consider regime III, where the polymers are compressed and in contact, but not overlapping. Employing the renormalized Flory theory of Jun et al.,41 the free energy for a single linear polymer of length is
| (4) |
where and are constants of order unity and is the number of monomers in a compression blob of diameter . Approximating (i.e. assuming uniform compression) and noting the equal contributions from the two chains, it is easily shown that
| (5) |
where . Comparing with Eq. (2), The transition between regimes II and III will occur at a separation defined by . The value of is determined by non-universal constants such as , and that cannot be estimated by a scaling analysis. Note from Eqs. (3) and (5) that the scaling of with and are identical for regions II and III. In addition, the magnitude of the reduction in in regime I due to nesting effects was also predicted to scale in the same manner, as noted earlier. Thus, the form of is consistent with that of Eq. (2) in all three regimes with predicted exponents of and . These are comparable to, but somewhat less than the measured values of and .
The predicted scaling behaviour of is consistent with that derived by Minina and Arnold,28, 29 who used the same approach. However, in that work regime III is not accounted for and regime II is assumed to persist with increasing until the polymers are no longer in contact.
A prediction for the scaling of with and for ring polymers follows a very similar approach as that for linear polymers. As suggested by Jung et al.,22 a single ring polymer of length can be modeled as two completely overlapping chains of length in a tube of effective diameter . Thus, for two overlapping ring polymers in regime II, the non-overlapping portion of either polymer comprising monomers each has a length , where is the same non-universal constant used earlier. In the overlapping region, there are effectively four subchains occupying effective tubes of 1/4 the cross-sectional area of the real confining tube; thus, the effective diameter for each is . Using de Gennes blob scaling for each, the overlap region has a predicted span of . From these expressions for the two lengths, the centre-of-mass separation of two rings is easily calculated to be
Inverting this equation yields
| (6) |
where is the same function appearing in Eq. (3). Now, assigning to each blob in the four subchains of the overlapping region yields an overlap free energy of . Using Eq. (6), this gives
| (7) |
Now consider ring polymers in regime III. Here, each compressed (but non-overlapping) chain of length can be modeled as two independent subchains of length in an effective tube of diameter . Using the prediction from the renormalized Flory theory of Jun et al.41 in Eq. (2) with and substituting and , it can be shown that
| (8) |
where . As before, the separation distance dividing regimes II and III is determined by the relation . Note that Eqs. (7) and (8) predict the same scaling of with and . Thus, as was the case for linear polymers, is predicted to scale in the same manner as Eq. (2) with the correct scaling for and predicted exponents for of and . Again, these are comparable to, but slightly different from the observed values of and . In addition, comparing the results for linear and ring polymers in Eqs. (3), (5), (7), and (8), we see that
| (9) |
Thus, for a given and , the function is related to by a scaling of along and a scaling of along . These values are comparable to, but slightly different from the factors of and , respectively, that were used required to obtain collapse of the functions for ring and linear polymers in Fig. 6.
As noted above, the predicted scaling of with for both ring and linear polymers is quantitatively consistent with the predictions. However, the scaling with respect to , as well as the predicted relationship between the ring and linear polymer systems is somewhat poorer. This discrepancy is expected to arise from the inadequacy of either one or both of two approximations. First, the measured scaling exponents of polymers in simulations typically show significant deviations from the predictions from the de Gennes blob model as a result of finite-size effects. Recall that each blob, which contributes approximately to the confinement free energy, consists of monomers each. Thus, there are blobs per polymer. In order for these predictions to be accurate, it is required that and . Simulations have revealed that the first condition requires tube diameters 10, while the addition of the second condition requires polymer lengths in the range for the type of model employed here.33 Clearly, neither of these conditions is satisfied in the simulations carried out in this study. Consequently, finite-size effects are expected.
A second possible problem concerns the hypothesis that two overlapping chains have the same confinement free energy as two chains each in separate tubes of half the cross-sectional area as the real confining tube. To our knowledge, the accuracy of this approximation has not been tested previously. To do so in this study, we have carried out additional simulations of a single polymer that transitions between a tube of diameter and another of diameter . The two tube sections were connected by a tapered section of finite length. The free energy was measured as a function of the centre of mass along the composite tube using the same SCF Monte Carlo method used for the other calculations. Figure 7 compares the free energy difference of the polymer between the two tube sections, , and the overlap free energy barrier per polymer, i.e. , for the two-polymer system. The free energy differences are each plotted as a function of for both ring and linear polymer systems. The results show that the approximation overestimates the free energy barrier height and that the magnitude of this difference grows with increasing . The inset of the figure shows the relative difference, , vs . These results demonstrate that both the absolute and relative difference increases with . At large , the difference is appreciable, reaching (i.e. a factor of two difference) for =9 in the case of linear polymers. At the same , the discrepancy is not as large for ring polymers, though it does grow to an appreciable for =9. The cause of the overestimation of the confinement free energy in this approximation is straightforward. When two polymers completely overlap (i.e. when =0) the presence of the other polymer will reduce the number of accessible conformations. However, polymer conformations will clearly be accessible in the 2-chain system that will not be accessible for the 1-chain system with a reduced tube diameter. Essentially this is due to the presence of a hard confining surface of the latter system in contrast to the lateral interpenetration of the two overlapping chains in the former. As decreases, there will likely be less such interpenetration and the 2-chain system behaves more like two isolated 1-chain systems. Consequently, decreases with decreasing . Likewise, at any given , ring polymers have a higher degree of crowding than do linear polymers. Thus, there is less interpenetration of the adjacent chains, and is lower.
It is difficult to determine the degree to which the inadequacies of these two approximations contribute to the discrepancies between the predicted and observed scaling of . It is possible that one dominates, or even that there is a cancellation of opposing effects. In any case, it is worth considering the expected validity of the predictions for systems of very large and . In this regime, finite-size effects associated with the de Gennes blob model are expected to vanish, and the predicted scaling exponents for confined chains recovered. However, it is unlikely that the inaccuracy of the approximation used to calculate the overlap free energy for overlapping chains will also vanish. Consequently, it is doubtful whether the scaling of Eq. (2) with exponents of and will emerge even in the limit of large and , where and are both satisfied. Confirmation of this requires simulations using system sizes that are currently not computationally feasible.
Let us now consider polymer systems confined to cylinders of finite length with hemispheric end caps. Figure 8(a) shows free energy functions for a system of ring polymers of length =200 confined to a cylinder of diameter =4 for several different values of cylinder length . A curve for is also shown for comparison. The trends are qualitatively consistent with previous calculations for linear polymers.31 The main new feature for finite that is not present for is a steep rise in at larger values of . This is due to the fact that the polymers press up against the end-caps of the confining cylinder at large separation. Consequently, there is a reduction in the number of accessible conformations, leading to a decreasing entropy. The resulting increase in leads to a minimum in , which marks the location of the most probable separation distance. The longitudinal compression of the polymers at large is evident by the decrease in with increasing in this regime, which is shown in Fig. 8(b).
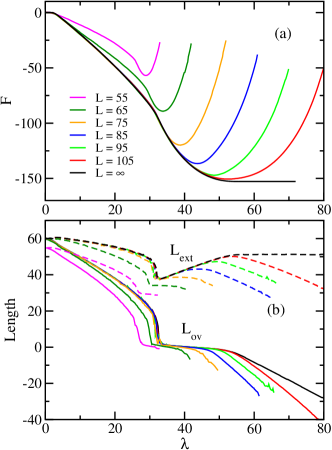
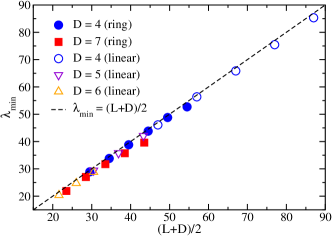
At sufficiently low , the free energy functions overlap with that of =. The location where a finite- curve peels off the = curve corresponds to the separation where the polymer first makes appreciable contact with the end-walls. As expected, these values decrease with decreasing . The same trend is evident for and in Fig. 8(b). The notable exception is the curve for =55. In this case, we note that for completely overlapping polymers, i.e. =0, the measured extension length is lower than the value for = of . Thus, polymers in such a sufficiently short cylinder already feel the effects of longitudinal confinement in a completely overlapping configuration. In all cases, the free energy minimum lies in a regime where the polymers are in regime II. Thus, the polymers are segregated but compressed by contact with the second polymer on one side and by the hemispheric end-cap on the other. In addition, the centre-of-mass separation at the minimum is expected to be approximately half the total length of the cylinder, i.e. . Figure 9 shows results for vs for both ring and linear polymer systems for =200 polymers with various values of . The behaviour is in good quantitative agreement with this prediction, though there is a small but consistent overestimate. This is likely due to the combined effects of the somewhat stronger lateral confinement at the hemispheric end-cap as well as a small degree chain overlap at the interface.
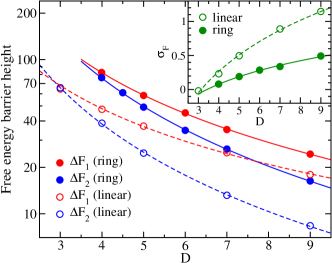
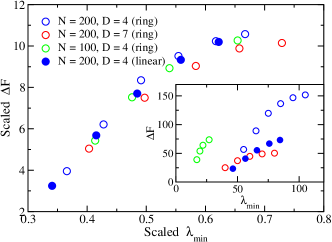
We now consider the scaling of the free energy barrier height, with , and . Results for ring polymer systems for different and are shown in the inset of Fig. 10. Each data set for fixed and corresponds to different values of . To understand the scaling properties of , we use the same approach as for the analysis for the = system. First, employing Eq. (7) for , we note . This equation is expected to be valid as long as the polymer extension length at complete overlap (i.e. ) is less than full length of the tube, i.e. . At , the polymers are in regime III. Consequently, we employ Eq. (8), i.e.
It follows that the free energy barrier height for the ring polymer system scales as
| (10) |
where and where the scaling exponents are once again predicted to be and . It follows that plotting results for vs , the data should all collapse onto a universal curve. Finally, using a similar approach to calculate the barrier height for linear polymers, it is easily verified that the relationship to for ring polymers follows the same scaling as for the = free energy functions of Eq. (9), i.e.
| (11) |
Thus, for a given and (which determine and ), the function is related to by a scaling of along and a scaling of along .
In the main part of Fig. 10, we plot the scaled data using the values of the exponents measured earlier, i.e. =1.90 and =0.67. The data for the linear polymers is also scaled by the same amounts as used in Fig. 6 to obtain data collapse for linear and ring polymer for =, i.e. a factor of 2.0 along and 0.582 along . Data collapse is good for the scaling predicted for and for the relationship between linear and ring polymers. However, it is somewhat poorer for the scaling with respect to . Evidently, problems that lead to the discrepancy in the scaling with respect to in the = results is further amplified in this scaling calculation of for finite .
Next, we consider the effects of independently varying the confinement tube aspect ratio and the packing fraction of the polymers. We define the aspect ratio as , where is the true diameter of the cylinder. (Recall that is the diameter of the cylindrical volume accessible to the monomer centres.) In addition, the packing fraction is given by , where is the monomer volume and where is the volume of the confining tube. The free energy barrier height for ring and linear polymer systems for two different packing fractions and for several values of are plotted in Fig. 11(a). Results for linear polymers with other values were presented in our earlier study.31 For both systems, the overlap free energy barrier increases monotonically with increasing confinement aspect ratio for fixed monomer density. In the case of linear polymers, there is a slight decrease in with increasing density. As we noted previously,31 these trends are consistent with the observation by Jung et al.22 that polymer miscibility decreases with increasing and decreasing . In the case of ring polymers, there is no clear trend with varying . At low a lower is observed for higher , but the trend appears to reverse at sufficiently high . Finally, we note that for any value of and , the overlap barrier height is significantly higher for ring polymers than for linear polymers.

It follows from Eqs. (10) and (11) that the data should collapse to a universal curve when plotting vs for the ring polymer data and vs for linear polymers, where and . Figure 11(b) shows the data from Figure 11(a) scaled such that the plot for ring polymers is vs and that for linear polymers is 2.0 vs 0.582. (Thus, we use the measured values of and and the scaling factors for the relation between the linear and ring polymer systems that gave the best data collapse for the previous results.) The data collapse is good for the mid-range of scaled . At high values, the divergence of the two data sets for ring polymers likely arises from the fact that becomes very small here, and the finite-size effects associated with the blob model are amplified. At very low values of scaled , the deviation of the results for linear polymers is due to the fact that the tube length becomes very short. Thus, the polymer extension length at full overlap (=0) is affected by the longitudinal confinement, while the validity of Eq. (11) rests on this assumption that this not be true. Despite these deviations, the scaling arguments generally clearly do provide an explanation for the relationship between the data for ring and linear polymers.
Next we consider the effect of mobile crowding agents on the free energy functions. We first examine the case of long confining cylinders with periodic boundary conditions. This mimics the case of = in the previous calculations. In addition, the crowder diameter is set to be that of the monomers, i.e. =1. Figure 12 shows free energies for a =80 ring polymer system for several values of the crowder packing fraction, . The inset shows the variation of the barrier height with . The free energy decreases monotonically with increasing . This result is consistent with the observation of Shin et al. for a comparable polymer system.27 The inset also shows that the barrier width (arbitrarily defined to be the value of at the inflection point of ) also decreases with .
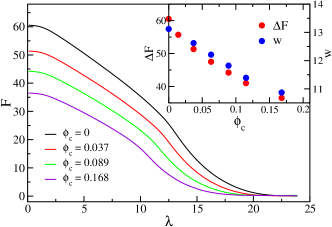
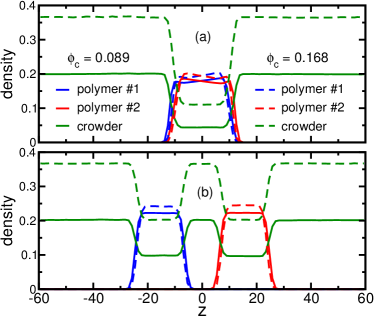
Figure 13 shows the distributions of the crowding agents and the monomers of each polymer for two different values of . The top graph shows results for two polymers with nearly overlapping centres of mass, and the lower graph shows results for the case for larger where the polymers are well separated. As expected, the crowders have a reduced density in the region occupied by the polymers. In addition the crowders are more effectively excluded from this region when the polymers overlap. For both overlapping and non-overlapping polymers, increasing crowder density induces a slight compaction of the polymer along the tube axis. This is similar to the compaction effect observed for hard-sphere model systems of a single unconfined polymer in the presence of monomeric crowders (i.e. ).42 This compaction explains the trend in Fig. 12 of decreasing barrier width with increasing : as the polymers compress along with increasing , the centre-of-mass distance at which the polymers just make contact also decreases. The decrease in the polymer overlap free energy with increasing likely arises principally for the same reason that crowding agents reduce the size of unconfined polymers, i.e., the increase in translational entropy of the crowding agents with a reduction in the volume occupied by the polymers.
Next we consider the polymer/crowder system confined to tubes of finite length. Figure 14(a) shows free energy functions for a system with of two ring polymers of length =80 and crowders of size =1 confined to a tube of length =28. Results for several different crowder packing fractions are shown. As was the case for =, decreases with increasing , again qualitatively consistent with the trend previously observed in Ref. 27. Figure 14(b) shows the corresponding variation of the average and with . Note that the polymer extension along the tube decreases with increasing for all values of , i.e., the crowders have a small compactifying effect that increases with density as was noted for = above.

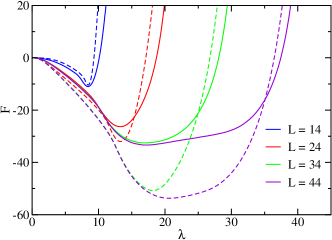
Figure 15 shows free energy functions for tubes for several different tube lengths, each for , =0 (i.e. no crowders) and =0.105. For sufficiently long tubes, the presence of crowders decreases the free energy barrier height, as in Fig. 14. However, this effect on the barrier height diminishes as decreases, and at low , crowding actually leads to a tiny increase in the barrier. To quantify this effect, we define the ratio of the barrier heights with and without the crowders, . We find that =0.63, 0.64, 0.82 and 1.06 for =44, 34, 24 and 14, respectively. In addition, for =24, 34 and 44, decreases more rapidly with separation distance in the case of =0 than =0.105, whereas the opposite opposite is true for the shortest tubes with =14. Thus, the effect of crowding on polymer segregation can be qualitatively different depending on the degree of longitudinal confinement.
Finally, we briefly consider the effects of varying the size of the crowding agents. Figure 16(a) shows free energies for =40 ring polymers in a tube of dimensions =14 and =4. Results are shown for several different packing fractions, each for =1 and =0.5. At each fixed , the effect of decreasing the crowder/monomer size ratio is to slightly increase the free energy barrier. To understand this effect, we first note results of previous studies on crowder size effects for linear polymers in infinite-length tubes. For , decreasing at constant has the effect of enhancing the depletion forces, which generally decreases the size of the polymer even to the point of inducing a collapse transition.43, 44 By the arguments presented earlier, causing the polymers to become more compact should decrease the overlap free energy. Note however in Fig. 16(b) that decreasing at fixed leads to a slight increase in polymer extension length.
The origin of this increase may be related to an effect observed in recent studies of a cylindrically confined linear43 and ring polymer45 in the presence of crowders of size =0.3. In those studies, it was noted that depletion forces between the polymer and cylinder wall can oppose the effects of monomer-monomer depletion forces. Provided the monomer-wall repulsion is not too strong, this leads to a regime in which the polymer extension increases with increasing . In the case of a ring polymer, this tends to pull the two arms of the ring to opposite sides of the tube.45 In the present case, it is possible that such surface effects lead to the slightly greater extension observed for = than for = for both overlapping and non-overlapping states. Further complicating the picture, the polymer system used for Fig. 16 is subject to longitudinal confinement, unlike the case for those previous studies. The complex interplay of all of these features may combine to lead to trends such as those observed here. A more thorough investigation is required to better clarify the effects of varying the crowder size but is beyond the scope of the present work.

5 Conclusions
In this study we have used Monte Carlo simulations to investigate the segregation behaviour of two polymers under cylindrical confinement. We have measured the conformational free energy as a function of centre-of-mass distance between the polymers and examined the scaling of the free energy functions upon variation in the confinement dimensions, topology (i.e. ring vs linear polymers) and crowder density and size. This work is a continuation of our previous study,31 in which we considered only linear polymers in the absence of crowding. As in that study, we find that the free energy typically scales in a manner that is in semi-quantitative agreement with predictions using simple scaling theoretical arguments. In the absence of crowding, the theoretical model uses a combination of the de Gennes blob theory together with an approximation that the conformational free energy of two completely overlapping polymers in a tube of cross-sectional area is equal to that of two non-interacting polymers confined to separate tubes of cross-sectional area .22 While the predicted scaling of the free energy with respect to confinement tube diameter and length, polymer length and topology is qualitatively consistent with the simulation results, we find significant deviations in the values of the measured scaling exponents from the predicted values. Given that the polymers used in the simulations are only monomers in length, finite-size effects are likely a partial cause of this discrepancy.33 However, a test of the approximation of Ref. 22 reveals that it leads to quantitatively poor predictions for the overlap free energy. This likely also contributes to the discrepancies between the predicted and measured values of the scaling exponents. In addition, there is no obvious reason why the accuracy of this approximation should improve for larger systems and, consequently, the scaling predictions for the free energy functions are not expected to be accurate in the limit of large system size.
The presence of crowding agents was generally found to decrease the overlap free energy, in accord with one previous result.27 This was observed in cases of both infinite- and finite-length confinement tubes, with the exception of the limiting case of very short tubes. This effect appears to arise from the tendency for crowding to compress the polymers along the tube axis: such polymer compression increases the crowder translational entropy by an amount that more than offsets the loss in polymer conformational entropy. Thus, the translational freedom of the crowders is likely to be greatest when the polymers overlap. Decreasing the crowder diameter from to at constant packing fraction results in a slight reduction in the overlap free energy and an increase in the extension length. These results are somewhat surprising given previous measurements showing that depletion forces between monomers are enhanced by such a reduction in crowder size. This effect may be due to the simultaneous enhancement of depletion forces between the polymer and the confining wall, which was shown can lead to a regime in which the polymer extension increases with .43, 45
While our investigation of the scaling properties of the overlap free energy functions have provided a reasonably complete picture for the case of polymers in the absence of crowding, the examination of crowding effects presented here requires much further study. In particular, it will be useful to carry out a thorough characterization of the effect of varying the crowder size over a much wider range of parameter space than that considered here. In addition, it will be useful to examine the effects of crowding agent polydispersity,43 a feature that is clearly relevant to biological cells.
This work was supported by the Natural Sciences and Engineering Research Council of Canada (NSERC). We are grateful to the Atlantic Computational Excellence Network (ACEnet), Westgrid and Compute Canada for use of their computational resources.
References
- Daoud and De Gennes 1977 M. Daoud and P. De Gennes, J. Phys. (Paris), 1977, 38, 85–93.
- Ha and Jung 2015 B.-Y. Ha and Y. Jung, Soft Matter, 2015, 11, 2333–2352.
- Jun and Mulder 2006 S. Jun and B. Mulder, P. Natl. Acad. Sci. USA, 2006, 103, 12388–12393.
- Jun and Wright 2010 S. Jun and A. Wright, Nat. Rev. Microbiol., 2010, 8, 600–607.
- Youngren et al. 2014 B. Youngren, H. J. Nielsen, S. Jun and S. Austin, Genes & development, 2014, 28, 71–84.
- Le Chat and Espéli 2012 L. Le Chat and O. Espéli, Mol. Microbiol., 2012, 86, 1285–1290.
- Yazdi et al. 2012 N. H. Yazdi, C. C. Guet, R. C. Johnson and J. F. Marko, Mol. Microbiol., 2012, 86, 1318–1333.
- Kuwada et al. 2013 N. J. Kuwada, K. C. Cheveralls, B. Traxler and P. A. Wiggins, Nucleic Acids Res., 2013, 41, 7370–7377.
- Di Ventura et al. 2013 B. Di Ventura, B. Knecht, H. Andreas, W. J. Godinez, M. Fritsche, K. Rohr, W. Nickel, D. W. Heermann and V. Sourjik, Mol. Syst. Biol., 2013, 9, 686.
- Junier et al. 2014 I. Junier, F. Boccard and O. Espéli, Nucleic Acids Res., 2014, 42, 1461–1473.
- Lampo et al. 2015 T. J. Lampo, N. J. Kuwada, P. A. Wiggins and A. J. Spakowitz, Biophys. J., 2015, 108, 146–153.
- Reyes-Lamothe et al. 2012 R. Reyes-Lamothe, E. Nicolas and D. J. Sherratt, Annu. Rev. Genet., 2012, 46, 121–143.
- Wang et al. 2013 X. Wang, P. M. Llopis and D. Z. Rudner, Nat. Rev. Genet., 2013, 14, 191–203.
- Badrinarayanan et al. 2015 A. Badrinarayanan, T. B. Le and M. T. Laub, Annu. Rev. Cell Dev. Biol., 2015, 31, 171–199.
- Hajduk et al. 2016 I. V. Hajduk, C. D. Rodrigues and E. J. Harry, Semin. Cell Dev. Biol., 2016, pp. 2–9.
- Liu et al. 2018 Z. Liu, X. Capaldi, Y. Zhang, C. Vargas, R. Reyes-Lamothe and W. Reisner, Bull. Am. Phys. Soc., 2018.
- Teraoka and Wang 2004 I. Teraoka and Y. Wang, Polymer, 2004, 45, 3835–3843.
- Jun et al. 2007 S. Jun, A. Arnold and B.-Y. Ha, Phys. Rev. Lett., 2007, 98, 128303.
- Arnold and Jun 2007 A. Arnold and S. Jun, Physical Review E, 2007, 76, 031901.
- Jacobsen 2010 J. L. Jacobsen, Phys. Rev. E, 2010, 82, 051802.
- Jung and Ha 2010 Y. Jung and B.-Y. Ha, Phys. Rev. E, 2010, 82, 051926.
- Jung et al. 2012 Y. Jung, C. Jeon, J. Kim, H. Jeong, S. Jun and B.-Y. Ha, Soft Matter, 2012, 8, 2095–2102.
- Jung et al. 2012 Y. Jung, J. Kim, S. Jun and B.-Y. Ha, Macromolecules, 2012, 45, 3256–3262.
- Liu and Chakraborty 2012 Y. Liu and B. Chakraborty, Phys. Biol., 2012, 9, 066005.
- Dorier and Stasiak 2013 J. Dorier and A. Stasiak, Nucleic Acids Res., 2013, 41, 6808–6815.
- Račko and Cifra 2013 D. Račko and P. Cifra, J. Chem. Phys., 2013, 138, 184904.
- Shin et al. 2014 J. Shin, A. G. Cherstvy and R. Metzler, New J. Phys., 2014, 16, 053047.
- Minina and Arnold 2014 E. Minina and A. Arnold, Soft Matter, 2014, 10, 5836–5841.
- Minina and Arnold 2015 E. Minina and A. Arnold, Macromolecules, 2015, 48, 4998–5005.
- Chen et al. 2015 Y. Chen, W. Yu, J. Wang and K. Luo, J. Chem. Phys., 2015, 143, 134904.
- Polson and Montgomery 2014 J. M. Polson and L. G. Montgomery, J. Chem. Phys., 2014, 141, 164902.
- Pelletier et al. 2012 J. Pelletier, K. Halvorsen, B.-Y. Ha, R. Paparcone, S. J. Sandler, C. L. Woldringh, W. P. Wong and S. Jun, P. Natl. Acad. Sci. USA, 2012, 109, E2649–E2656.
- Kim et al. 2013 J. Kim, C. Jeon, H. Jeong, Y. Jung and B.-Y. Ha, Soft Matter, 2013, 9, 6142–6150.
- Humphrey et al. 1996 W. Humphrey, A. Dalke and K. Schulten, J. Mol. Graphics, 1996, 14, 33–38.
- Frenkel and Smit 2002 D. Frenkel and B. Smit, Understanding Molecular Simulation: From Algorithms to Applications, Academic Press, London, 2nd edn, 2002.
- Polson et al. 2013 J. M. Polson, M. F. Hassanabad and A. McCaffrey, J. Chem. Phys., 2013, 138, 024906.
- Polson and McCaffrey 2013 J. M. Polson and A. C. McCaffrey, J. Chem. Phys., 2013, 138, 174902.
- Polson and Dunn 2014 J. M. Polson and T. R. Dunn, J. Chem. Phys., 2014, 140, 184904.
- Polson 2015 J. M. Polson, J. Chem. Phys., 2015, 142, 174903.
- Polson et al. 2017 J. M. Polson, A. F. Tremblett and Z. R. McLure, Macromolecules, 2017, 50, 9515–9524.
- Jun et al. 2008 S. Jun, D. Thirumalai and B.-Y. Ha, Phys. Rev. Lett., 2008, 101, 138101.
- Escobedo 1996 F. A. Escobedo, Molec. Phys., 1996, 89, 1733–1754.
- Kim et al. 2015 J. Kim, C. Jeon, H. Jeong, Y. Jung and B.-Y. Ha, Soft Matter, 2015, 11, 1877–1888.
- Jeon et al. 2016 C. Jeon, Y. Jung and B.-Y. Ha, Soft matter, 2016, 12, 9436–9450.
- Jeon et al. 2017 C. Jeon, Y. Jung and B.-Y. Ha, Sci. Rep., 2017, 7, 11896.