∎
22email: {giovanni.pau;mario.collotta;vincenzo.maniscalco}
@unikore.it 33institutetext: K.K.R.Choo44institutetext: Department of Information Systems and Cyber Security and Department of Electrical and Computer Engineering, University of Texas at San Antonio, San Antonio, TX 78249-0631, USA
44email: raymond.choo@fulbrightmail.org
A Fuzzy-PSO System for Indoor Localization based on Visible Light Communications
Abstract
Indoor positioning systems using Visible Light Communication (VLC) have potential applications in smart buildings, for instance, in developing economical, easy-to-use, widely accessible positioning system based on Light Emitting Diodes (LEDs). Thus using VLCs, we introduce a new fuzzy-based system for indoor localization in this paper. The system processes data from transmitters (i.e., anchor nodes) and delivers the calculated position of a receiver. A Particle Swarm Optimization (PSO) technique is then employed to obtain the optimal configuration of the proposed Fuzzy Logic Controllers (FLCs). Specifically, the proposed PSO technique optimizes the membership functions of the FLCs by adjusting their range to achieve the best results regarding the localization reliability. We demonstrate the utility of the proposed approach using experiments.
Keywords:
Visible light communications indoor localization received signal strength indication fuzzy logic controller particle swarm optimization1 Introduction
Light emitting diodes (LEDs), known for their illumination efficiency, eco-friendliness, and durability (lifetime) (Li et al, 2016c), are semiconductors that can be simply modulated and used in communication systems (Pau et al, 2017b). Visible light communication (VLC) using white LEDs is also increasingly popular since they can operate as lighting and communications systems simultaneously (Pathak et al, 2015; Pergoloni et al, 2016; Schmid et al, 2016; Zhang et al, 2015). Such communication is also carried out in the license-free spectrum and produces no electromagnetic interference. Besides, VLC can be adopted in particularly sensitive areas (Mostafa and Lampe, 2015), such as airplanes and hospitals. Not surprisingly, LED-based VLCs have been proposed for sensing networks (Tahmasi et al, 2016), illumination (Li et al, 2016b), intelligent transportation systems (Ucar et al, 2016), broadcasting (Song et al, 2015), and many other applications.
A trend in recent years is to ensure indoor location systems including self-sufficient robot management (Wang et al, 2016; Prorok and Martinoli, 2011), position identification (Chen et al, 2016), and location-based services (Shin et al, 2015; Bordel et al, 2017; Ishida et al, 2016). For instance, there are several localization and positioning systems proposed in the literature, such as those based on GPS (Gowdayyanadoddi et al, 2015), RFID (Zhao et al, 2017), infrared (Vidal and Lin, 2016), ultrasound (Hammoud et al, 2016), WLAN (Khalajmehrabadi et al, 2016), Bluetooth (Gu and Ren, 2015) and other approaches (Yassin et al, 2016). However, GPS may not be fit-for-purpose in indoor situations due to multipath fading (e.g., caused by objects and surfaces) and power attenuation. Indoor positioning systems based on RFID, ultrasound, WLAN, infrared, and Bluetooth also have several constraints, such as electromagnetic interference, requiring the installation of new infrastructures (Majeed and Zia, 2017), low certainty, relatively slow responses, and low security. Multipath propagation issues also affect these systems; thus, it is particularly challenging to ascertain the direction or the distance of the transmitter from the obtained signal. Hence, the development of innovative strategies based on existing networks is of high importance.
One particular solution is to design indoor positioning systems based on VLC (Pathak et al, 2015; Yi et al, 2015), using the light released by LEDs (Lou et al, 2012). LED-based positioning approaches are usually economical, easy-to-use, and can be integrated into indoor localization systems. Existing VLC-based indoor positioning approaches are briefly summarized as follow:
-
•
Scene Analysis and Proximity (fingerprinting): Fingerprinting can be applied to the VLC, i.e., the gathering of necessary information, followed by the second measurement before a real-time comparison. This technique is simple and does not require complicated processing. However, it requires a large amount of relevant information to be collected. If such information is not available, then it would lead to inaccurate estimates. This approach has been applied in visible-light beacons indoor positioning Qiu et al (2016), where a correlation-based technique is employed to decompose light signals and to obtain fingerprints. Subsequently, the authors used a localization framework to improve the precision. A comparison is carried out with other localization systems and the findings suggested that the authors’ proposed (fingerprinting-based) solution does not always allow achieve the best performance.
-
•
Time Difference of Arrival (TDOA): Each LED uses a specific frequency, and by applying appropriate band-pass filters at the receiver, it is possible to detect each of them. The TDOA method is based on the same principle of the Time of Arrival (TOA) approach (Wang et al, 2013). In the latter, the time required for a signal to arrive from a transmitter to a receiver is measured, and its distance is then calculated. Unlike TOA (that computes the propagation delay between the receiver and each transmitter), TDOA exploits the difference in propagation time between them to estimate the distance between the transmitters (whose coordinates are already known). In this case, it is necessary that only the transmitters have to be synchronized and not the receivers. A TDOA approach was proposed in Jung et al (2011) to estimate the target position by using LED ceiling lamps. The authors explained that their system can potentially be used for future indoor positioning in environments with ceiling composed of LEDs light. In a later work, Nah et al (2013) improved the approach presented in Jung et al (2011) incorporating measurement uncertainty generated by Additive White Gaussian Noise to achieve better accuracies. While TDOA method may be an appropriate solution in some contexts, it is not an optimal choice for economic LED positioning. Other approaches based on Phase Difference of Arrival (PDOA) (Sackenreuter et al, 2016) can also be used for VLC positioning, but they also suffer from the same limitations.
-
•
Angle of Arrival (AOA): AOA is defined as the angle between the propagation path of a wave (with its incidence) and a direction of reference, which is identified as orientation. This approach has been applied in Eroglu et al (2015); Prince and Little (2015), where the authors in both works introduced new efficient and low-complexity solutions, by using VLC, for the localization of devices in indoor environments. Both findings suggested that a localization with a precision of the order of a meter could be achieved.
-
•
Image positioning: These techniques usually employ image sensors to capture images of LEDs (Huynh and Yoo, 2016). Then, the position of the image sensor is estimated considering the correlation between the 3D coordinates of LEDs (that are known) and the 2D coordinates of LEDs in the obtained image(s) (Huynh et al, 2015; Li et al, 2016a).
-
•
Received Signal Strength (RSS): The distance is estimated from the information on the pulses received from the various transmitters (Jung et al, 2013). A method based on RSS measures was proposed by Biagi et al (2015). In this method, each LED has its carrier to reduce interference between the LEDs, while the receiver determines the distance by measuring the RSS of the LED light and, finally, estimates the position. In Yang et al (2014), the authors also presented an indoor positioning method that employs a single LED array and many tilted optical receivers. Three-dimensional positioning is achieved by managing the RSS. Another indoor localization system, by utilizing VLC, for mobile robots was proposed by Sharifi et al (2016). In this case, the positioning is obtained by employing a multi-frequency method with the RSS to estimate the distance between a robot and each LED. Findings appear to be promising. Thus, RSS-based approaches can be a viable support for indoor positioning and localization based on VLC.
In this paper, an innovative fuzzy-based localization system by using VLC is presented. Specifically, the proposed approach extends the concept of trilateration without the need to solve several equations required for determining the location of a receiver. A fuzzy-based solution is chosen, since it has been demonstrated in the literature to be a viable approach for indoor localization (Li et al, 2016a; Jung et al, 2013; Biagi et al, 2015). Furthermore, the application of Fuzzy Logic Controllers (FLCs) facilitates the development of control procedures with multi-criteria. Fuzzy logic is also capable of performing real-time choices, while traditional control systems often rely on an exact description of the controlled environment that is not usually available. Considering that fuzzy logic methods can efficiently manage the linguistic rules, they can be attractive for a diverse range of applications such as indoor localization. At the time of this research, there is no solution in the literature where a VLC-based indoor localization system is supported using fuzzy logic controllers. This is the focus of this paper.
In the proposed VLC-based indoor localization system, the environment map is discretized in a reference grid; subsequently, a fuzzy-based approach is applied for anchor weighting and, finally, these weights are summed. We adopt the Particle Swarm Optimization (PSO) to achieve the best parameters and values of the fuzzy-based system. In particular, PSO is used to optimize the membership functions of the Fuzzy Logic Controller, by adjusting their range. PSO, an evolutionary computation method (Kennedy and Eberhart, 1995), is recognized as a valid heuristic technique for optimization problems in multidimensional and continuous research spaces. It has also been shown that the PSO technique can be used to achieve high-quality solutions while minimizing the computational load (Wang and Liu, 2015; Chen and Chiou, 2015; Chou et al, 2013; Collotta et al, 2017; Pau et al, 2017a), unlike stochastic methods such as the genetic algorithms. Although PSO has been used in FLCs optimization, we are not aware of any existing work using PSO in a VLC-based indoor localization system.
2 The Proposed Solution
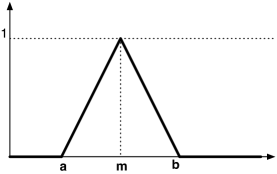
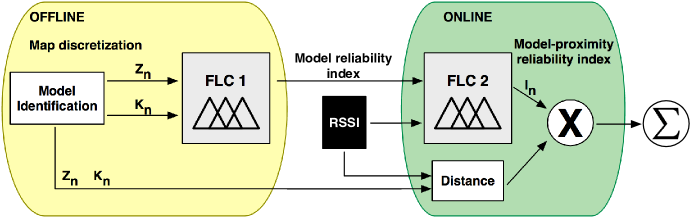
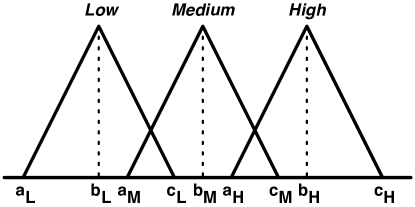
The proposed system is defined by the architecture represented in Figure 1, and consists of two phases, namely: offline training and online localization, where a fuzzy inference system is employed. In the proposed system, triangular membership functions are chosen for the parameters in the fuzzy inference system. Let be the general variable. Every membership function can be described by a general triangular-shaped mathematical description as follow:
| (1) |
where is a lower limit, is upper limit and a value, with (Figure 2). The operation of both stages, depicted in Figure 1, is described in the following subsections.
2.1 Offline Stage
The main aim of the offline stage is to determine the parameters of the RSSI-distance equation, of which a simplified version, taking into account irradiance angles of the light sources and the incident angles, is the following (Narzullaev et al, 2011; Baldini et al, 2016):
| (2) |
where the is estimated in power ratio while is the distance (in meters) between the receiver node and the beacon. Obviously, as in all RSSI-based approaches, even the one proposed in this paper assumes that the communication is in LOS (Line of Sight). It is required to obtain the values of and parameters. To this end, the least squares technique is taken into account in this paper. The map of the environment is arranged into square cells with a side equal to . A specific value is assigned to every single cell, and its initialization value is . In the proposed solution, for each cell (,), the range (,) between the center of the cell and the anchor , whose positions are known, is estimated.
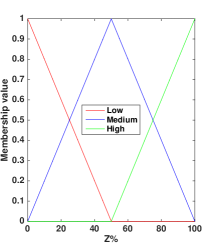
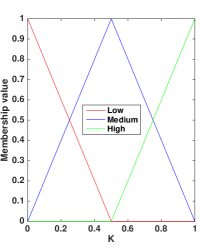
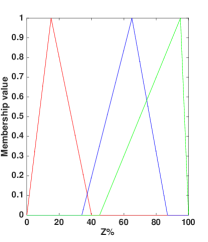
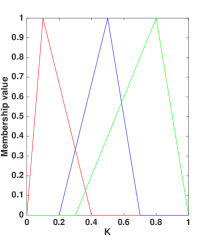
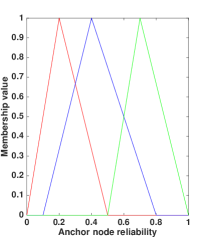
Besides, the goal of the offline stage is to ascertain a (pre-)weighting parameter, closely related to modeling and estimating of accuracy, faulty localization, and reliability of each anchor employed in the map of the environment. In fact, this cumulative reliability index is obtained as the output of a Fuzzy Logic Controller (FLC). On the contrary, the input parameters are and , which are organized in 3 fuzzy sets with triangular membership functions. They represent the various levels of correlation between each parameter and its theoretical value. It is necessary to note that this typical value is determined by measuring the median of each earned value of and . The membership functions of and are pictured in Figure 3, where the membership is outlined by normalized values []. Furthermore, considering the equation 1, the different values of the variables are shown in Table 1. The output value of the FLC 1, reported in Table 2, is determined by 9 fuzzy rules and represents the model reliability index, fluctuating from to . For instance, if is Medium and is High then the output value is .
| Input Variable | Linguistic term | a | m | b |
| Z% | Low | 0 | 0 | 50 |
| Medium | 0 | 50 | 100 | |
| High | 50 | 100 | 100 | |
| K | Low | 0 | 0 | 0.5 |
| Medium | 0 | 0.5 | 1 | |
| High | 0.5 | 1 | 1 |
| K | ||||
| Low | Medium | High | ||
| Z% | Low | 0.03 | 0.06 | 0.15 |
| Medium | 0.25 | 0.45 | 0.75 | |
| High | 0.65 | 0.85 | 1 | |
2.2 Online Stage
In the proposed system, when it is necessary to locate an undiscovered node placed at the center of a generic cell in the environment map, the value related to each cell denotes an evaluation of the error that may affect the localization mechanism. The main aim is to obtain an aggregate value for each cell and, in the end, select the cell with the smallest value. To this end, the overall map of errors is realized by subsequent steps, calculated for each anchor node and for every cell:
-
1.
gathering and filtering: in this first step, the RSSI values obtained by the beacon are computed. It is necessary to note that in the proposed solution just the values less than the 25th percentile (absolute value) are considered due to multiple reflections and multi-paths. In fact, the lower values of signals could be received due to larger paths and, as a consequence, they are not important because could lead to a wrong estimation of the true distance. Besides, the threshold of the 25th percentile has been chosen as a heuristic solution because it can represent a worthwhile trade-off between the number of values to be filtered and the total number of take-overs. As a result, in a general indoor environment, this pre-filtering step enhances the precision of the received signal.
-
2.
estimating of distance: in the second step, the distance between the unknown node and the beacon () is estimated ().
-
3.
development of error map: in the third step, for each cell, the value is associated with it to develop an error map coupled to the anchor (Figure 4). It is useful to remark that is the Euclidean distance between the center of the cell and the anchor .
-
4.
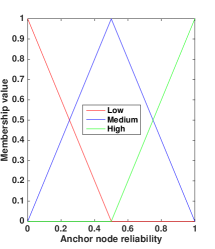
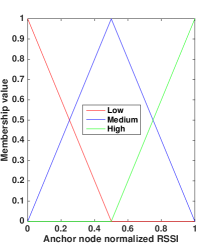
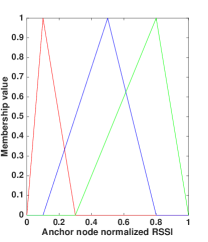
weighting: the final step consists in weighting. In fact, the fuzzy reliability index, called , is computed to scale the map. is the output value of the FLC 2, as shown in Figure 1, while its input parameters are the reliability index (measured in the previous phase) and a proximity index determined as follows:
(3) where the value obtained by the anchor node is confronted with the biggest value acquired by the unknown node. The input parameters of the FLC 2 are subdivided into 3 fuzzy sets (with triangular membership functions) and are shown in Figure 5, where the membership is realized by normalized values []. Furthermore, even in this case, considering the equation 1, the different values of the variables are presented in Table 3. Finally, the output of the FLC 2, reported in Table 4, is determined by 9 fuzzy rules and represents the model total reliability index, ranging from to . For instance, if Anchor node reliability is High and Anchor node normalized RSSI is Low then the output value () is .
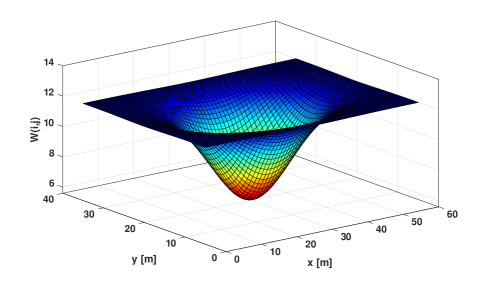
Now, it is possible to outline the the equation of the map, that is the following:
(4) Regarding the cells, the indexes that decrease at the minimum the error are:
(5) An example of the function is depicted in Figure 6. Finally, the coordinates of the position are provided as follows:
(6) where , i.e. the side of the cell, is a project parameter because it is chosen in the implementation phase.
|
Linguistic term | a | m | b | ||
|---|---|---|---|---|---|---|
| Anchor node reliability | Low | 0 | 0 | 0.5 | ||
| Medium | 0 | 0.5 | 1 | |||
| High | 0.5 | 1 | 1 | |||
| Anchor node normalized RSSI | Low | 0 | 0 | 0.5 | ||
| Medium | 0 | 0.5 | 1 | |||
| High | 0.5 | 1 | 1 |
| Anchor node normalized RSSI | ||||
| Low | Medium | High | ||
| Anchor node reliability | Low | 0.001 | 0.3 | 0.7 |
| Medium | 0.01 | 0.4 | 0.9 | |
| High | 0.3 | 0.6 | 1 | |
3 FLC optimization through PSO
Particle Swarm Optimization technique reproduces the actions of crowds of animals to generate the best (or near best) solutions for a function with a specific goal in a constant search domain. PSO consists in a population-based method where a swarm of particles goes in the research domain. The positions of this swarm of particles designate the applicant solutions of the considered problem. The performance of each particle is strictly related to its position. Its value is determined by a cost function associated with the examined optimization issue. Usually, the opening condition of every single particle is randomly produced. Subsequently, through several iterations, the progress of the particles in the search domain is affected by the present best position, named personal best position. Moreover, it depends further on the present best position of the whole particles, denominated global best position. As a starting point, it is necessary to consider an individual swarm with a size equals to K. Furthermore, this swarm is fully connected in a N-dimensional research domain. It is possible to determine and refresh the position and velocity of every single particle as follows:
| (7) |
| (8) |
It is necessary to note that and , while and are the position and velocity vectors of the k-th particle at the t-th time step respectively. Moreover, is the individual best position of the k-th particle at the t-th time step, is the global best position in the entire swarm of particles at the t-th time step; and are causal numbers organized in a uniform way in the range . Finally, the last parameters to introduce are w, i.e. the inertia weight, and and , that are the cognitive coefficients. It is useful to highlight that w is employed to achieve a scale of the research domain and performs an essential function in PSO convergence performance. There are various methods of estimating this parameter. However, in most of them, and also in this paper, it can be adjusted to a constant value to decrease the computational load of the algorithm.
The velocity of every single particle, as reported in the eq. 7, is adjusted taking into account the inertial component, i.e. its current velocity, the social component, and the cognitive component. All these parameters are strictly related to the personal best and global best position. The Algorithm 1 represents the pseudo-code of the Particle Swarm Optimization Algorithm introduced in this work. As it is possible to note, in the initial phase the swarm is analyzed and elaborated, initializing the position and velocity of every single particle randomly. Subsequently, the evaluation of the cost function for each particle is carried out. This procedure is performed to achieve the global best position in the swarm. In the next step of the algorithm, the position and velocity of all the particles of the swarm are updated continuously taking into account not only the equations 7 and 8 but also the cost function, which is evaluated from time to time. A direct consequence of this mechanism is the upgrade of both the personal and the global best position. In the end, the cycle is terminated if the finish rule is fulfilled. The output of the algorithm, i.e. the solution, consists of the global best position at the last iteration.
3.1 Particle Swarm Optimization Algorithm
The architecture of the FLC 1 is depicted in Figure 3. As it is possible to note the inputs of the controller are and , while the output is represented by the model reliability index. On the contrary, in the FLC 2, depicted in Figure 5, the controller inputs are the Anchor node reliability and the Anchor node normalized RSSI, while the output is represented by . In both cases, the number of the membership functions is 3 (i.e. Low, Medium, High) for both inputs and outputs. Consequently, as depicted in Tables 2 and 4, the amount of the fuzzy inference rules is 9. As mentioned above, triangular membership functions are taken into account in the approach introduced in this paper, and the goal is to optimize them through the Particle Swarm Optimization. The membership functions can be expressed as in Figure 7. In this paper, the optimization must be simple and should not involve a large computational load. For this reason, it is defined that the parameters , and , for both inputs and outputs, are fixed. As a consequence, the PSO algorithm has to optimize 18 membership functions parameters. The arrangement of a general particle, for both inputs and outputs, is defined as follows:
| (9) |
Examining the Figure 7, it is necessary to specify that in the PSO algorithm introduced in this paper the 6 parameters considered for the optimization of both inputs and outputs need to satisfy not only the following rules but also in the itemized order:
| (10) |
In the operation of the PSO algorithm, all the constraints, shown in eq. 10, must be checked in each repetition. Nevertheless, in this paper, the PSO is supported by a proportional method with the aim to decrease the computational cost in such a way to enhance the convergence speed. It is valuable to examine the n-th position of the k-th particle at the t-th iteration to understand the proposed PSO algorithm. The next limitation must be met:
| (11) |
where the limitations and have previously been refreshed considering the sequence presented in eq. 10. Furthermore, it is helpful to remark that, if necessary, just one of them can be changed.
The key phases of the PSO algorithm presented in this work are the following:
-
1.
if the interval does not contain the the position , then the latter is determined proportionally as follows:
if , then(12) else if , then
(13) -
2.
the velocity is refreshed based on the equation 7. It is useful to highlight that, in the context analyzed in this work, the velocity n-th of the k-th particle at the (t+1)-th iteration is the following:
(14) where and are determined ad follows:
(15) (16) -
3.
the position is refreshed based on the equation 8. If the interval interval does not contain the position , at first, the minimum and the maximum values of the velocity are estimated based on the equation 15 and 16, and, subsequently, the position is estimated proportionally as follows:
if , then
(17) else if , then
(18)
3.2 Particle Swarm Optimization Performance
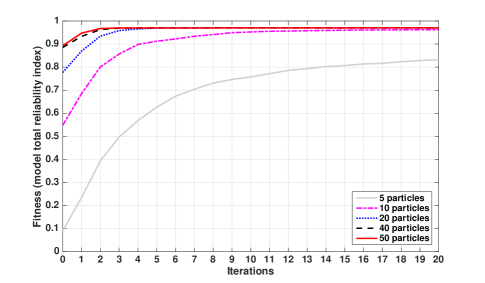
The performance of the suggested Particle Swarm Optimization method is addressed in this section. For the sake of simplicity, only the performance of the PSO related to the FLC 2 is shown. The inputs of the FLC 2 (Figure 1) are the Anchor node reliability and the Anchor node normalized RSSI, while the output is the model total reliability index. This value has been considered as the fitness function. As a consequence, the Particle Swarm Optimization algorithm has been implemented to obtain its maximum value. The Particle Swarm Optimization performance has been analyzed taking into account swarms with different sizes, i.e. . Figure 8 presents the model total reliability index reached by Particle Swarm Optimization method presented in this paper. The values, obtained through simulations carried out with Matlab, have been averaged over executions for iterations. It is beneficial to perceive that, in each simulation, the algorithm has been initialized randomly, the cognitive coefficients have been established to , the value of the inertia weight has been , and the state of iterations has been considered as the the end check. The achieved results show that the performance of the proposed algorithm is enhanced by enlarging the swarm concerning size. In fact, the simulation by using , and achieves the convergence, i.e. the maximum value, after about iterations. However, it is useful to perceive that the PSO algorithm developed with holds a greater speed, regarding the achievement of the convergence (i.e. iterations), compared to smaller sized swarms. In fact, examines in the best way the research domain by treating further particles in every single iteration.
4 Performance Evaluation
A testbed scenario, composed of different LED lamps and an optical receiver, was developed to validate the proposed fuzzy-based solution optimized through the PSO algorithm. The lamps used in the testbed had 18 white LEDs to provide illumination of 60 lux. The LED (NBL-R3W) has a viewing angle of 30 degrees, and the standard light power is 5.0 cd. The LED lamps used in the testbed scenario were managed by an 8-bit microcontroller (ATmega128). The receiver used a low-cost photodiode (SFH-213) to estimate the intensity of the light source. The radiant sensitive area of the photodiode is while the half angle is degree. The measures were obtained by persisting seconds in each position, both in offline and online stages (Figure 1), in an environment whose area is . In other words, between and anchor nodes (LED lamps) were used. In each experimental scenario, different and known positions were chosen. Moreover, the performance of the proposed fuzzy-based solution was then compared with those of MinMax, Maximum Likelihood and Trilateration.
Several measurements were conducted both to validate the method presented in this paper, i.e. indoor localization through VLC, and, principally, to examine the various solutions of the Particle Swarm Optimization by diversifying the swarm size regarding the number of the particles. As mentioned before, the goal of the PSO method is to optimize both FLCs regarding their membership functions, modifying their range. It is essential to examine the membership functions presented in Figures 3 and 5 to determine the run time of the PSO. These membership functions were statically assigned for both FLCs (Section 2). Using PSO, the results achieved using particles and iterations are shown in Figure 9. In this case, the range of the membership functions was considerably varied compared to those depicted in Figures 3 and 5. Nevertheless, in almost all cases, PSO offers better performance. For simplicity, we presented the range of the membership functions achieved with particles and iterations since these values yielded the best performance.
4.1 Findings
Statistical metrics and the the Cumulative Distribution Function (CDF) (Baldini et al, 2016; Luo et al, 2011) of localization error were taken into account when evaluating the performance. The CDF () of a localization error , where denotes a probability density function, is defined as follows:
| (19) |
In fact, considering the CDF of localization error, it is feasible to determine the localization error at an assigned confidence level (for instance , , ). The performance of three popular methods (i.e. MinMax, Maximum Likelihood, and Trilateration) were also evaluated. We remark the performance on load and computational complexity is not included in this paper since the setting does not influence the algorithmic complexity (Liu et al, 2007).
| Algorithm | AE | ME | SD |
|---|---|---|---|
| MinMax | 1.94 | 1.91 | 1.21 |
| Maximum Likelihood | 2.03 | 1.97 | 1.24 |
| Trilateration | 2.28 | 2.05 | 1.31 |
| Fuzzy without PSO | 1.88 | 1.78 | 0.99 |
| Fuzzy-PSO: 5 particles | 1.97 | 2.02 | 1.23 |
| Fuzzy-PSO: 10 particles | 1.71 | 1.65 | 1.01 |
| Fuzzy-PSO: 20 particles | 1.44 | 1.33 | 0.85 |
| Fuzzy-PSO: 40 particles | 0.95 | 0.67 | 0.57 |
| Fuzzy-PSO: 50 particles | 0.75 | 0.43 | 0.35 |
For every record of the obtained data at a target position, the algorithms were applied to determine the position and to compare this value with its real value for error evaluation. The achieved performance of the localization approaches is shown in Table 5. The proposed fuzzy solution (with and without the PSO) was able to achieve better performance, in comparison to the other three algorithms, in terms of Average Error (AE), Median Error (ME) and Standard Deviation (SD). In detail, the excellent outcomes are obtained by employing the Particle Swarm Optimization considering a swarm with more than particles. This is because of the use of the triangular membership functions determined by the PSO with particles. We also determined that any more than particles will offer only modest improvement, particularly if more than particles are used.
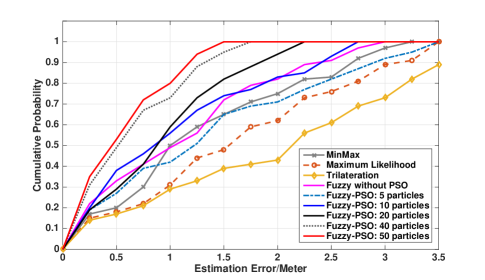
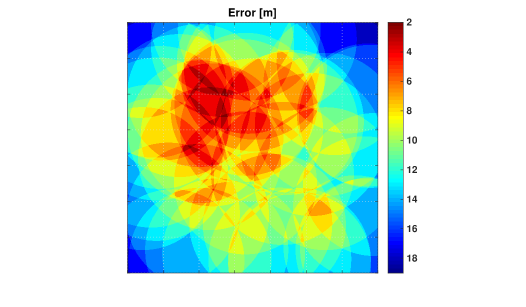
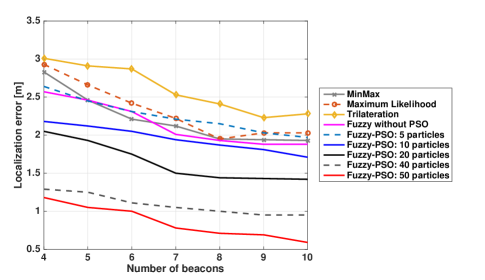
Figure 10 shows the cumulative probability function of the estimation error in the four algorithms. Analyzing the results depicted in Figure 10, it is clear that the proposed fuzzy solution outperformed MinMax, Maximum Likelihood, and Trilateration algorithms. For instance, the estimation error of the fuzzy-PSO with particles was less than those of MinMax, Maximum Likelihood, and Trilateration, at both and confidence levels. In fact, the estimation of Error/Meter could be at most equal to meters. This value (i.e. the maximum for fuzzy-PSO with particles) is satisfactory in a environment. On the contrary, with particles in the PSO, the worst performance, compared to the use of a greater number of particles, were obtained. However, in all other cases, even without PSO, the performance were always better than those achieved with MinMax, Maximum Likelihood, and Trilateration. It is necessary to highlight that the average error fluctuated based on the number of beacons, as depicted in Figure 11. In fact, there is a clear error reduction when the number of anchors increased from to , and when there is a large beacon density, the improvement is almost negligible. Our findings echoed those in the literature (i.e. an improvement in precision with a major density) (Choa et al, 2008; Lin et al, 2008).
5 Conclusions
In this paper, a novel solution for the indoor localization, based on the combined use of Fuzzy Logic and Visible Light Communications, was introduced. We demonstrated via a real testbed scenario that the proposed system can achieve optimal FLCs parameters due to the optimization of membership functions. In fact, their range can be adjusted to produce optimal localization reliability. In our approach, we also applied PSO technique.
Future research includes expanding the scope of the evaluation, such as the number of algorithms to be compared against and a broader set of environmental configurations.
Compliance with ethical standards
Conflict of interest All authors declare that they have no conflict of interest.
Ethical standard This article does not contain any studies with human participants or animals performed by any of the authors.
References
- Baldini et al (2016) Baldini A, Ciabattoni L, Felicetti R, Ferracuti F, Longhi S, Monteriu A, Freddi A (2016) A novel rssi based approach for human indoor localization: The fuzzy discrete multilateration. In: 2016 IEEE 6th International Conference on Consumer Electronics - Berlin (ICCE-Berlin), pp 249–252, DOI 10.1109/ICCE-Berlin.2016.7684767
- Biagi et al (2015) Biagi M, Pergoloni S, Vegni AM (2015) Last: A framework to localize, access, schedule, and transmit in indoor vlc systems. Journal of Lightwave Technology 33(9):1872–1887
- Bordel et al (2017) Bordel B, Alcarria R, Manso MA, Jara A (2017) Building enhanced environmental traceability solutions: From thing-to-thing communications to generalized cyber-physical systems. Journal of Internet Services and Information Security (JISIS) 7(3):17–33
- Chen et al (2016) Chen C, Han Y, Chen Y, Liu KJR (2016) Indoor global positioning system with centimeter accuracy using wi-fi [applications corner]. IEEE Signal Processing Magazine 33(6):128–134
- Chen and Chiou (2015) Chen SM, Chiou CH (2015) Multiattribute decision making based on interval-valued intuitionistic fuzzy sets, pso techniques, and evidential reasoning methodology. IEEE Transactions on Fuzzy Systems 23(6):1905–1916
- Choa et al (2008) Choa YK, Youn JH, Pham N (2008) Performance tests for wireless real-time localization systems to improve mobile robot navigation in various indoor environments. Robotics and Automation in Construction, InTech pp 355–372
- Chou et al (2013) Chou HH, Hsu LY, Hu HT (2013) Turbulent-pso-based fuzzy image filter with no-reference measures for high-density impulse noise. IEEE Transactions on Cybernetics 43(1):296–307
- Collotta et al (2017) Collotta M, Pau G, Maniscalco V (2017) A fuzzy logic approach by using particle swarm optimization for effective energy management in iwsns. IEEE Transactions on Industrial Electronics PP(99):1–1, DOI 10.1109/TIE.2017.2711548
- Eroglu et al (2015) Eroglu YS, Guvenc I, Pala N, Yuksel M (2015) Aoa-based localization and tracking in multi-element vlc systems. In: 2015 IEEE 16th Annual Wireless and Microwave Technology Conference (WAMICON), pp 1–5
- Gowdayyanadoddi et al (2015) Gowdayyanadoddi NS, Broumandan A, Lachapelle G, Curran JT (2015) Indoor gps positioning using a slowly moving antenna and long coherent integration. In: 2015 International Conference on Location and GNSS (ICL-GNSS), pp 1–6
- Gu and Ren (2015) Gu Y, Ren F (2015) Energy-efficient indoor localization of smart hand-held devices using bluetooth. IEEE Access 3:1450–1461
- Hammoud et al (2016) Hammoud A, Deriaz M, Konstantas D (2016) Robust ultrasound-based room-level localization system using cots components. In: 2016 Fourth International Conference on Ubiquitous Positioning, Indoor Navigation and Location Based Services (UPINLBS), pp 11–19
- Huynh and Yoo (2016) Huynh P, Yoo M (2016) Vlc-based positioning system for an indoor environment using an image sensor and an accelerometer sensor. Sensors (Switzerland) 16(6), DOI 10.3390/s16060783
- Huynh et al (2015) Huynh P, Lee J, Yoo M (2015) An indoor environment vlc-based localization algorithm for handset devices. In: 2015 Seventh International Conference on Ubiquitous and Future Networks, pp 139–140
- Ishida et al (2016) Ishida T, Shinotsuka Y, Iyobe M, Uchida N, Sugita K, Shibata Y (2016) Development of a zoo walk navigation system using the positional measurement technology and the wireless communication technology. Journal of Internet Services and Information Security (JISIS) 6(4):65–84
- Jung et al (2011) Jung SY, Hann S, Park CS (2011) Tdoa-based optical wireless indoor localization using led ceiling lamps. IEEE Transactions on Consumer Electronics 57(4):1592–1597
- Jung et al (2013) Jung SY, Choi CK, Heo S, Lee S, Park CS (2013) Received signal strength ratio based optical wireless indoor localization using light emitting diodes for illumination. pp 63–64, DOI 10.1109/ICCE.2013.6486796
- Kennedy and Eberhart (1995) Kennedy J, Eberhart C (1995) Particle swarm optimization. In: IEEE International Conference on Neural Networks, pp 1942–1948
- Khalajmehrabadi et al (2016) Khalajmehrabadi A, Gatsis N, Akopian D (2016) Structured group sparsity: A novel indoor wlan localization, outlier detection, and radio map interpolation scheme. IEEE Transactions on Vehicular Technology PP(99):1–1
- Li et al (2016a) Li D, Huang W, Xu Z (2016a) Flicker free indoor visible light positioning system assisted by a filter and mobile phone camera. In: 2016 IEEE/CIC International Conference on Communications in China (ICCC), pp 1–5
- Li et al (2016b) Li S, Pandharipande A, Willems FMJ (2016b) Unidirectional visible light communication and illumination with leds. IEEE Sensors Journal 16(23):8617–8626
- Li et al (2016c) Li S, Tan SC, Lee CK, Waffenschmidt E, (Hui SY, Tse CK (2016c) A survey, classification, and critical review of light-emitting diode drivers. IEEE Transactions on Power Electronics 31(2):1503–1516
- Lin et al (2008) Lin TH, Ng IH, Lau SY, Chen KM, Huang P (2008) A microscopic examination of an rssi-signature-based indoor localization system. In: The Fifth Workshop on Embedded Networked Sensors, pp 2–6
- Liu et al (2007) Liu H, Darabi H, Banerjee P, Liu J (2007) Survey of wireless indoor positioning techniques and systems. IEEE Transactions on Systems, Man, and Cybernetics, Part C (Applications and Reviews) 37(6):1067–1080
- Lou et al (2012) Lou PH, Zhang HM, Lang K, Yao MY, Xu ZY (2012) A location-based services system using indoor visible light sources. Guangdianzi Jiguang/Journal of Optoelectronics Laser 23(12):2298–2303
- Luo et al (2011) Luo X, O’Brien WJ, Julien CL (2011) Comparative evaluation of received signal-strength index (rssi) based indoor localization techniques for construction jobsites. Advanced Engineering Informatics 25(2):355 – 363
- Majeed and Zia (2017) Majeed A, Zia T (2017) Multi-layer network architecture for supporting multiple applications in wireless sensor networks. Journal of Wireless Mobile Networks, Ubiquitous Computing, and Dependable Applications (JoWUA) 8(3):36–56
- Mostafa and Lampe (2015) Mostafa A, Lampe L (2015) Physical-layer security for miso visible light communication channels. IEEE Journal on Selected Areas in Communications 33(9):1806–1818
- Nah et al (2013) Nah JHY, Parthiban R, Jaward MH (2013) Visible light communications localization using tdoa-based coherent heterodyne detection. In: 2013 IEEE 4th International Conference on Photonics (ICP), pp 247–249
- Narzullaev et al (2011) Narzullaev A, Park Y, Yoo K, Yu J (2011) A fast and accurate calibration algorithm for real-time locating systems based on the received signal strength indication. {AEU} - International Journal of Electronics and Communications 65(4):305 – 311
- Pathak et al (2015) Pathak PH, Feng X, Hu P, Mohapatra P (2015) Visible light communication, networking, and sensing: A survey, potential and challenges. IEEE Communications Surveys Tutorials 17(4):2047–2077
- Pau et al (2017a) Pau G, Collotta M, Maniscalco V (2017a) Bluetooth 5 energy management through a fuzzy-pso solution for mobile devices of internet of things. Energies 10(7)
- Pau et al (2017b) Pau G, Collotta M, Tirrito S, Caponetto R (2017b) An innovative approach for the management of cross-coupling interference in street lighting networks. Journal of Wireless Mobile Networks, Ubiquitous Computing, and Dependable Applications 8(2):44–63
- Pergoloni et al (2016) Pergoloni S, Biagi M, Colonnese S, Cusani R, Scarano G (2016) Optimized leds footprinting for indoor visible light communication networks. IEEE Photonics Technology Letters 28(4):532–535
- Prince and Little (2015) Prince G, Little T (2015) Latency constrained device positioning using a visible light communication two-phase received signal strength - angle of arrival algorithm. In: 2015 International Conference on Indoor Positioning and Indoor Navigation, IPIN 2015
- Prorok and Martinoli (2011) Prorok A, Martinoli A (2011) A reciprocal sampling algorithm for lightweight distributed multi-robot localization. pp 3241–3247, DOI 10.1109/IROS.2011.6048639
- Qiu et al (2016) Qiu K, Zhang F, Liu M (2016) Let the light guide us: Vlc-based localization. IEEE Robotics Automation Magazine 23(4):174–183
- Sackenreuter et al (2016) Sackenreuter B, Hadaschik N, Fa binder M, Mutschler C (2016) Low-complexity pdoa-based localization. In: 2016 International Conference on Indoor Positioning and Indoor Navigation (IPIN), pp 1–6
- Schmid et al (2016) Schmid S, Richner T, Mangold S, Gross T (2016) Enlighting: An indoor visible light communication system based on networked light bulbs. In: 2016 13th Annual IEEE International Conference on Sensing, Communication, and Networking, SECON 2016
- Sharifi et al (2016) Sharifi H, Kumar A, Alam F, Arif KM (2016) Indoor localization of mobile robot with visible light communication. In: 2016 12th IEEE/ASME International Conference on Mechatronic and Embedded Systems and Applications (MESA), pp 1–6
- Shin et al (2015) Shin H, Chon Y, Kim Y, Cha H (2015) A participatory service platform for indoor location-based services. IEEE Pervasive Computing 14(1):62–69
- Song et al (2015) Song J, Ding W, Yang F, Yang H, Yu B, Zhang H (2015) An indoor broadband broadcasting system based on plc and vlc. IEEE Transactions on Broadcasting 61(2):299–308
- Tahmasi et al (2016) Tahmasi A, Hematkhah H, Kavian YS (2016) Visible light communication based optical link for data transmission in wireless sensor networks. In: 2016 10th International Symposium on Communication Systems, Networks and Digital Signal Processing (CSNDSP), pp 1–6
- Ucar et al (2016) Ucar S, Turan B, Ergen SC, Ozkasap O, Ergen M (2016) Dimming support for visible light communication in intelligent transportation and traffic system. In: NOMS 2016 - 2016 IEEE/IFIP Network Operations and Management Symposium, pp 1193–1196
- Vidal and Lin (2016) Vidal J, Lin CY (2016) Simple and robust localization system using ceiling landmarks and infrared light. In: 2016 12th IEEE International Conference on Control and Automation (ICCA), pp 583–587
- Wang et al (2016) Wang S, Li Y, Sun Y, Li X, Sun N, Zhang X, Yu N (2016) A localization and navigation method with orb-slam for indoor service mobile robots. In: 2016 IEEE International Conference on Real-time Computing and Robotics (RCAR), pp 443–447
- Wang and Liu (2015) Wang SC, Liu YH (2015) A pso-based fuzzy-controlled searching for the optimal charge pattern of li-ion batteries. IEEE Transactions on Industrial Electronics 62(5):2983–2993
- Wang et al (2013) Wang T, Sekercioglu Y, Neild A, Armstrong J (2013) Position accuracy of time-of-arrival based ranging using visible light with application in indoor localization systems. Journal of Lightwave Technology 31(20):3302–3308, DOI 10.1109/JLT.2013.2281592
- Yang et al (2014) Yang SH, Kim HS, Son YH, Han SK (2014) Three-dimensional visible light indoor localization using aoa and rss with multiple optical receivers. Journal of Lightwave Technology 32(14):2480–2485
- Yassin et al (2016) Yassin A, Nasser Y, Awad M, Al-Dubai A, Liu R, Yuen C, Raulefs R (2016) Recent advances in indoor localization: A survey on theoretical approaches and applications. IEEE Communications Surveys Tutorials PP(99):1–1
- Yi et al (2015) Yi K, Kim D, Yi K (2015) Development of a localization system based on vlc technique for anindoor environment. Journal of Electrical Engineering and Technology 10(1):436–442, DOI 10.5370/JEET.2015.10.1.436
- Zhang et al (2015) Zhang R, Wang J, Wang Z, Xu Z, Zhao C, Hanzo L (2015) Visible light communications in heterogeneous networks: Paving the way for user-centric design. IEEE Wireless Communications 22(2):8–16
- Zhao et al (2017) Zhao Y, Liu K, Ma Y, Gao Z, Zang Y, Teng J (2017) Similarity analysis-based indoor localization algorithm with backscatter information of passive uhf rfid tags. IEEE Sensors Journal 17(1):185–193