Time resolved imaging of the non-linear bullet mode within an injection-locked nano-contact spin Hall nano-oscillator
Abstract
Time-resolved scanning Kerr microscopy (TRSKM) has been used to image precessional magnetization dynamics excited by a DC current within a nano-contact (NC) spin Hall nano-oscillator (SHNO). Injection of a radio frequency (RF) current was used to phase lock the SHNO to the TRSKM. The out of plane magnetization was detected by means of the polar magneto optical Kerr effect (MOKE). However, longitudinal MOKE images were dominated by an artifact arising from the edges of the Au NCs. Time resolved imaging revealed the simultaneous excitation of a non-linear ‘bullet’ mode at the centre of the device, once the DC current exceeded a threshold value, and ferromagnetic resonance (FMR) induced by the RF current. However, the FMR response observed for sub-critical DC current values exhibits an amplitude minimum at the centre, which is attributed to spreading of the RF spin current due to the reactance of the device structure. This FMR response can be subtracted to yield images of the bullet mode. As the DC current is increased above threshold, the bullet mode appears to increase in size, suggesting increased translational motion. The reduced spatial overlap of the bullet and FMR modes, and this putative translational motion, may impede the injection locking and contribute to the reduced locking range observed within NC-SHNO devices. This illustrates a more general need to control the geometry of an injection-locked oscillator so that the autonomous dynamics of the oscillator exhibit strong spatial overlap with those resulting from the injected signal.
Within a spin torque oscillator (STO), magnetic auto-oscillations, with MHz to GHz frequencies, are driven by the spin transfer torque (STT) associated with injection of DC spin current. Their frequency and amplitude can be tuned via either the DC electrical bias current or an applied magnetic field, while the magnetoresistance of the constituent materials leads to the generation of voltage oscillations. STOs have strong potential for magnetic sensing, signal processing, and neurmorphic computing applications Stiles and Miltat (2006); Chumak et al. (2015). The ability to lock the frequency and phase of the STO to an injected RF signal is an important property within applications, while arrays of STOs promise increased output power through mutual synchronization. However it is first necessary to understand the character of the underlying magnetization dynamics. More specifically, the dynamics excited by both DC and RF currents must be determined if the conditions required for phase-locking are to be fully understood.
Within a spin Hall nano-oscillator (SHNO) the Spin Hall effect (SHE) Kato et al. (2004); Hoffmann (2013) drives a pure spin current from a heavy metal with large spin-orbit interaction into a ferromagnet layer Demidov et al. (2012); Brataas et al. (2012); Dumas et al. (2014). The de-coupling of charge and spin currents opens up new device geometries, for example enabling exploitation of magnetic insulatorsHamadeh et al. (2014), and in the present study, allows optical access to the active region of the device.
The generation of magnetic auto-oscillations requires a critical spin current density to be exceeded. Within the SHNO the injected charge current is concentrated within a small region of the heavy metal, either by overlaying thick needle-shaped nano-contacts (NCs) on the heavy metal layer ,Demidov et al. (2012, 2014a); Liu et al. (2013); Ranjbar et al. (2014); Ulrichs et al. (2014); Giordano et al. (2014) or by forming a nanoconstriction within the heavy metal/ ferromagnet bilayerDemidov et al. (2014b); Awad et al. (2016); Kendziorczyk and Kuhn (2016); Mazraati et al. (2016); Zahedinejad et al. (2017); Divinskiy et al. (2017). SHNOs of both kinds have been studied by Brillouin Light Spectroscopy (BLS), microwave spectroscopy and micro-magnetic simulations. While the spectral characteristics of the dynamics have been explored, the time-dependent magnetization has not been measured directly.
Here time resolved scanning Kerr microscopy (TRSKM)Gangmei et al. (2011); Valkass et al. (2016a); Keatley et al. (2017, 2016) is used to study NC-SHNO devices. The response to both a radio frequency (RF) current , and a DC current when phase-locked to an injected , are observed. The source of the contrast observed in longitudinal and polar magneto optical Kerr effect (MOKE) measurements is first explained, before the spatial character of the magnetization dynamics induced by RF and DC currents is determined. Finally, the implications for effective injection locking and optimisation of the device geometry will be discussed.
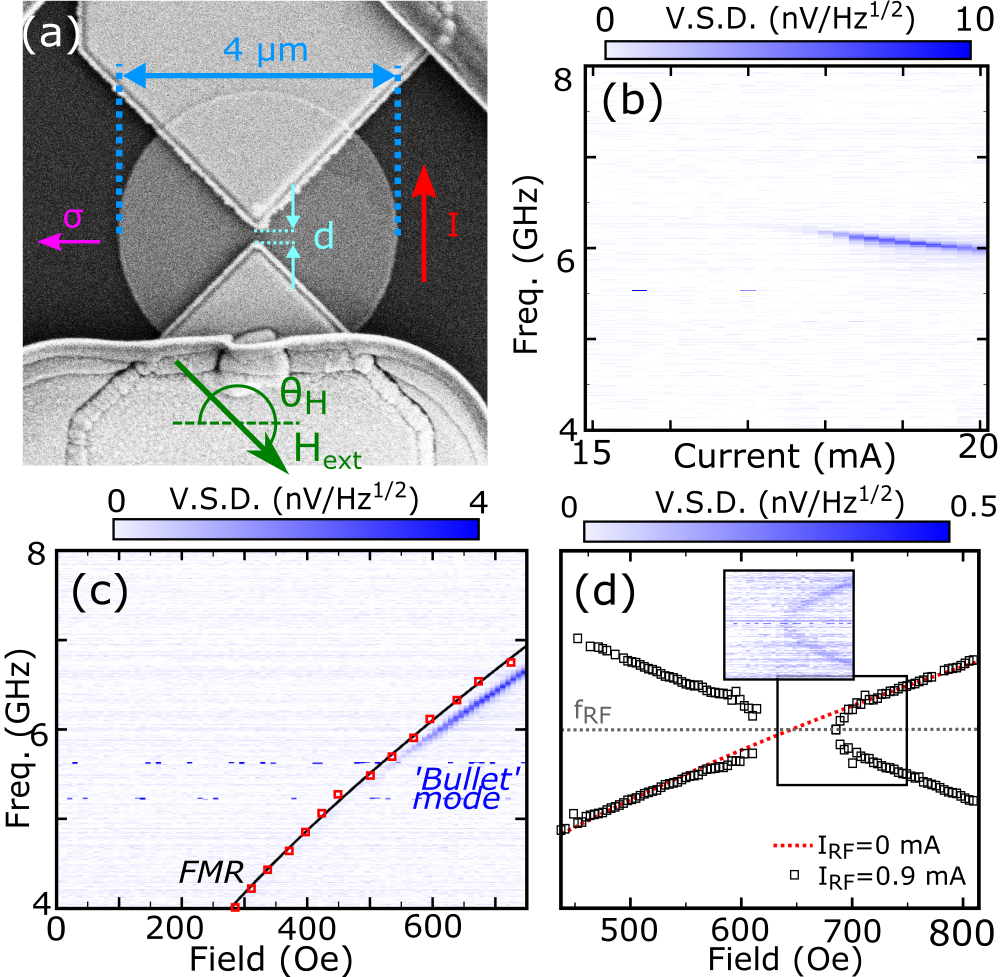
NC-SHNOs were fabricated by a combination of sputter deposition and electron-beam lithography. A 4 Py(5 nm)/Pt(6 nm) bi-layer disk was first defined upon a substrate, before two triangular Au(150 nm) NCs, with tip separation , were overlaid as shown in Figure 1(a). The NCs are intended to concentrate electrical current within the Pt at the NC tips. The charge current generates a spin current, via the SHE, that propagates from the Pt into the Py. Once the STT compensates the damping, a self-localized non-linear spin wave ”bullet” mode is formed. While other modes can be supported within the disk, e.g. propagating waves when the Py is magnetized normal to the plane,Giordano et al. (2014) the bullet mode is of particular interest due to its narrow linewidth and tuneable frequency.
Initial microwave electrical measurements were performed by connecting a selected device to a bias-tee. The inductive and capacitative arms were used to supply and respectively, while the RF signal from the device was directed into a spectrum analyzer via a circulator and +24 dB pre-amplifier. Stroboscopic TRSKM measurements were performed with a vector quadrant bridge detector that exploits different magneto optical Kerr effect (MOKE) geometries to simultaneously detect the three spatial components of the dynamic magnetization and the optical reflectance Valkass et al. (2016b). The dynamics must be synchronized, via the injected , to an exact multiple of the 80 MHz repetition rate of the laser within the TRSKM. The phase of is then adjusted relative to the laser pulses so that the time evolution of the magnetization dynamics can be observed. Measurements were performed with phase modulation of to enhance the signal to noise ratio. The laser pulses had 800 nm wavelength, and were focused to a spot of 870 nm FWHM diameter by a microscope objective with 10.1 mm working distance and 0.55 numerical aperture Keatley et al. (2017).
Electrical measurements were performed to identify the bullet mode and confirm locking to . Figure 1(b) shows emission from a NC-SHNO with = 240 nm when exceeds 18 mA. The frequency red-shifts with increasing , while no emission is observed if the sign of either or is changed, in agreement with the expected symmetry of the SHE. Figure 1(c) shows the field and frequency dependence of both the Ferromagnetic Resonance (FMR) , determined from separate STT-FMR measurements (consistent with previous work Liu et al. (2011, 2013)), and the microwave emission from the same device with = 180 nm. The FMR frequency has been fitted to the well known formula where 2.80 MHz/Oe with = 2, and = 604 50 emu/cm3. For a given frequency, microwave emission is observed at a field close to but greater than that of the FMR mode. The dependence of the frequency upon and is consistent with previous observations of the bullet mode Ulrichs et al. (2014).
Figure 1(d) shows locking of a bullet mode of 6 GHz frequency to an injected of the same frequency for a device with = 200 nm. As is decreased from its maximum value, the frequency of emission is “pulled” towards 6 GHz, where it remains within the locking range. Due to the smaller signal amplitude, the pulling is not seen at the lower end of the locking range. Within the locking range, increased output power and reduced linewdith occurs, although here it is masked by the residual injected that reaches the spectrum analyzer. An intermodulation mode can also be observed, decreasing in frequency with increasing field. Locking could also be achieved by injection of with frequency of 12 GHz (see supplementary material) but 3.5 mA was required to achieve even a narrow locking range, which has been attributed to thermal noise enhanced by the spin current Demidov et al. (2014a). Therefore TRSKM measurements were performed with the frequency of set to 6 GHz so as to minimise the amplitude of required to achieve locking.
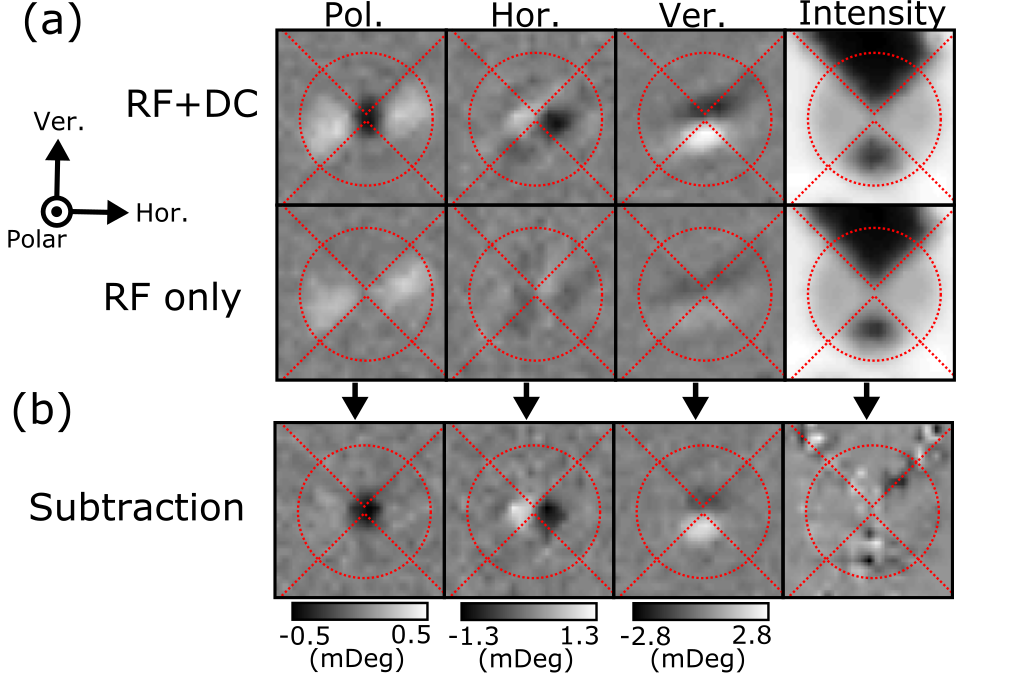
Figure 2(a) shows TRSKM images, of a device with = 200 nm, acquired with the bullet mode locked to , and when is still present but = 0 mA. In the latter case, drives the FMR with detuned from the line centre. The addition of leads to additional dynamics in all three magnetic channels. In the polar channel, localized precession is observed between the NC tips, with a different phase to the dynamics in the extended disk (detailed within the supplementary material). By subtracting the images acquired with and without , the dynamic response due to may be estimated, as shown in Figure 2(b). The subtracted images for the two in-plane (horizontal and vertical) channels each exhibit a spatially antisymmetric structure centred on the peak observed in the polar contrast, but occupying a somewhat larger area of diameter. The subtraction yields negligible residual contrast in the extended region of the disk, confirming that the bullet mode is tightly confined at the centre of the disk.
Further measurements at different time delays confirmed that the contrast in the magnetic channels oscillates with , and with the same relative phase, which is unexpected if the magnetization undergoes a circular or elliptical precession. Furthermore, since is applied 30∘ from the horizontal axis, the amplitude of the dynamic magnetization is expected to be significantly greater in the vertical as compared to the horizontal direction, while in fact these two components were found to have comparable amplitude. To aid the interpretation, micromagnetic simulations were performed, using MuMax 3 after the current distribution and associated Oersted field had been calculated in COMSOL COM ; Vansteenkiste et al. (2014). The magnetization of the permalloy disk was allowed to relax with 1 kOe and before the DC spin current and additional Oersted field were applied.
Images of the simulated bullet mode are presented in Figure 3(a) for the configuration in Figure 2. Initial simulations showed that the bullet quickly escapes the active area and is damped within the extended disk. Therefore a pinning site was introduced in the form of either a single cell discontinuity in the magnetization, or a reduction in saturation magnetization with Gaussian spatial profile of 5% peak value and nm FWHM as in Figure 3(a). This led to a bullet mode that was stable for a finite range of values, as well as an additional mode that was localized in the non-uniform Oersted field associated with the injected charge current. The latter mode lies at higher frequency than the bullet mode, but was not observed in the room temperature electrical measurements of Figure 1, and so is not expected to appear in TRSKM measurements. Both the bullet and field-localized modes were found to have spatial and spectral character consistent with previous simulations Ulrichs et al. (2014); Giordano et al. (2014). The need to pin the bullet may imply that the spin current produces a local reduction of the spontaneous magnetization that is not captured by the present simulations.
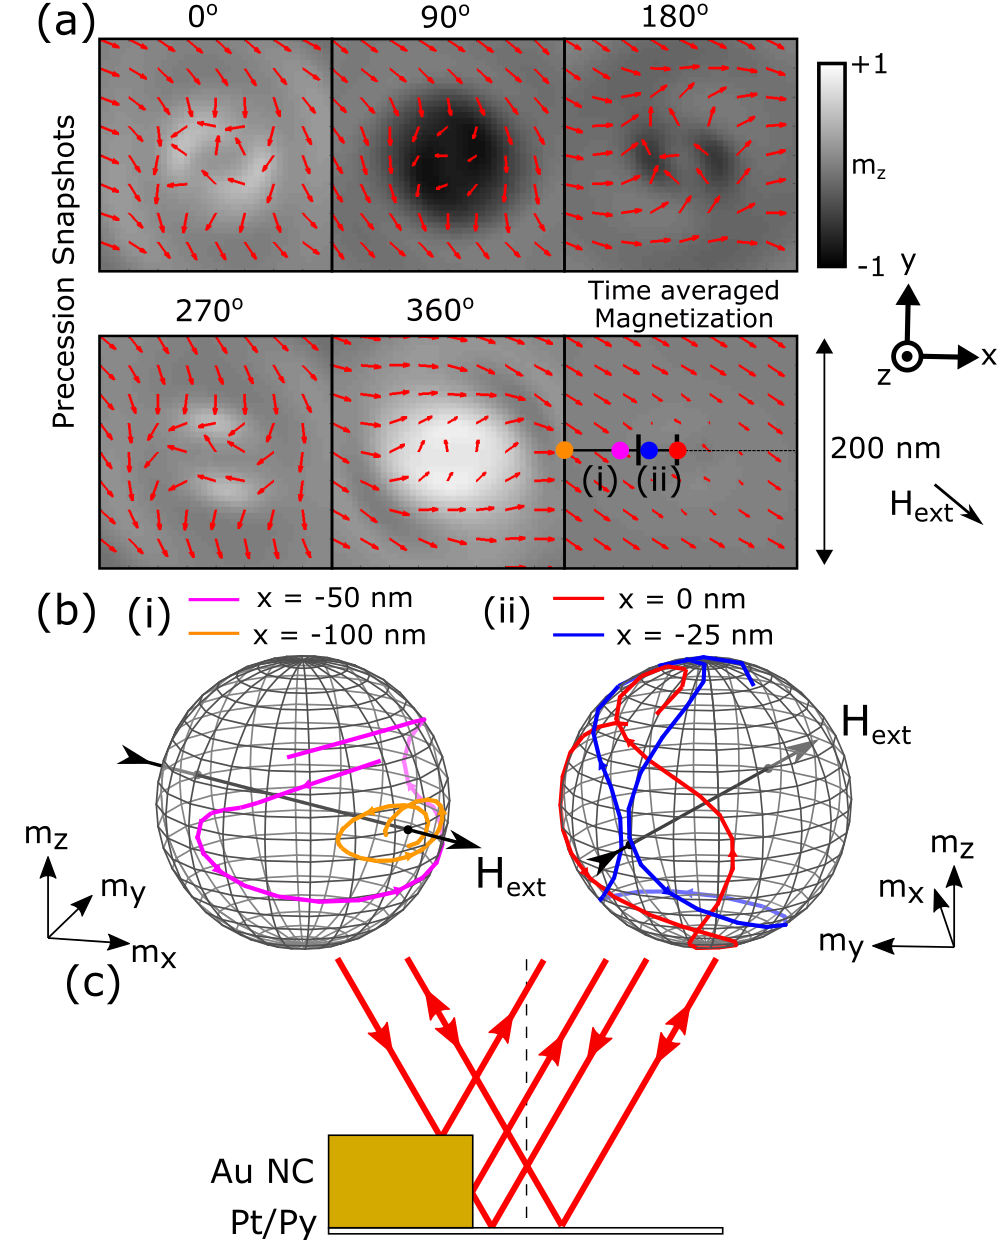
While the bullet mode exhibits large angle precession, the images in Figure 3(a) do not reproduce the spatially antisymmetric character observed in the measured horizontal and vertical components. The core of the bullet mode undergoes the largest angle of precession. Figure 3(b) shows magnetization trajectories at different distances from the center of the disk along the axis, within two regions of interest, (i) outside and (ii) within the core of the bullet mode. The trajectories are plotted for one cycle of the bullet mode. They are not closed because the motion results from a superposition of the bullet mode with the field-localized mode that has a somewhat different frequency. Outside the core region the magnetization undergoes elliptical precession about an axis parallel to the applied field. At the edge of the core region, at nm, the average magnetization is close to zero with an in-plane precession angle of . Within the core the precession amplitude increases further so that the trajectory crosses over itself with the magnetization effectively precessing about a direction anti-parallel to the applied field. The magnetization precesses with the same phase at all positions within the disk. Simulations performed with an additional demonstrated slightly improved stability of the bullet, but otherwise were of similar character.
Difference images, calculated from simulated images separated by in phase, were convolved with a 870 nm FWHM Gaussian profile to more closely reproduce the experimental images. Again they did not reproduce the spatially antisymmetric contrast observed in the vertical and horizontal channels. Further tests showed that the antisymmetric contrast was observed only when the bullet mode was present, ruling out mechanisms such as polarization of the Pt by via the SHE. Therefore the in-plane contrast must be an artefact associated with the optical probe overlapping the edge of the 150 nm thick NCs, while in proximity to the bullet mode. Figure 3(c) provides a schematic representation of the likely mechanism. As the probe passes over the NCs the beam returning to the detector is partially obstructed. Crucially the symmetry between rays propagating in opposite directions within the cone is broken. The resulting difference in intensity of the two halves of the back-reflected beam, combined with a finite polar Kerr rotation due to the bullet mode, manifests as a signal similar to that due to the longitudinal MOKE from an in-plane component of magnetizationKeatley et al. (2006). It follows from the NC geometry that a top-bottom antisymmetry is observed in the vertical channel and a left-right antisymmetry in the horizontal channel.
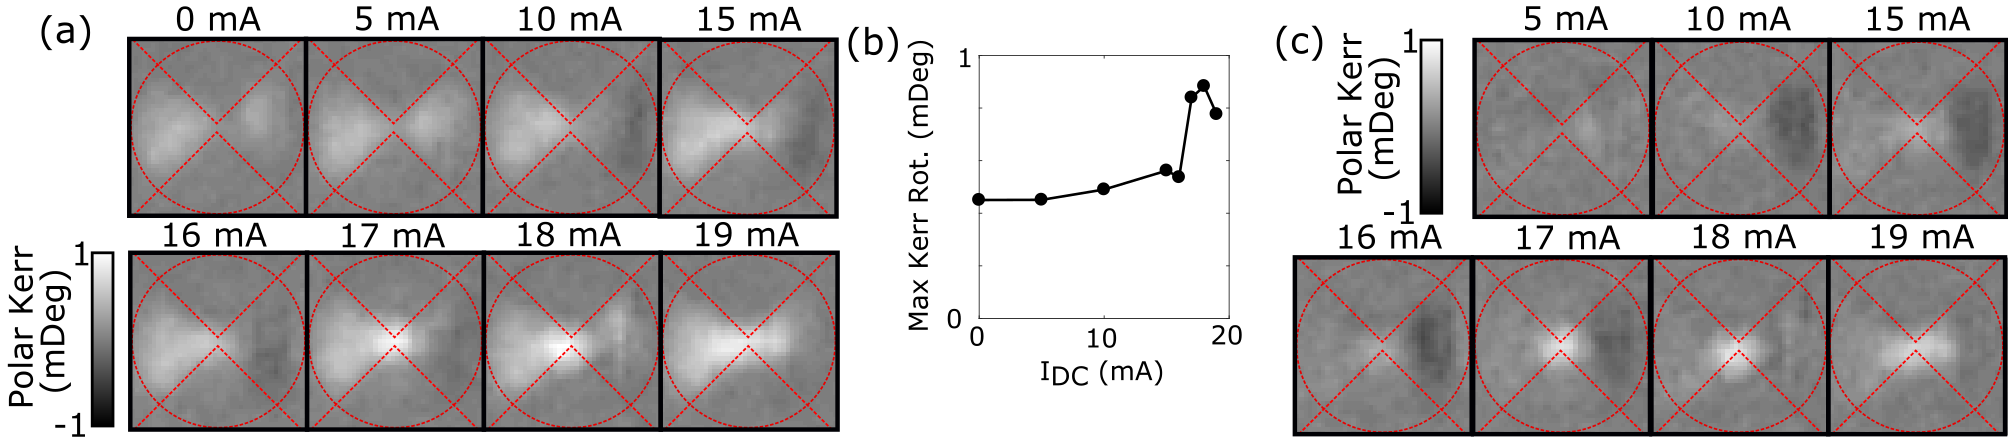
The polar images are unaffected by the artefact. Figure 4(a) shows polar images, of a device with = 240 nm, acquired for different values, with the phase and amplitude of fixed. While the FMR mode is observed throughout the disk for all values, the amplitude of the Kerr rotation at the NC tips is observed to increase markedly for current values in the range 17 to 19 mA. By extracting the maximum absolute Kerr rotation from Figure 4(a), a clear threshold behaviour, characteristic of the bullet mode, can be observed, that is plotted in Figure 4(b). For small values the amplitude of the FMR mode increases gradually with increasing as the injection of DC spin current into the Py layer compensates the damping. In Figure 4(c) the images from Figure 4(a) have been replotted after subtracting the image for which = 0. For mA a region of negative contrast appears to the right of the NCs. The asymmetry of the FMR response about the centre of the device reflects the mixed symmetry of the torques present. The STT and the torque due to the in-plane Oersted field are symmetric about the centre while the torque due to the out of plane Oersted field is antisymmetric Spicer et al. (2018).
The electrical data of Figure 1(b) revealed the presence of a bullet mode for values between 18 and 20 mA. However Figure 4 shows strong out of plane dynamics at the NC tips for = 17 mA, that is still present when = 19 mA. The reduced threshold value of is due to the presence of the , as observed previously Demidov et al. (2014a). Figures 4(a) and (c) also show that the apparent size of the bullet mode depends upon . Comparing the images for values between 17 and 19 mA, the bullet mode appears to occupy a larger region as is increased, with some reduction in the maximum Kerr amplitude. This might be explained by increased phase noise at the centre of the bullet suppressing its peak amplitude and causing its apparent width to increase. However, since the diameter of this region is an order of magnitude greater than that of the simulated bullet mode in Figure 3(a), it seems more likely that the bullet instead develops significant translational motion when phase-locked to .
It is clear from Figures 2(a) and 4(a) that the FMR induced by exhibits a minimum at the centre of the device. A more detailed optically-detected STT-FMR study has confirmed that the torques due to also exhibit a minimum, which is attributed to lateral spreading of due to the reactance of the device. Spicer et al. (2018) The present study shows that the bullet and FMR modes exhibit weak spatial overlap. It is reasonable to expect that the bullet may be pulled towards where the STT arising from is larger, and may exhibit translational motion relative to the centre of the device. The bullet could either establish a stable trajectory, or escape and be damped in the extended disk (see supplementary material), allowing another bullet to form at the centre and repeat the process. Increasing is likely to increase the mobility of the bullet, allowing it to move further from the centre. Since the linewidth of the emission in Figure 1(b) is only weakly dependent on , formation of a stable trajectory seems more likely. Both the lack of spatial overlap of dynamics induced by and , and the translational motion of the bullet, may impede injection locking, and contribute to the NC-SHNO being difficult to lock Demidov et al. (2014a) compared to other STO devices.
In summary, time resolved images of an injection-locked non-linear bullet mode within a NC-SHNO have been obtained. The injected excites a FMR mode that exhibits weak spatial overlap with the bullet mode. The apparent size of the bullet increases with DC current, which is suggested as being due to increased translational motion of the bullet when the RF current is present. Further work is required to determine the trajectory of the bullet. The translational motion and the lack of spatial overlap of the bullet and FMR modes may impeded injection-locking of the NC-SHNO. This illustrates a more general need to control the geometry of injection-locked oscillators so that the autonomous dynamics of the oscillator exhibit strong spatial overlap with those resulting from the injected signal.
Supplementary Material
The supplementary material contains additional microwave spectroscopy and TRSKM datasets, and further details of micromagnetic simulations.
Acknowledgements.
We acknowledge financial support from the Engineering and Physical Sciences Research Council (EPSRC) of the United Kingdom, via the EPSRC Centre for Doctoral Training in Metamaterials (Grant No. EP/L015331/1) and EPSRC grants EP/I038470/1 and EP/P008550/1. The research data supporting this publication are openly available from the University of Exeter’s institutional repository at: https://doi.org/10.24378/exe.923References
- Stiles and Miltat (2006) M. D. Stiles and J. Miltat, Topics in Applied Physics 101, 225 (2006).
- Chumak et al. (2015) A. V. Chumak, V. I. Vasyuchka, A. A. Serga, and B. Hillebrands, Nature Physics 11, 453 (2015).
- Kato et al. (2004) Y. K. Kato, R. C. Myers, a. C. Gossard, and D. D. Awschalom, Science 306, 1910 (2004).
- Hoffmann (2013) A. Hoffmann, IEEE Transactions on Magnetics 49, 5172 (2013).
- Demidov et al. (2012) V. E. Demidov, S. Urazhdin, H. Ulrichs, V. Tiberkevich, A. Slavin, D. Baither, G. Schmitz, and S. O. Demokritov, Nature Materials 11, 1028 (2012).
- Brataas et al. (2012) A. Brataas, A. D. Kent, and H. Ohno, Nature Materials 11, 372 (2012).
- Dumas et al. (2014) R. Dumas, S. Sani, S. Mohseni, E. Iacocca, Y. Pogoryelov, P. Muduli, S. Chung, P. Durrenfeld, and J. Akerman, IEEE Transactions on Magnetics 50, 1 (2014).
- Hamadeh et al. (2014) A. Hamadeh, O. d’Allivy Kelly, C. Hahn, H. Meley, R. Bernard, A. H. Molpeceres, V. V. Naletov, M. Viret, A. Anane, V. Cros, S. O. Demokritov, J. L. Prieto, M. Muñoz, G. de Loubens, and O. Klein, Physical Review Letters 113, 197203 (2014), arXiv:1405.7415 .
- Demidov et al. (2014a) V. E. Demidov, H. Ulrichs, S. V. Gurevich, S. O. Demokritov, V. S. Tiberkevich, a. N. Slavin, A. Zholud, and S. Urazhdin, Nature communications 5, 3179 (2014a).
- Liu et al. (2013) R. H. Liu, W. L. Lim, and S. Urazhdin, Physical Review Letters 110, 147601 (2013).
- Ranjbar et al. (2014) M. Ranjbar, P. Durrenfeld, M. Haidar, E. Iacocca, M. Balinskiy, T. Q. Le, M. Fazlali, A. Houshang, A. A. Awad, R. K. Dumas, and J. Akerman, IEEE Magnetics Letters 5, 1 (2014).
- Ulrichs et al. (2014) H. Ulrichs, V. E. Demidov, and S. O. Demokritov, Applied Physics Letters 104, 042407 (2014).
- Giordano et al. (2014) A. Giordano, M. Carpentieri, A. Laudani, G. Gubbiotti, B. Azzerboni, and G. Finocchio, Applied Physics Letters 105, 042412 (2014), arXiv:1407.7655 .
- Demidov et al. (2014b) V. E. Demidov, S. Urazhdin, A. Zholud, A. V. Sadovnikov, and S. O. Demokritov, Applied Physics Letters 105, 172410 (2014b).
- Awad et al. (2016) A. A. Awad, P. Dürrenfeld, A. Houshang, M. Dvornik, E. Iacocca, R. K. Dumas, and J. Åkerman, Nature Physics 13, 292 (2016).
- Kendziorczyk and Kuhn (2016) T. Kendziorczyk and T. Kuhn, Physical Review B - Condensed Matter and Materials Physics 93, 1 (2016).
- Mazraati et al. (2016) H. Mazraati, S. Chung, A. Houshang, M. Dvornik, L. Piazza, F. Qejvanaj, S. Jiang, T. Q. Le, J. Weissenrieder, and J. Åkerman, Applied Physics Letters 109, 242402 (2016).
- Zahedinejad et al. (2017) M. Zahedinejad, A. A. Awad, P. Durrenfeld, A. Houshang, Y. Yin, P. K. Muduli, and J. Akerman, IEEE Magnetics Letters 8, 1 (2017).
- Divinskiy et al. (2017) B. Divinskiy, V. E. Demidov, A. Kozhanov, A. B. Rinkevich, S. O. Demokritov, and S. Urazhdin, Applied Physics Letters 111 (2017), 10.1063/1.4993910.
- Gangmei et al. (2011) P. Gangmei, P. S. Keatley, W. Yu, R. J. Hicken, M. a. Gubbins, P. J. Czoschke, and R. Lopusnik, Applied Physics Letters 99, 2009 (2011).
- Valkass et al. (2016a) R. A. J. Valkass, T. M. Spicer, E. Burgos Parra, R. J. Hicken, M. A. Bashir, M. A. Gubbins, P. J. Czoschke, and R. Lopusnik, Journal of Applied Physics 119, 233903 (2016a).
- Keatley et al. (2017) P. S. Keatley, S. R. Sani, G. Hrkac, S. M. Mohseni, P. Dürrenfeld, J. Åkerman, and R. J. Hicken, Journal of Physics D: Applied Physics 50, 164003 (2017).
- Keatley et al. (2016) P. S. Keatley, S. R. Sani, G. Hrkac, S. M. Mohseni, P. Dürrenfeld, T. H. J. Loughran, J. Åkerman, and R. J. Hicken, Physical Review B 94, 060402 (2016), arXiv:1604.04455 .
- Valkass et al. (2016b) R. A. J. Valkass, T. M. Spicer, E. Burgos Parra, R. J. Hicken, M. A. Bashir, M. A. Gubbins, P. J. Czoschke, and R. Lopusnik, Journal of Applied Physics 119 (2016b), 10.1063/1.4954018.
- Liu et al. (2011) L. Liu, T. Moriyama, D. C. Ralph, and R. A. Buhrman, Physical Review Letters 106, 036601 (2011).
- (26) Comsol 5.2a user manual.
- Vansteenkiste et al. (2014) A. Vansteenkiste, J. Leliaert, M. Dvornik, M. Helsen, F. Garcia-Sanchez, and B. Van Waeyenberge, AIP Advances 4, 107133 (2014), arXiv:1406.7635 .
- Keatley et al. (2006) P. S. Keatley, V. V. Kruglyak, R. J. Hicken, J. R. Childress, and J. A. Katine, Journal of Magnetism and Magnetic Materials 306, 298 (2006).
- Spicer et al. (2018) T. M. Spicer, P. S. Keatley, T. H. J. Loughran, M. Dvornik, A. A. Awad, P. Dürrenfeld, A. Houshang, M. Ranjbar, J. Åkerman, V. V. Kruglyak, and R. J. Hicken, arXiv 1805.00999 , [submitted] (2018).