A Brand-level Ranking System with the Customized Attention-GRU Model††thanks: Deng Cai is the corresponding author
Abstract
In e-commerce websites like Taobao, brand is playing a more important role in influencing users’ decision of click/purchase, partly because users are now attaching more importance to the quality of products and brand is an indicator of quality. However, existing ranking systems are not specifically designed to satisfy this kind of demand. Some design tricks may partially alleviate this problem, but still cannot provide satisfactory results or may create additional interaction cost. In this paper, we design the first brand-level ranking system to address this problem. The key challenge of this system is how to sufficiently exploit users’ rich behavior in e-commerce websites to rank the brands. In our solution, we firstly conduct the feature engineering specifically tailored for the personalized brand ranking problem and then rank the brands by an adapted Attention-GRU model containing three important modifications. Note that our proposed modifications can also apply to many other machine learning models on various tasks. We conduct a series of experiments to evaluate the effectiveness of our proposed ranking model and test the response to the brand-level ranking system from real users on a large-scale e-commerce platform, i.e. Taobao.
1 Introduction


In e-commerce websites such as Taobao, the brand is having a growing impact on customers’ decision of click/purchase Zipser et al. (2016). There are numerous reasons behind this phenomenon. On one hand, users may prefer items with high quality, and brand is a good indicator of product quality. On the other hand, users may have preference bias to certain brands because of the brand image built from brand marketing and campaigns, e.g. basketball fans may prefer clothes under the brand endorsed by NBA stars.
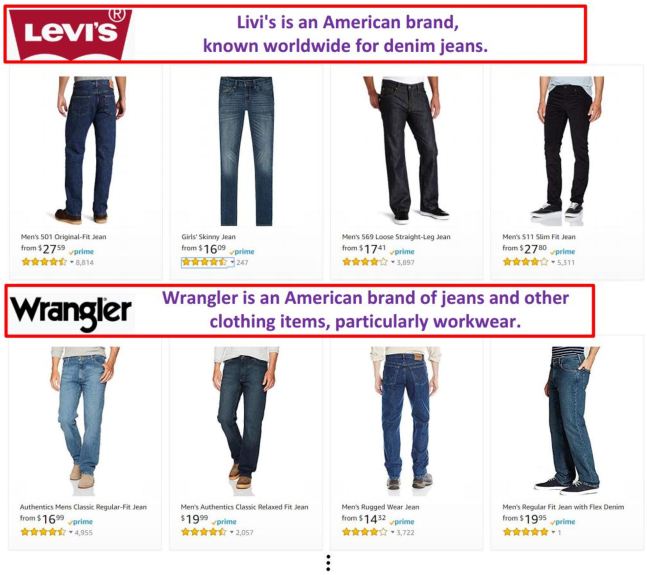
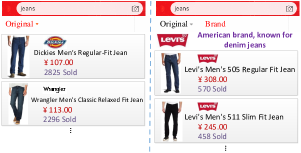
However, as shown in Figure 1(a), the ranking results from most existing retrieval/recommender systems aggregate the items of different brands together. This cannot well satisfy the users with strong preference towards certain brands, since they have to waste time browsing through large numbers of products from other brands. There exist several technical tricks to help with this issue: (1) Set the brand as a feature for the underlying ranking model, and then items with preferred brands would rank in the top of the list. However, items of different brands are still mixed together. (2) Set checkboxes/buttons to filter brands. As shown in Figure 1(b), on the result page of query “jeans”, users can choose to only browse products under brand Levi’s by clicking the checkbox filter for Levi’s. However, only a few brands can be displayed here and there is no personalization. Moreover, users have to click the checkboxes multiple times if they want to browse several brands, which increases the interaction cost and creates negative user experience.
Due to the drawbacks of existing systems mentioned above, we design a new brand-level ranking system, where items of the same brand are grouped together and brand groups are ranked based on users’ brand preference. A demo of our system is demonstrated in Figure 1(c). Jeans are first grouped by brands, e.g. Levi’s and Wrangler. The system will then rank Levi’s at a higher position, if it learns the user prefers Levi’s to Wrangler.
The core of the brand-level ranking system is to solve the personalized brand ranking problem. Various important information in e-commerce websites should be exploited to rank brands. Firstly, features such as brand pricing contribute to brand profiling. Second, the sequential information in user action (click or purchase) sequences and time intervals between actions are valuable in modeling users’ interests on brands Zhu et al. (2017). In addition, different types of actions (click and purchase) reflect users’ different preferences on items (and in turn the corresponding brands), e.g. generally a user purchasing an item indicates he is more interested in the item than if he clicks it. The key challenge is how to well exploit these characteristics of user action sequences for brand ranking. We formulate it as a point-wise ranking problem. Specifically, a classifier is trained based on the various information in e-commerce websites. Then given a user, his probability of preferring each brand is predicted by the classifier and brands are ranked based on their probabilities. Items within the same brand group can be ranked by traditional ranking methods.
Two sub-tasks need to be accomplished for the brand-level ranking system. One is the feature engineering for the brand ranking problem. We propose a series of brand features that are important for brand ranking (details in section 4.1). The other one is the design of the ranking model. We propose an adapted Attention-GRU Chorowski et al. (2015) model to predict users’ probabilities of preferring different brands. RNN (Recurrent Neural Network) methods have achieved state-of-the-art performance in capturing the sequential information in user action sequences Zhu et al. (2017). GRU (Gated Recurrent Unit) Cho et al. (2014) is among the best RNN architectures and the attention mechanism Chorowski et al. (2015) helps to distinguish the influence of different previous actions on the current prediction. Therefore, Attention-GRU is chosen as the base model. We propose three major modifications to Attention-GRU for our task. (1) Combine the heuristically designed brand features and the model-learned brand embedding to better represent the brand. A brand embedding refers to a vector representation for the brand, which is learned from training data by our model Zhu et al. (2016). (2) Consider different types of actions. (3) Integrate the time-gate Zhu et al. (2017) to model time intervals between actions, which can better capture users’ short-term and long-term interests. The effectiveness of our adapted model and the brand-level ranking system is evaluated in our offline and online experiments on a large-scale e-commerce platform. This paper’s contributions are outlined as follows.
-
•
We propose the first brand-level ranking system, which provides explicit personalized brand-level ranking and better helps users to make click/purchase decisions based on their brand preference.
-
•
We perform feature engineering tailored for the brand ranking task and propose an adapted Attention-GRU model as our ranking model. Specifically, we contribute three modifications which effectively improve the model performance.
-
•
We conduct extensive offline and online experiments on a large-scale e-commerce platform. The results and feedbacks from real users prove the effectiveness of our adapted model and the brand-level ranking system.
2 Related Work
2.1 RNN, GRU and Attention-GRU
RNN Elman (1990) has been proved to perform excellently when modeling sequential data. It is formally defined as:
| (1) | |||
| (2) |
where , and are the hidden state, input and output at the -th step. is a non-linear activation function. , and are the corresponding weights learned from training.
GRU Cho et al. (2014) is an important ingredient of RNN architectures, which can avoid the problem of gradient vanishing. It replaces Eq. (1) with:
| (3) | |||
| (4) | |||
| (5) |
where and are the update and reset gates. and are sigmoidal and tanh nonlinearities. , , , , and are the weights. denotes the element-wise product.
Attention-GRU Chorowski et al. (2015) refers to GRU with the attention mechanism. RNN methods with the attention mechanism have been successfully applied to handwriting synthesis Graves (2013), machine comprehension Pan et al. (2017) etc. It typically focuses on the task that generates an output sequence from an input sequence . is often processed by an encoder to output a sequential representation . At the -th step is generated by:
| (6) | |||
| (7) | |||
| (8) | |||
| (9) |
where and are functions. is a vector whose entry indicates the attention weight of the -th input. is called a glimpse Mnih et al. (2014). represents the recurrent activation. In Attention-GRU, the recurrent activation is GRU.
2.2 RNN for Behavior Modeling
Hidasi et al. (2016); Tan et al. (2016) focus on RNN solutions in a session-based setting. Yu et al. (2016) designs an RNN method for the next-basket recommendation. The setting in our task is different from these settings. The Time-LSTM model, proposed in Zhu et al. (2017), equips LSTM Hochreiter and Schmidhuber (1997) with time gates to better capture users’ short-term and long-term interests. We propose that the time gate is a basic component and can be integrated into other RNN architectures (e.g. Attention-GRU in our task).
3 Task Definition and Models’ adaptations
3.1 Task Definition
Let be a set of users and be a set of brands. For each user , his behavior history is defined by , where indicates that generates his -th action (click or purchase) on brand at time . Our task is to predict the probability of generating any type of action on brand at a certain time ().
3.2 Adaptations of Traditional RNN Models
We first transform to . The mathematical representations of , and are denoted as , and , respectively. is defined with two alternative ways: (1) a brand feature vector or (2) a one-hot vector. is defined as a one-hot vector. Since there are two types of actions, i.e. click and purchase, in our task, thus they are represented as [0, 1] and [1, 0], respectively. is set to be a scalar (in seconds). The label is if actually clicks/purchases at time and otherwise.
For Time-LSTM Zhu et al. (2017), the input at each step is the concatenation and . For the other RNN models, the input (i.e. in section 2.1) is the concatenation . For RNN with no attention mechanism, the output (i.e. in Eq. (2)) is a probability distribution over all brands, from which we can obtain . For Attention-GRU, and (i.e. in Eq. (8) when ) in section 2.1 are set to be and , respectively. We replace Eq. (9) with:
| (10) |
where is the weight and is a probability distribution over labels and . is equal to the probability of label . These models are trained by AdaGrad Duchi et al. (2011) with the log loss calculated by and the label.
| CTR (Click-Through Rate) | CVR (Conversion Rate) |
|---|---|
| GMV (Gross Merchandise Volume) | ATIP (Average Transacted Item Price) |
| Search Times | Click Times |
| Add-To-Cart Times | Transaction Times |
4 Proposed System
4.1 Feature Engineering
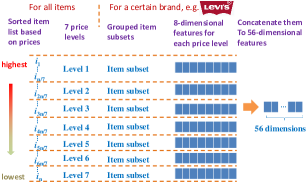
According to the market research conducted by the authors’ company, the price range feature demonstrates great importance in user and brand profiling. Therefore, the brand features are carefully engineered by slicing into 7-level price ranges, with the details as follows (also shown in Figure 2).
(1) All items belonging to a certain category (e.g. “clothing”) are sorted based on their prices. The sorted item list is denoted as . The price for is denoted as . We define price levels as 7 price ranges, with Level 1 = , Level 2 = ,, Level 7 = .
(2) Given a certain brand, items belonging to this brand are grouped based on the price levels defined above. Specifically, an item is grouped to a price level if this item’s price locates in the corresponding price range.
(3) Given a certain brand, 8 most important e-commerce metrics are aggregated within each price level, generating 8-dimensional features for each price level. Features from all 7 price levels are then concatenated into the final 56-dimensional brand features. Specifically, the 8 most important brand-related e-commerce metrics used in this paper is summarized in Table 1111Due to page limit, please refer to the corresponding Wikipedia pages for definitions of CTR, CVR and GMV. ATIP = ..
4.2 The Design of the Ranking Model
An adapted Attention-GRU model is proposed to predict users’ probabilities of preferring different brands.
4.2.1 (1) The Choice of Attention-GRU
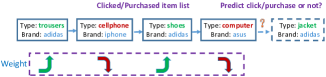
RNN solutions have achieved state-of-the-art performance when modeling users’ sequential actions Hidasi et al. (2016); Zhu et al. (2017). LSTM and GRU are two important ingredients of RNN architectures, both of which are able to avoid the problem of gradient vanishing. Compared to LSTM, GRU can yield comparable performance but has fewer parameters, thus it could train a bit faster and need less data to generalize Chung et al. (2014). Figure 3 is an example to show the motivation to apply the attention mechanism in our task. When we predict whether the user would click/purchase the jacket with the brand Adidas, we want to increase the influence of the first and third items on the prediction since compared to the cellphone and computer, the trousers and shoes are much more related to the jacket. In the attention mechanism, this will be reflected with larger weights on the first and third inputs.
4.2.2 (2) Modifications to Attention-GRU
To achieve better performance, we propose three modifications to Attention-GRU (also explained in Figure 4):
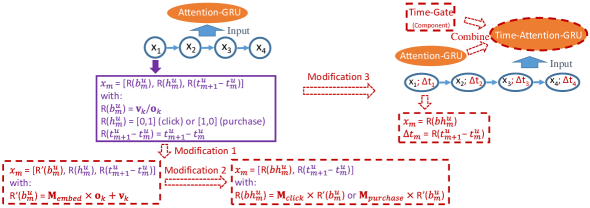
Modification 1: Combining the brand features and brand embedding to better represent the brand
In a traditional Attention-GRU model, the brand can be represented by either a vector consisting of brand features defined in section 4.1, or a one-hot vector based on brand ID. However, the brand features are heuristically designed based on expert experience and may lack some important information useful for the brand ranking task. For example, two brands may have similar brand features but are of different interest for the same user. Using one-hot vectors can explicitly distinguish different brands but lacks the brand content information. Here we propose to combine these two representations. Specifically, following the denotations in section 3.1, assume equals to and the vector consisting of brand features for is denoted as . Its one-hot vector is defined as , with the -th entry equal to and the other entries equal to . Matrix is defined to contain the embeddings of all brands. Then the combined mathematical representation considering both brand features and the brand embedding is defined as , with
| (11) |
is learned from the training data. is used to look up the embedding of from .
We interpret Eq. (11) from three perspectives. (1) Heuristic initialization + Fine tuning. While is heuristically designed, by learning from the training data, we fine tune the brand’s representation to be , which would much better fit our task. (2) Prior information + Posterior modification. This perspective is similar to the first perspective, but in a Bayesian context Berger (2013). Specifically, is obtained based on our “prior” understanding of brands, then the training data enhances our understanding of them and allows us to give “posterior” estimations of their representations. (3) Content information + Collaborative information. contains brands’ content information, while is learned from users’ click/purchase data in our task and thus captures the collaborative information. For some brands that rarely appear in the training data, can provide extra information to help with this “cold-start” situation Wang et al. (2016a, b).
Modification 2: Considering different types of actions
When modeling user behaviors by RNN models, previous works such as Hidasi et al. (2016); Zhu et al. (2017) usually consider single type of action. However, users can perform multiple types of actions on items, e.g. click and purchase. One way to handle different types of actions is to model each of them as a one-hot vector (defined in section 3.2) and concatenate it to our combined brand representation . However, this method allows no feature interaction between and (or implicit interaction by the non-linear activation function), and thus would not well capture the interactive relation between the brand and the type of action performed on the brand Rendle (2012); Chen et al. (2017).
Instead, we propose to define a matrix for each type of action (the total number of action types is usually not large). In our task, we define and for click and purchase, respectively. Then the representation considering both of the brand and the type of action is defined as:
| (12) |
In this way, we explicitly model the interaction between the brand and the type of action by matrix multiplication.
Modification 3: Integrating the time-gate to model time intervals between actions
The time gate in Time-LSTM Zhu et al. (2017) is effective to capture users’ short-term and long-term interests. We propose that the time gate is a basic component and adapt it to our model as follows. A time gate is defined as:
| (13) |
where
| (14) | ||||
and are the weights of and (time intervals), respectively. may be very large, thus we impose a sigmoidal function on . Then we modify Eq. (5) to:
| (15) | ||||
When modeling user behaviors by our model, in Eq. (15) represents the user’s most recent action, thus we can exploit to learn his/her current short-term interest. models this user’s previous actions, thus reflects his/her long-term interest. is helpful in two ways, i.e. (1) is filtered by not only , but also . So can control the influence of on current prediction. (2) is firstly stored in , then transferred to , and would be transferred to . Thus helps to better model users’ long-term interest () by incorporating for later predictions. We denote Attention-GRU with the time gate as Time-Attention-GRU.
It is notable that Modification is rather general and can apply to many machine learning models where the designed features and one-hot vectors exist. Modification can be generalized to handle tasks involving various interaction types with the input. In Modification , we propose that the time gate can be integrated into not only LSTM but also other RNN models, just as how we integrate it into Attention-GRU.
4.2.3 (3) Loss and Training
Similar to Attention-GRU, in our model is obtained from in Eq. (10). We define the loss for user as:
| (16) |
where is if actually generates an action on brand at time . We multiply the loss by () for negative instances because some unlabeled positive instances may be mixed in the training data Pan et al. (2008). Our model is optimized by AdaGrad Duchi et al. (2011).
5 Offline Experiments
5.1 Dataset
A large-scale dataset is collected from Taobao. Specifically, we extract tuples , , , , with each tuple representing that user has an action on brand at time . Users and brands with few interactions are filtered. The final data set in our offline experiments consists of users, brands and actions.
For each user , his/her action sequence is cut into short ones with the length equal to . The first actions form . The brand and timestamp in the last action are assigned to and respectively, serving as the positive instances () in training. The negative instances () are generated by replacing with another random brand.
5.2 Compared Models and Evaluations
Our proposed model, Attention-GRU with three modifications, is denoted as Attention-GRU-3M, and is compared with the following baselines.
GRU: GRU Cho et al. (2014) is among the best RNN architectures. Thus we choose GRU as a representative of the original RNN models.
Attention-GRU: Similarly, Attention-GRU Chorowski et al. (2015) is selected to represent RNN models with the attention mechanism.
Time-LSTM: Time-LSTM Zhu et al. (2017) has achieved state-of-the-art performance for sequential behavior modeling. Thus it would be a competitive baseline in our task.
Session-RNN: Session-RNN Hidasi et al. (2016) exploits RNN to capture users’ short-term interest based on sequential actions within a session. We use the publicly available python implementation222https://github.com/hidasib/GRU4Rec of Session-RNN, with the session identified by timeout Huang et al. (2004).
libFM: Our task can also be treated as a brand recommendation problem. Therefore, many hybrid recommendation methods that simultaneously capture the content and collaborative information can be applied. We use the popular libFM model Rendle (2012) as a representative of these methods.
GRU, Attention-GRU, Time-LSTM and Session-RNN are adapted to our task as described in section 3.2. For libFM, we extract tuples , , , where is if user has an action on brand and otherwise. Then the one-hot vector for , the one-hot vector for and the corresponding brand feature vector are concatenated to be and is in libFM. The number of units is empirically set to 256 for RNN models. The other hyperparameters in all models are tuned via cross-validation or set as in the original paper. Our code is public 333https://github.com/zyody/Attention-GRU-3M.
AUC and F1 score Kim and Leskovec (2013) are used to evaluate the prediction performance of different models.
5.3 Results and Discussions
5.3.1 Model Comparison
As shown in Table 2, our proposed model significantly outperforms all baselines and we attribute it to the adoption of the attention mechanism and three proposed modifications. In comparison, baselines GRU and Session-RNN, exploiting none of these merits, perform the worst. Compared with GRU, Attention-GRU adopts additional attention mechanism and Time-LSTM adopts Modification 3 proposed in section 4.2. Thus, they both outperform GRU and Session-RNN. As a hybrid recommendation approach, libFM captures content and collaborative filtering features at the same time, but fails to capture the sequential information of user behaviors, while our model captures all these information. This explains why libFM performs worse than our model.
| 50% training data | 100% training data | |||
|---|---|---|---|---|
| AUC | F1 | AUC | F1 | |
| GRU | 0.5831 | 0.5573 | 0.5952 | 0.5752 |
| Attention-GRU | 0.5918 | 0.5698 | 0.6059 | 0.5843 |
| Time-LSTM | 0.5926 | 0.5704 | 0.6062 | 0.5849 |
| Session-RNN | 0.5839 | 0.5561 | 0.5967 | 0.5733 |
| libFM | 0.5891 | 0.5663 | 0.6009 | 0.5802 |
| Attention-GRU-3M | 0.6051∗ | 0.5801∗ | 0.6283∗ | 0.6050∗ |
5.3.2 The Effects of Three Modifications
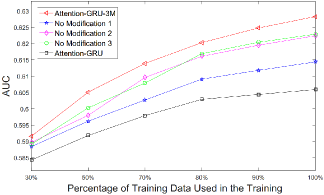
As described in section 4.2, three modifications are proposed to enhance Attention-GRU. We now remove them one at a time to evaluate how each modification affects the prediction performance. We also change the size of data used in training to evaluate its effect on the performance. As shown in Figure 5 (The results of AUC and F1 are similar. Due to page limit, we only show the results of AUC), AUC declines when we remove each type of modification and declines the most when removing Modification 1, which indicates that all the proposed modifications contribute to the performance improvement and Modification 1 is more effective. As the size of training data increases, the influence of Modification 1 becomes larger (i.e. the gap between “Attention-GRU-3M” and “No Modification 1” becomes larger). One explanation may be that, compared to the other two modifications, Modification 1 brings much more parameters (i.e. entries of ), thus it needs more training data to learn their optimal values. This also explains that in Table 2 and Figure 5, our model has a larger performance improvement than the other models as the data size increases.
6 Online Experiments
To better evaluate users’ real response to our brand-level ranking system, we conduct a series of online experiments on the Tmall search scenario in Taobao. In this scenario, there are about clicks and purchases on items of nearly brands from over customers within one normal day. A standard A/B test is conducted online. As shown in Figure 6, we design two user interfaces, one adopts the original ranking system (left), and a button “Brand” is added to the other one (right), where users can switch to our brand-level ranking system by clicking the button. We preserve the original ranking system in the right for users who have no brand preference. For each setting, the same number (about per day) of users are randomly selected for A/B test. We perform the online experiments for seven days, and the average CTR, ATIP and GMV (described in section 4.1) per day are reported.
| CTR | ATIP | GMV | |
|---|---|---|---|
| Baseline | 50.17% | CNY 140.13 | CNY 4824001.84 |
| New Version | 50.37% | CNY 144.90 | CNY 4993468.95 |
| Improvement | 0.39% | 3.40% | 3.51% |
The results are shown in Table 3. We can see that compared with the baseline, CTR and ATIP in the proposed new ranking system are both improved, which indicates that by incorporating the brand-level ranking system, users are more likely to click the items and at the same time, they tend to purchase items with higher price (likely to be of higher quality). As a result, the key metric to optimize in this platform, i.e. GMV, has an improvement of 3.51%. Considering the traffic of the platform, it would result in a significant boost in revenue. Our brand-level ranking system has already gone production on the platform, currently serving as a feature requiring user’s proactive opt-in to be activated. Nearly users actively use this system per day.
7 Conclusion
In this paper, we propose a brand-level ranking system to better satisfy the demand of users who have preference bias to certain brands. The core of this system is to solve the personalized brand ranking problem. In our solution, we firstly carefully design the brand features, then rank the brands by an adapted Attention-GRU model. In future work, we will explore the effectiveness of our modifications on other machine learning models (e.g. Modification 1 on Convolutional Neural Network Krizhevsky et al. (2012), Modification 2 on Matrix Factorization Qian et al. (2016)). In addition, we would improve the design of our ranking model (e.g. considering the exploration of new brands by reinforcement learning).
Acknowledgements
This work was supported in part by the National Nature Science Foundation of China (Grant Nos: 61751307, 61522206, 61373118, 61672409), the grant ZJU Research 083650 of the ZJUI Research Program from Zhejiang University, the National Youth Top-notch Talent Support Program, the Major Basic Research Project of Shaanxi Province (Grant No. 2017ZDJC-31), and the Science and Technology Plan Program in Shaanxi Province of China (Grant No. 2017KJXX-80). Also thanks to the colleagues in Alibaba Group.
References
- Berger [2013] James O Berger. Statistical decision theory and Bayesian analysis. Springer Science & Business Media, 2013.
- Chen et al. [2017] Zheqian Chen, Ben Gao, Huimin Zhang, Zhou Zhao, Haifeng Liu, and Deng Cai. User personalized satisfaction prediction via multiple instance deep learning. In WWW, pages 907–915, 2017.
- Cho et al. [2014] Kyunghyun Cho, Bart Van Merriënboer, Caglar Gulcehre, Dzmitry Bahdanau, Fethi Bougares, Holger Schwenk, and Yoshua Bengio. Learning phrase representations using rnn encoder-decoder for statistical machine translation. arXiv, 2014.
- Chorowski et al. [2015] Jan K Chorowski, Dzmitry Bahdanau, Dmitriy Serdyuk, Kyunghyun Cho, and Yoshua Bengio. Attention-based models for speech recognition. In NIPS, pages 577–585, 2015.
- Chung et al. [2014] Junyoung Chung, Caglar Gulcehre, KyungHyun Cho, and Yoshua Bengio. Empirical evaluation of gated recurrent neural networks on sequence modeling. arXiv, 2014.
- Duchi et al. [2011] John Duchi, Elad Hazan, and Yoram Singer. Adaptive subgradient methods for online learning and stochastic optimization. JMLR, 12(Jul):2121–2159, 2011.
- Elman [1990] Jeffrey L Elman. Finding structure in time. Cognitive science, 14(2):179–211, 1990.
- Graves [2013] Alex Graves. Generating sequences with recurrent neural networks. arXiv, 2013.
- Hidasi et al. [2016] Balázs Hidasi, Alexandros Karatzoglou, Linas Baltrunas, and Domonkos Tikk. Session-based recommendations with recurrent neural networks. In ICLR, 2016.
- Hochreiter and Schmidhuber [1997] Sepp Hochreiter and Jürgen Schmidhuber. Long short-term memory. Neural computation, 9(8):1735–1780, 1997.
- Huang et al. [2004] Xiangji Huang, Fuchun Peng, Aijun An, and Dale Schuurmans. Dynamic web log session identification with statistical language models. JASIST, 55(14):1290–1303, 2004.
- Kim and Leskovec [2013] Myunghwan Kim and Jure Leskovec. Nonparametric multi-group membership model for dynamic networks. In NIPS, pages 1385–1393, 2013.
- Krizhevsky et al. [2012] Alex Krizhevsky, Ilya Sutskever, and Geoffrey E Hinton. Imagenet classification with deep convolutional neural networks. In NIPS, pages 1097–1105, 2012.
- Mnih et al. [2014] Volodymyr Mnih, Nicolas Heess, Alex Graves, et al. Recurrent models of visual attention. In NIPS, pages 2204–2212, 2014.
- Pan et al. [2008] Rong Pan, Yunhong Zhou, Bin Cao, Nathan N Liu, Rajan Lukose, Martin Scholz, and Qiang Yang. One-class collaborative filtering. In ICDM, pages 502–511. IEEE, 2008.
- Pan et al. [2017] Boyuan Pan, Hao Li, Zhou Zhao, Bin Cao, Deng Cai, and Xiaofei He. Memen: Multi-layer embedding with memory networks for machine comprehension. arXiv, 2017.
- Qian et al. [2016] Wei Qian, Bin Hong, Deng Cai, Xiaofei He, Xuelong Li, et al. Non-negative matrix factorization with sinkhorn distance. In IJCAI, pages 1960–1966, 2016.
- Rendle [2012] Steffen Rendle. Factorization machines with libfm. TIST, 3(3):57, 2012.
- Tan et al. [2016] Yong Kiam Tan, Xinxing Xu, and Yong Liu. Improved recurrent neural networks for session-based recommendations. In Proceedings of the 1st Workshop on Deep Learning for Recommender Systems, pages 17–22. ACM, 2016.
- Wang et al. [2016a] Beidou Wang, Martin Ester, Jiajun Bu, Yu Zhu, Ziyu Guan, and Deng Cai. Which to view: Personalized prioritization for broadcast emails. In WWW, pages 1181–1190, 2016.
- Wang et al. [2016b] Beidou Wang, Martin Ester, Yikang Liao, Jiajun Bu, Yu Zhu, Ziyu Guan, and Deng Cai. The million domain challenge: Broadcast email prioritization by cross-domain recommendation. In KDD, pages 1895–1904. ACM, 2016.
- Yu et al. [2016] Feng Yu, Qiang Liu, Shu Wu, Liang Wang, and Tieniu Tan. A dynamic recurrent model for next basket recommendation. In SIGIR, pages 729–732. ACM, 2016.
- Zhu et al. [2016] Yu Zhu, Ziyu Guan, Shulong Tan, Haifeng Liu, Deng Cai, and Xiaofei He. Heterogeneous hypergraph embedding for document recommendation. Neurocomputing, 216:150–162, 2016.
- Zhu et al. [2017] Yu Zhu, Hao Li, Yikang Liao, Beidou Wang, Ziyu Guan, Haifeng Liu, and Deng Cai. What to do next: Modeling user behaviors by time-lstm. In IJCAI, pages 3602–3608, 2017.
- Zipser et al. [2016] Daniel Zipser, Yougang Chen, and Fang Gong. The modernization of the chinese consumer. McKinsey Quarterly, 2016.