Double Helicity Asymmetries of Forward Neutral Pions from GeV Collisions at STAR
Abstract
Longitudinally polarized scattering experiments provide access to gluon polarization via measurement of the double helicity asymmetry, . At the completion of the 2013 RHIC running period, a significant dataset of s corresponding to an integrated luminosity of 46 (2012) and 8 (2013) produced from polarized scattering at GeV with an average beam polarization of approximately was acquired. The kinematics were measured via isolation cones by the STAR Forward Meson Spectrometer, an electromagnetic calorimeter covering a forward pseudorapidity range of . The asymmetric subprocess becomes more dominant in this forward region than in the midrapidity region; furthermore, asymmetry measurements in the forward region are sensitive to low- gluons. Progress on determined from forward events, complementing previous midrapidity measurements, are presented.
keywords:
double helicity asymmetry; longitudinal double spin asymmetry; forwardDay Month Year
PACS numbers:
1 Introduction
The spin of the proton is decomposed in terms of the constituent quark and gluon spins and angular momenta. The contribution from the quark spin has been measured to account for approximately 30% of the proton spin.[1] While the quark and gluon angular momenta have not been measured, the gluon helicity contribution is coming into focus. The gluon helicity contribution is described by the zeroth moment of the polarized gluon parton distribution function (PDF), , defined as the difference in the unpolarized gluon PDF for which gluon helicity is aligned with the proton helicity and that for which the gluon and proton helicities are anti-aligned. According to the most recent global analyses, the distribution is positive for , but remains largely unconstrained for .[2, 3]
In scattering, the double helicity asymmetry for production, , is defined as the ratio of the polarized cross section to the unpolarized cross section. Assuming factorization validity for the process, may be expressed as
| (1) |
where the summations run over partons, and are polarized and unpolarized PDFs, and are parton-level polarized and unpolarized cross sections, and is the fragmentation function for hadronization. Of the probability density distributions which enter equation (1), the least constrained quantity is , which in turn makes an observable sensitive to gluon polarization.[4, 5]
The least-understood behavior of is kinematically accessible by a measurement of for hadroproduction at forward pseudorapidities.[6] Forward jets are typically produced by subprocesses with a low- parton scattering on a much higher- parton. Since the subprocess becomes more dominant in the forward region and the gluon PDF dominates at low-, foward jets are sensitive to low- gluon phenomena.
2 Forward Calorimetry at STAR
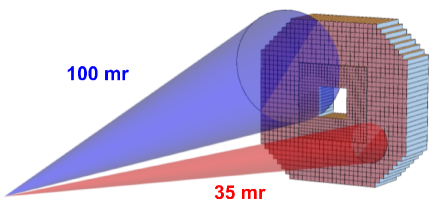
The Forward Meson Spectrometer (FMS) is an electromagnetic calorimeter in the STAR experimental hall of RHIC. Covering full azimuth and a forward pseudorapidity range of , the FMS is composed of an array of lead glass cells, where each cell is backed by a photomultiplier tube; see Fig. 2 for a schematic layout of the cells. The primary observable is a pair of photon clusters, which originate from the primary decay mode of s. Measuring the photon energies and along with the cluster separation allows for the determination of the invariant mass and the subsequent event reconstruction. Each candidate event is characterized by an invariant mass , di-photon energy , and transverse momentum .
The data set used in this analysis was obtained during the 2012 and 2013 RHIC running periods from longitudinally polarized collisions with center of mass energy GeV. Altogether, the FMS acquired an integrated luminosity of 46 in 2012 and 8 in 2013. The events were selected based on the following criteria: {itemlist}
GeV/c for 2012 data and GeV/c for 2013 data,
GeV/c,
GeV,
,
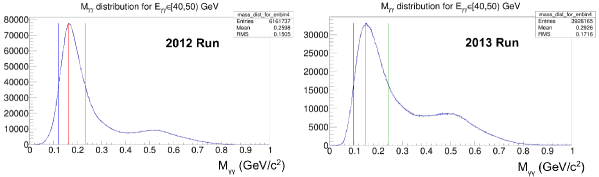
-dependent cut,
isolation cone cut (both 35 mrad and 100 mrad analyzed). The -dependent cut was used to account for the overall increase in reconstruction with increasing ; this effect serves as a guide for and can be fixed by FMS calibration improvement. An example distribution for GeV is shown in Fig. 1.
The data were analyzed using two isolation cone sizes of 35 mrad and 100 mrad, shown in Fig. 2. The use of isolation cones was motivated by the dependence of the transverse single-spin asymmetry on isolation: more isolated s exhibited higher asymmetries.[7] A goal of this study was to verify that is not dependent on isolation.
3 Relative Luminosity and Systematic Uncertainty
Experimentally, it is easiest to use counts to measure rather than cross sections. Letting and denote the initial proton helicity signs, the proton spin-dependent cross sections for production may be re-expressed in terms of the yield counts and integrated luminosities . With the relative luminosity , defined as
| (2) |
may rewritten in terms of the yields and proton beam polarizations and as
| (3) |
The beam polarizations were measured independently by the RHIC polarimetry group, and were typically .
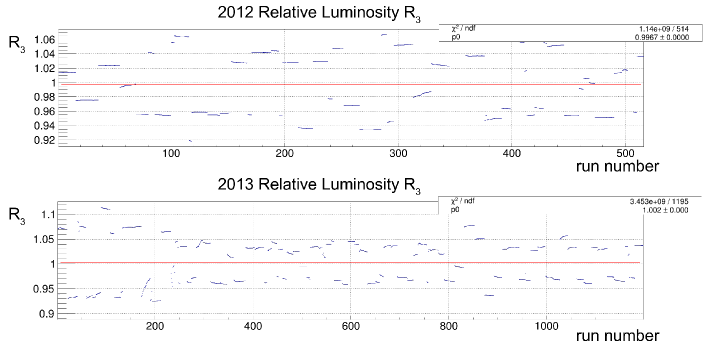
The relative luminosity was measured using the Vertex Position Detector (VPD) and cross-checked with the Zero Degree Calorimeter (ZDC). Both the VPD and ZDC are called “binary counting detectors”: for each proton bunch crossing at STAR, they registered whether or not a particle passed through them with enough energy to satisfy a threshold condition, without any other information recorded. The VPD and ZDC are both duplicated and positioned symmetrically on each side of the interaction point. This setup makes it possible to define coincidence triggers, which demand a count on each side of the VPD or ZDC within a defined timing interval. For each data-taking run (typically a 30 minute period), the relative luminosity was computed using an average of VPD single-side triggers and VPD coincidence triggers. The relative luminosity for each data-taking run is shown in Fig. 3.
The VPD and ZDC were also used to constrain a systematic uncertainty on the measurement. The double helicity asymmetry was also measured using ZDC single-side triggers while using the VPD coincidence triggers as a relative luminosity. This asymmetry, denoted , was also measured for each data-taking run and is shown as a distribution in Fig. 4. The distributions are fit to Gaussian functions, where and are the distribution mean and standard deviation, respectively. For the 2013 data set, the value of was correlated with the choice of spin pattern, where half of the spin patterns yielded negative values and the other half yielded positive values; this effect is still under investigation. The distribution means give a value of for 2012 data and for 2013 data.

The contribution to the systematic uncertainty from the relative luminosity measurement was conservatively estimated as the sum of the distribution mean and the standard deviation of the Gaussian fit. For the 2013 data set, the larger of the two standard deviations was used. The systematic uncertainty values obtained from 2012 and 2013 were combined to a single value by using statistics to compute a weighted average; this computation was performed for each and bin used for the extraction. The systematic uncertainty contribution was for the 2012 data set and for the 2013 data set.
4 Forward Measurement
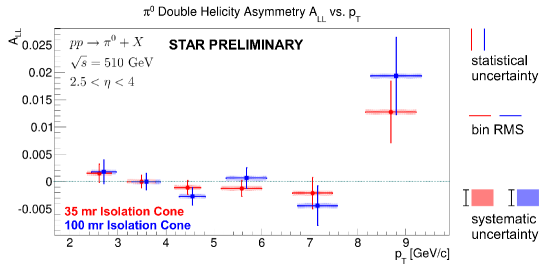
The measurement of is plotted in bins in Fig. 5 and in bins in Fig. 6. A constant fit on the 35 mrad isolation cone data returns a value of . For the 100 mrad isolation cone, the constant fit returns . There is no indication of nonzero within the present statistical and systematic uncertainties. Furthermore, there is no observed isolation-dependence of . Additional systematic uncertainty contributions, such as trigger bias and initial proton transversity remain under investigation, but are likely to be sub-dominant.

5 Conclusion
A measurement of the double helicity asymmetry for forward-produced neutral pions, , has been presented. In particular, the forward pseudorapidity range of allows one to constrain for . The asymmetry is consistent with zero within the statistical and systematic uncertainties. Although this measurement was performed using isolation cones, an inclusive measurement is underway.
References
- [1] PHENIX Collaboration (Adare, A. et al), Phys. Rev. D 90, 012007 (2014).
- [2] D. de Florian, R. Sassot, M. Stratmann and W. Vogelsang, Phys. Rev. Lett. 113, 012001 (2014).
- [3] E. R. Nocera, R. D. Ball, S. Forte, G. Ridolfi and J. Rojo, Nucl.Phys. B887, 276 (2014).
- [4] B. Jager, M. Stratmann and W. Vogelsang, Phys.Rev. D70, 034010 (2004).
- [5] STAR Collaboration (Adamczyk, L. et al), Phys.Rev. D89, 012001 (2014).
- [6] STAR Collaboration (Adams, J. et al), Phys.Rev.Lett. 97, 152302 (2006).
- [7] S. Heppelmann, PoS DIS2013, 240 (2013).