Kepler-503b: An Object at the Hydrogen Burning Mass Limit Orbiting a Subgiant Star
Abstract
Using spectroscopic radial velocities with the APOGEE instrument and Gaia distance estimates, we demonstrate that Kepler-503b, currently considered a validated Kepler planet, is in fact a brown-dwarf/low-mass star in a nearly circular 7.2-day orbit around a subgiant star. Using a mass estimate for the primary star derived from stellar models, we derive a companion mass and radius of ( ) and ( ), respectively. Assuming the system is coeval, the evolutionary state of the primary indicates the age is Gyr. Kepler-503b sits right at the hydrogen burning mass limit, straddling the boundary between brown dwarfs and very low-mass stars. More precise radial velocities and secondary eclipse spectroscopy with James Webb Space Telescope will provide improved measurements of the physical parameters and age of this important system to better constrain and understand the physics of these objects and their spectra. This system emphasizes the value of radial velocity observations to distinguish a genuine planet from astrophysical false positives, and is the first result from the SDSS-IV monitoring of Kepler planet candidates with the multi-object APOGEE instrument.
1 Introduction
The NASA Kepler space mission, in its search for transiting Earth analogues, provided nearly continuous observations of stars with a photometric precision of a few parts per million (Borucki et al., 2010; Koch et al., 2010). The final Kepler data release (DR25) lists more than objects of interest (KOIs), or targets showing a transit which may be caused by an exoplanet (Thompson et al., 2017). Vetting these KOIs has revealed over eclipsing binaries with precise photometric data (Kirk et al., 2016). While high-resolution imaging (Furlan et al., 2017) and statistical methods (Morton et al., 2016) are useful for constraining the nature of a KOI, dynamical observations can provide an unambiguous classification for a given system.
Eclipsing binaries are important astrophysical systems because simultaneous modeling of spectroscopic and photometric observations yields precise dynamical masses and stellar radii (Torres et al., 2010). Precisely measured stellar parameters are valuable for calibrating and refining stellar evolution models (e.g., Fernandez et al., 2009; Torres et al., 2014) and even play a role in the cosmic distance scale. Furthermore, determining precise properties of exoplanets requires an understanding of their host stars’ parameters, particularly the masses and radii. The detection of false positive KOIs has greater implications for the planet-hosting stellar population. The presence of eclipsing binaries quantifies the false positive rate and can reveal any dependencies on parameters, such as the location within the Kepler field and properties of the host star or planetary candidate.
In this paper, we provide tight constraints on the age, radii, masses, and other properties of the low mass-ratio () eclipsing binary system Kepler-503 (KIC 3642741, 2MASS J19223275+3842276, Kp = 14.75, H = 13.14). The paper is structured as follows: Section 2 presents the observational data, Section 3 discusses our data processing, and Section 4 describes our analysis. A discussion of our results is presented in Section 5.
2 Observations
Kepler-503 was observed from Apache Point Observatory (APO) between 30 April 2015 and 7 April 2017 as part of the APO Galaxy Evolution Experiment (APOGEE) KOI program (Fleming et al., 2015; Majewski et al., 2017; Zasowski et al., 2017) within SDSS-IV (Blanton et al., 2017). We obtained nineteen spectra of Kepler-503, using the high-resolution (), near-infrared ( ), multi-object APOGEE spectrograph (Wilson et al., 2010, 2012), mounted on the Sloan 2.5-meter telescope (Gunn et al., 2006). The observations are summarized in Table 1, which lists our derived radial velocities, their uncertainties (corresponding to a error), and the signal-to-noise ratio (SNR) per pixel for each epoch. One observation with a SNR below was not used for analysis. \startlongtable
| BJD | RV (km s-1) | (km s-1) | SNR‡ (pixel-1) |
|---|---|---|---|
| 2456932.708196 | -52.86 | 0.21 | 22 |
| 2457142.860499 | -52.11 | 0.2 | 24 |
| 2457199.743627 | -46.26 | 0.35 | 12 |
| 2457264.658553 | -43.3 | 0.24 | 17 |
| 2457265.795423 | -50.02 | 0.17 | 29 |
| 2457266.783228 | -52.86 | 0.18 | 25 |
| 2457294.705133 | -49.98 | 0.17 | 30 |
| 2457319.648315 | -45.49 | 0.25 | 19 |
| 2457472.004760 | -45.25 | 0.26 | 16 |
| 2457498.977450 | -52.66 | 0.39 | 12 |
| 2457527.949126 | -53.05 | 0.15 | 33 |
| 2457554.814754 | -42.62 | 0.26 | 16 |
| 2457562.871095 | -47.25 | 0.26 | 16 |
| 2457643.740360 | -52.13 | 0.35 | 12 |
| 2457672.675784 | -52.15 | 0.17 | 27 |
| 2457701.553540 | -51.51 | 0.49 | 12 |
| 2457831.992227 | -50.48 | 0.23 | 17 |
| 2457850.990495 | * | * | 6 |
Kepler-503 was observed for the entirety of the Kepler mission, is listed as a planetary candidate in DR25 and was statistically validated as an exoplanet by Morton et al. (2016). The final data release lists a shallow, transit signal with an orbital period of days and an estimated physical radius of . The stellar parameters in the DR25 stellar properties catalog (Mathur et al., 2017) were derived with photometric priors and inferred from stellar models. The DR25 parameters for Kepler-503 suggest a solar-like host star with an effective temperature of K, a mass of , and a radius of .
3 Data Processing
3.1 Radial Velocities
The APOGEE data reduction pipeline (Nidever et al., 2015) performs sky subtraction, telluric and barycentric correction, and wavelength and flux calibration for each observation of a target. We focused our analysis on these individual spectra for dynamical characterization. While the APOGEE pipeline provides radial velocity measurements, we performed additional post-processing on the spectrum to remove residual telluric lines prior to analysis.
Radial velocities of Kepler-503 were derived using the cross-correlation method with uncertainties calculated via the maximum-likelihood approach presented by Zucker (2003). With this method, we account for uncertainty contributions from the spectral bandwidth, sharpness of the correlation peak, and the spectral line SNR but cannot exclude systematic uncertainties due to the instrument or poor template selection. Cross-correlation searches for the Doppler shift of an observed spectrum that maximizes the correlation with a template that adequately represents the observed spectrum without a Doppler shift. The best-fitting spectrum should have the highest correlation and it is common practice for this to be used as the template (e.g., Latham et al., 2002). We identified the best-fitting synthetic spectrum in the H-band from a grid of BT-Settl synthetic spectra (Allard et al., 2012) by cross-correlating the APOGEE epoch with the highest SNR against a grid spanning surface effective temperature (, in intervals of 100 K), surface gravity (, in intervals of 0.5 dex), metallicity (, in intervals of 0.5 dex), and rotational broadening (, in intervals of 2 ). The synthetic spectrum with the largest correlation was used for the final cross-correlation to derive the reported radial velocities in Table 1. The properties of the best model are listed in Table 2 and were not used as priors for fitting the system.
3.2 Photometry
We used the Kepler pre-search data conditioned time-series light curves (Smith et al., 2012; Stumpe et al., 2012, 2014) available at the Mikulski Archive for Space Telescopes (MAST). We assumed the transit signal was superimposed on the stellar variability and could be modeled using a Gaussian process. We used the celerite package and assumed a quasi-periodic covariance function for the Gaussian process, following the procedure in Foreman-Mackey et al. (2017). No additional processing was performed on the light curve.
4 Results
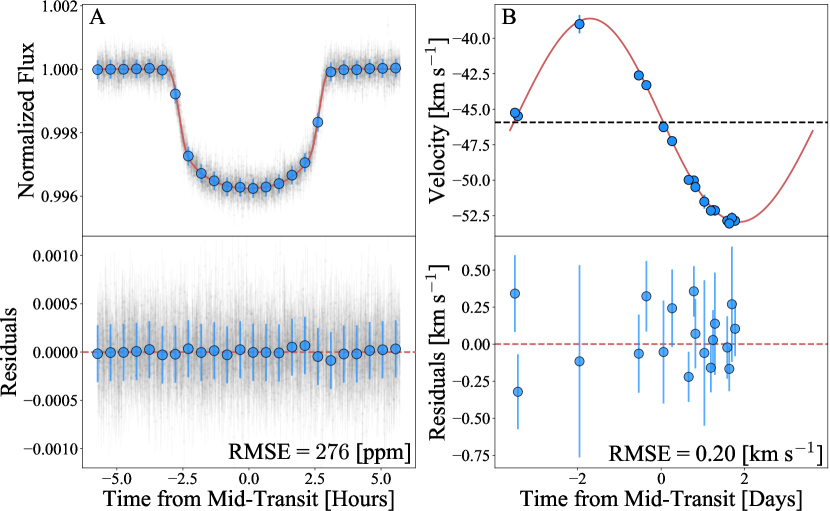
We jointly modeled Kepler-503’s radial velocities and light curve using the EXOFASTv2 analysis package (Eastman, 2017). The light curve and Keplerian radial velocity models follow the parametrization described by Eastman et al. (2013). We adopted a quadratic limb darkening law for the transit. The priors for the modeling included (i) 2MASS magnitudes (Skrutskie et al., 2006), (ii) SDSS magnitudes (Alam et al., 2015), (iii) magnitudes (Everett et al., 2012), (iv) WISE magnitudes (Wright et al., 2010), (v) surface gravity, temperature and metallicity from the APOGEE Stellar Parameter and Chemical Abundances Pipeline (ASPCAP, García Pérez et al., 2016), (vi) the maximum visual extinction from estimates of Galactic dust extinction by Schlafly & Finkbeiner (2011), (vii) the photometric measurements from the second data release of the Gaia survey (Gaia Collaboration et al., 2018), and (viii) the distance estimate from Bailer-Jones et al. (2018). We validated the performance of our EXOFASTv2 implementation by analyzing the corresponding data products for KOI-189, and obtained very similar parameters to those published by Díaz et al. (2014) using the PASTIS planet-validation software. We repeated the analysis for Kepler-503 using the parallax from Gaia to determine if there were any significant effects from the nonlinearity of the parallax transformation or any asymmetry in the parallax posterior distribution. The results are consistent to within their uncertainties and herein we present values from the analysis using the distance prior. Figure 1 presents the result of the fit and Table 2 provides a summary of the stellar priors and the inferred systemic parameters along with their confidence intervals. The minimum companion mass is , a value incompatible with the statistical validation and estimated parameters from DR25.
| Parameter | Units | Median Value |
|---|---|---|
| Primary Synthetic Spectrum†: | ||
| Effective Temperature | (K) | |
| Surface Gravity | (cgs) | |
| Metallicity | [M/H] | |
| Rotational Velocity | (km ) | |
| Primary Stellar Priors: | ||
| Effective Temperature‡ | (K) | |
| Surface Gravity‡ | (cgs) | |
| Metallicity‡ | [Fe/H] | |
| Maximum Visual Extinction | ||
| Distance | (pc) | |
| Primary Parameters: | ||
| Mass | () | |
| Radius | () | |
| Density | (g ) | |
| Surface Gravity | (cgs) | |
| Effective Temperature | (K) | |
| Metallicity | [Fe/H] | |
| Age | (Gyr) | |
| Parallax | (mas) | |
| Secondary Parameters: | ||
| Mass | () | |
| Radius | () | |
| Density | (g ) | |
| Surface Gravity | (cgs) | |
| Equilibrium Temperature | (K) | |
| Orbital Parameters: | ||
| Orbital Period | (days) | |
| Time of Periastron | (BJD) | |
| Semi-major Axis | (AU) | |
| Orbital Eccentricity | ||
| Argument of Periastron | (degrees) | |
| Semi-amplitude Velocity | (km ) | |
| Mass Ratio | ||
| Systemic Velocity | (km ) | |
| Radial Velocity Jitter | (m ) | |
| Transit Parameters: | ||
| Time of Mid-transit | (BJDTDB) | |
| Radius Ratio | ||
| Scaled Semi-major Axis | ||
| e | ||
| e | ||
| Linear Limb-darkening Coefficient | ||
| Quadratic Limb-darkening Coefficient | ||
| Orbital Inclination | (degrees) | |
| Impact Parameter | ||
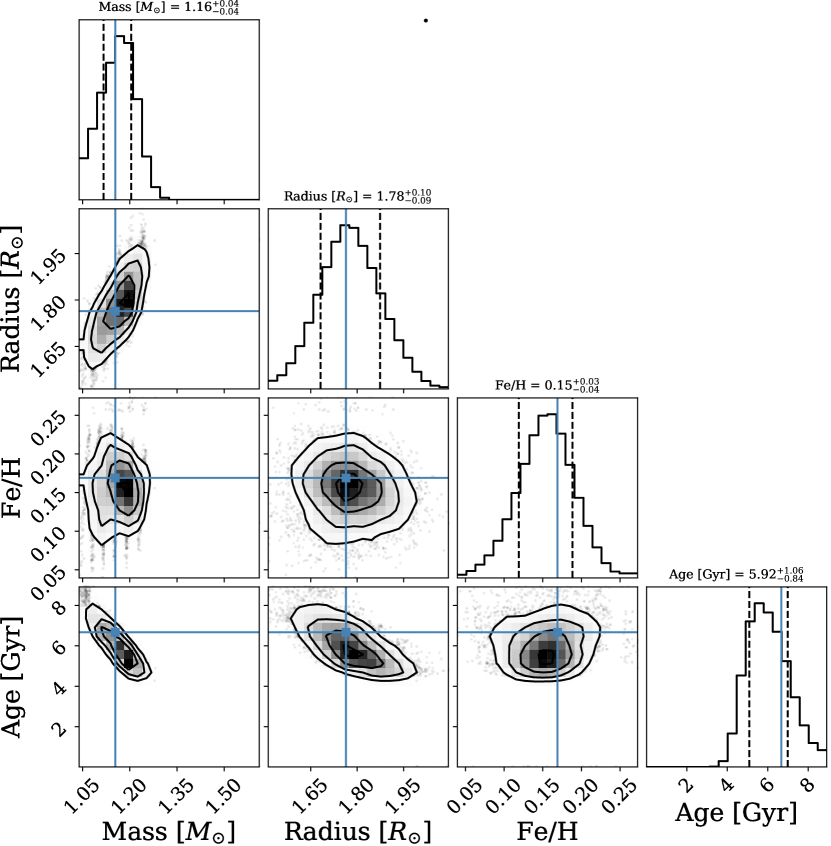
The stellar parameters from EXOFASTv2 are derived using stellar models; the values suggest Kepler-503 is an evolved star beyond the terminal age main sequence. Seager & Mallén-Ornelas (2003) proposed a diagnostic for a transiting system using transit parameters to obtain an estimate of the primary stellar density (). With both photometry and velocimetry, one can determine that the observational data are consistent with the selected stellar models (e.g., von Boetticher et al., 2017). To determine if the deviation from the DR25 stellar parameters was justified, we used the MESA Isochrones & Stellar Tracks (MIST, Dotter, 2016; Choi et al., 2016) to model the primary star and iteratively refine its parameters until the density derived from the photometry and velocimetry was within the uncertainty of the density from the models.
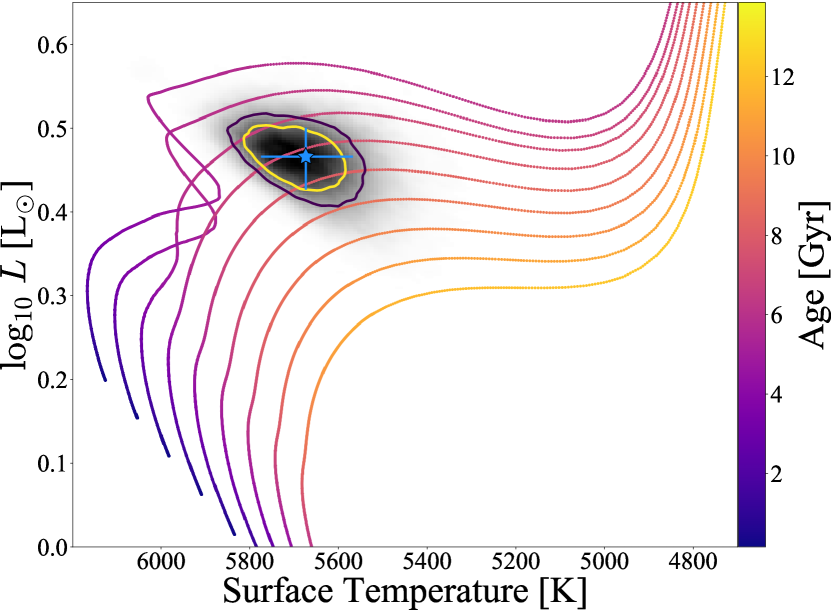
The result of the stellar modeling is shown in Figure 2 and demonstrates that the stellar parameters are comparable to those derived with EXOFASTv2. The data demonstrate that the primary star, Kepler-503, is not a solar analogue, but instead a slightly evolved subgiant. When compared to stellar evolution models, the posterior distributions for the primary star surface effective temperature and luminosity are located in the subgiant branch, which is in agreement with a slightly evolved system. Accordingly, these stellar parameters suggest that the purported exoplanet is actually an object near the hydrogen burning limit of (e.g., Chabrier et al., 2005).
5 Discussion
5.1 Constraint on the Companion Age
Kepler-503, and particularly the secondary component, is of great astrophysical interest because the age of a star is a fundamental parameter that is often poorly constrained. This situation forces age estimates to rely on proxies, such as magnetic activity, element depletion, rotation (gyrochronology, e.g., Soderblom, 2010), or asteroseismology (e.g., Pinsonneault et al., 2018), which are difficult to measure for objects like Kepler-503b. This measurement is further complicated in low-mass stars because their spindown timescales can exceed the age of the Galaxy (West et al., 2008), and their fully convective nature can deplete lithium after only a few hundred million years (Stauffer et al., 1998). Objects near the bottom of the stellar mass function are of interest because they define the transition from bona fide stars to planets. The simplest way to determine the age of such an object is to associate it with another star or group for which the age is better constrained. Here, we assume Kepler-503 is a coeval system. The subgiant nature of the primary star places a strong constraint on the age of the companion because the placement of the subgiant branch on the Hertzsprung-Russell diagram is allowed for only a limited age range, according to stellar evolution models (e.g., Soderblom, 2010). The modeling suggests the age of the Kepler-503 system is Gyr, making it considerably older than the Solar System.
5.2 Constraints on the Companion Temperature
The lack of a secondary eclipse in the photometry provides additional information about Kepler-503b. The dearth of an eclipse, despite the low eccentricity and inclination of the orbit, places a constraint on the companion’s effective surface temperature. The estimated eclipse depth is a function of both the radius ratio, , and the surface brightness ratio, . Using the parameters derived in this paper, the equilibrium temperature of Kepler-503b is K. For such an object, the estimated transit depths for Spitzer’s 3.6 and 4.5 band-passes are and ppm, respectively. Even if we were to assume a higher surface effective temperature that is appropriate for a very low-mass star ( K), the estimated eclipse depths for Kepler-503 are at the sensitivity limits of these Spitzer channels. For Kepler, the estimated eclipse depth at 600 nm is ppm and is dwarfed by the variance in the light curve. Future photometric and spectroscopic observations with the James Webb Space Telescope are required to further constrain the flux ratio of the system to better characterize Kepler-503b.
5.3 Constraints on Evolutionary Models
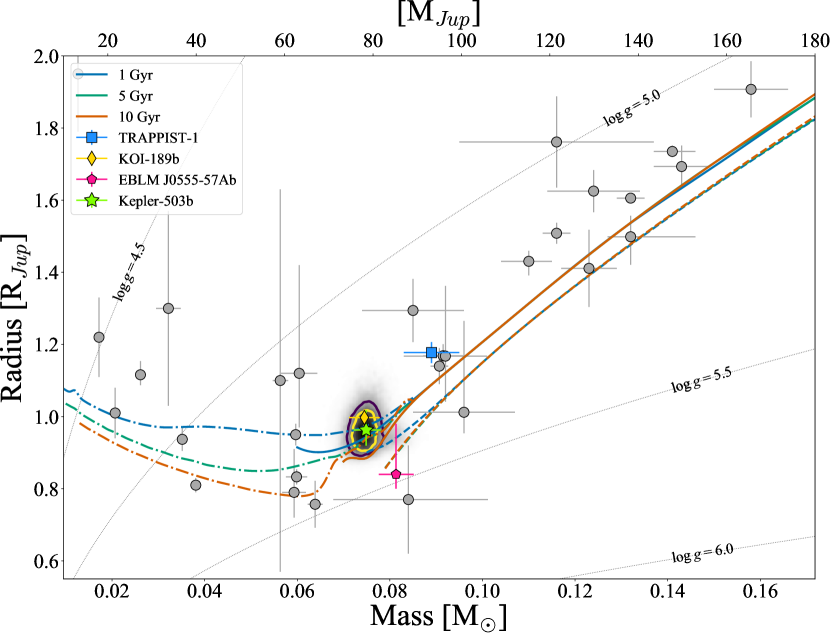
The study of objects similar to Kepler-503b is critical for the empirical calibration of the mass-radius relation near the hydrogen burning mass limit ( ). Figure 3 shows posterior distribution of Kepler-503b on a mass-radius diagram for brown dwarfs and low-mass stars. Its mass and radius are comparable to those of the brown dwarf KOI-189b (Díaz et al., 2014) and the metal-poor ([Fe/H]=), low-mass star EBLM J0555-57Ab (von Boetticher et al., 2017), with values that span the boundary between L- and M- dwarfs. The mass of both KOI-189b and EBLM J0555-57Ab are within one standard deviation from Kepler-503b, but the estimated ages are very different. KOI-189b has an estimated age comparable to the age derived for the Kepler-503 system of Gyrs while EBLM J0555-57Ab is estimated to be much younger at Gyr. The evolutionary tracks in Figure 3, show the change in metallicity cannot account for the change in radius of EBLM J0555-57Ab. We expect a population of objects spanning the hydrogen burning mass limit at varying masses and ages, but this population is still poorly characterized, primarily due to the extreme paucity of well-measured objects.
Kepler-503b is one of the few objects in the regime where evolutionary tracks converge , and can thus help refine said models. The properties of Kepler-503b appear consistent with evolutionary tracks for solar metallicity low-mass stars and brown dwarfs. From the L- and T-dwarf models by Saumon & Marley (2008), the 5 and 10 Gyr evolutionary tracks are the best matches for this object. One caveat is that, while the derived metallicity for the host star suggests this is a slightly metal-rich system, the cloud-based models exist only for solar metallicities. Given the recent interest in very low-mass stars as targets for exoplanet searches (e.g., Gillon et al., 2017), it is essential that the super-solar metallicity regime be properly characterized. Future searches for planets around ultra-cool dwarfs will require precise masses and radii of the host star to properly characterize any detected exoplanets.
6 Summary
This paper reveals a low mass-ratio eclipsing binary system in a nearly circular orbit that was erroneously classified as a transiting exoplanet. Analysis of the photometric and spectroscopic data shows Kepler-503 is an old system with a companion at the hydrogen burning mass limit. This misclassification is largely due to the stellar parameters previously adopted (i.e., a solar-like host). The stellar classification from DR25 used a prior which is known to underestimate the number of sub-giants due to Malmquist bias (e.g., Bastien et al., 2014). Mathur et al. (2017) acknowledge that some systematic biases persist in the DR25 stellar properties catalog, resulting in misclassified systems such as Kepler-503.
This study is one example of the systems observed in the ongoing APOGEE KOI program, with the ultimate goal of (i) refining the false positive rate of Kepler exoplanet candidates, (ii) revealing any dependencies with stellar or candidate parameters, and (iii) understanding binarity and its effect in the planet host population. The recent second data release from the Gaia survey will be helpful for future validation of KOIs by providing a parallax that help to constrain the properties of the host star.
References
- Alam et al. (2015) Alam, S., Albareti, F. D., Allende Prieto, C., et al. 2015, ApJS, 219, 12
- Allard et al. (2012) Allard, F., Homeier, D., & Freytag, B. 2012, Philosophical Transactions of the Royal Society of London Series A, 370, 2765
- Bailer-Jones et al. (2018) Bailer-Jones, C. A. L., Rybizki, J., Fouesneau, M., Mantelet, G., & Andrae, R. 2018, ArXiv e-prints, arXiv:1804.10121 [astro-ph.SR]
- Baraffe et al. (1998) Baraffe, I., Chabrier, G., Allard, F., & Hauschildt, P. H. 1998, A&A, 337, 403
- Baraffe et al. (2015) Baraffe, I., Homeier, D., Allard, F., & Chabrier, G. 2015, A&A, 577, A42
- Bastien et al. (2014) Bastien, F. A., Stassun, K. G., & Pepper, J. 2014, ApJ, 788, L9
- Blanton et al. (2017) Blanton, M. R., Bershady, M. A., Abolfathi, B., et al. 2017, AJ, 154, 28
- Borucki et al. (2010) Borucki, W. J., Koch, D., Basri, G., et al. 2010, Science, 327, 977
- Chabrier et al. (2005) Chabrier, G., Baraffe, I., Allard, F., & Hauschildt, P. H. 2005, ArXiv Astrophysics e-prints, astro-ph/0509798
- Choi et al. (2016) Choi, J., Dotter, A., Conroy, C., et al. 2016, ApJ, 823, 102
- Díaz et al. (2014) Díaz, R. F., Montagnier, G., Leconte, J., et al. 2014, A&A, 572, A109
- Dotter (2016) Dotter, A. 2016, ApJS, 222, 8
- Eastman (2017) Eastman, J. 2017, EXOFASTv2: Generalized publication-quality exoplanet modeling code, Astrophysics Source Code Library, ascl:1710.003
- Eastman et al. (2013) Eastman, J., Gaudi, B. S., & Agol, E. 2013, PASP, 125, 83
- Everett et al. (2012) Everett, M. E., Howell, S. B., & Kinemuchi, K. 2012, PASP, 124, 316
- Fernandez et al. (2009) Fernandez, J. M., Latham, D. W., Torres, G., et al. 2009, ApJ, 701, 764
- Fleming et al. (2015) Fleming, S. W., Mahadevan, S., Deshpande, R., et al. 2015, AJ, 149, 143
- Foreman-Mackey et al. (2017) Foreman-Mackey, D., Agol, E., Ambikasaran, S., & Angus, R. 2017, AJ, 154, 220
- Furlan et al. (2017) Furlan, E., Ciardi, D. R., Everett, M. E., et al. 2017, AJ, 153, 71
- Gaia Collaboration et al. (2018) Gaia Collaboration, Brown, A. G. A., Vallenari, A., et al. 2018, ArXiv e-prints, arXiv:1804.09365
- García Pérez et al. (2016) García Pérez, A. E., Allende Prieto, C., Holtzman, J. A., et al. 2016, AJ, 151, 144
- Gillon et al. (2017) Gillon, M., Triaud, A. H. M. J., Demory, B.-O., et al. 2017, Nature, 542, 456
- Gunn et al. (2006) Gunn, J. E., Siegmund, W. A., Mannery, E. J., et al. 2006, AJ, 131, 2332
- Kirk et al. (2016) Kirk, B., Conroy, K., Prša, A., et al. 2016, AJ, 151, 68
- Koch et al. (2010) Koch, D. G., Borucki, W. J., Basri, G., et al. 2010, ApJ, 713, L79
- Latham et al. (2002) Latham, D. W., Stefanik, R. P., Torres, G., et al. 2002, AJ, 124, 1144
- Majewski et al. (2017) Majewski, S. R., Schiavon, R. P., Frinchaboy, P. M., et al. 2017, AJ, 154, 94
- Mathur et al. (2017) Mathur, S., Huber, D., Batalha, N. M., et al. 2017, ApJS, 229, 30
- Morton et al. (2016) Morton, T. D., Bryson, S. T., Coughlin, J. L., et al. 2016, ApJ, 822, 86
- Nidever et al. (2015) Nidever, D. L., Holtzman, J. A., Allende Prieto, C., et al. 2015, AJ, 150, 173
- Pinsonneault et al. (2018) Pinsonneault, M. H., Elsworth, Y. P., Tayar, J., et al. 2018, ArXiv e-prints, arXiv:1804.09983 [astro-ph.SR]
- Saumon & Marley (2008) Saumon, D., & Marley, M. S. 2008, ApJ, 689, 1327
- Schlafly & Finkbeiner (2011) Schlafly, E. F., & Finkbeiner, D. P. 2011, ApJ, 737, 103
- Seager & Mallén-Ornelas (2003) Seager, S., & Mallén-Ornelas, G. 2003, ApJ, 585, 1038
- Skrutskie et al. (2006) Skrutskie, M. F., Cutri, R. M., Stiening, R., et al. 2006, AJ, 131, 1163
- Smith et al. (2012) Smith, J. C., Stumpe, M. C., Van Cleve, J. E., et al. 2012, PASP, 124, 1000
- Soderblom (2010) Soderblom, D. R. 2010, ARA&A, 48, 581
- Stauffer et al. (1998) Stauffer, J. R., Schultz, G., & Kirkpatrick, J. D. 1998, ApJ, 499, L199
- Stumpe et al. (2014) Stumpe, M. C., Smith, J. C., Catanzarite, J. H., et al. 2014, PASP, 126, 100
- Stumpe et al. (2012) Stumpe, M. C., Smith, J. C., Van Cleve, J. E., et al. 2012, PASP, 124, 985
- Thompson et al. (2017) Thompson, S. E., Coughlin, J. L., Hoffman, K., et al. 2017, Planetary Candidates Observed by Kepler. VIII. A Fully Automated Catalog With Measured Completeness and Reliability Based on Data Release 25, arXiv:1710.06758
- Torres et al. (2010) Torres, G., Andersen, J., & Giménez, A. 2010, A&A Rev., 18, 67
- Torres et al. (2014) Torres, G., Sandberg Lacy, C. H., Pavlovski, K., et al. 2014, ApJ, 797, 31
- von Boetticher et al. (2017) von Boetticher, A., Triaud, A. H. M. J., Queloz, D., et al. 2017, A&A, 604, L6
- West et al. (2008) West, A. A., Hawley, S. L., Bochanski, J. J., et al. 2008, AJ, 135, 785
- Wilson et al. (2010) Wilson, J. C., Hearty, F., Skrutskie, M. F., et al. 2010, in Proc. SPIE, Vol. 7735, Ground-based and Airborne Instrumentation for Astronomy III, 77351C
- Wilson et al. (2012) Wilson, J. C., Hearty, F., Skrutskie, M. F., et al. 2012, in Proc. SPIE, Vol. 8446, Ground-based and Airborne Instrumentation for Astronomy IV, 84460H
- Wright et al. (2010) Wright, E. L., Eisenhardt, P. R. M., Mainzer, A. K., et al. 2010, AJ, 140, 1868
- Zasowski et al. (2017) Zasowski, G., Cohen, R. E., Chojnowski, S. D., et al. 2017, AJ, 154, 198
- Zucker (2003) Zucker, S. 2003, MNRAS, 342, 1291