Strongly correlated charge transport in silicon MOSFET quantum dots
Abstract
Quantum shot noise probes the dynamics of charge transfers through a quantum conductor, reflecting whether quasiparticles flow across the conductor in a steady stream, or in syncopated bursts. We have performed high-sensitivity shot noise measurements in a quantum dot obtained in a silicon metal-oxide-semiconductor field-effect transistor. The quality of our device allows us to precisely associate the different transport regimes and their statistics with the internal state of the quantum dot. In particular, we report on large current fluctuations in the inelastic cotunneling regime, corresponding to different highly-correlated, non-Markovian charge transfer processes. We have also observed unusually large current fluctuations at low energy in the elastic cotunneling regime, the origin of which remains to be fully investigated.
Current fluctuations in a mesocopic conductor, or quantum shot noise Blanter and Büttiker (2000), reflect the granularity of charge transfers across the conductor. By measuring low frequency current fluctuations, one can probe the correlations between subsequent charge transfers and quantify how random these transfers are. Those correlations are underpinned by the interplay between the quantum statistics of the particles flowing across a given conductor, electronic interactions, and the physical mechanisms giving rise to transport in the conductor. Rare, uncorrelated charge transfers lead to Poissonian shot noise , with the charge of the quasiparticles and the average value of the dc current flowing across the conductor. Correlations between subsequent transfers are encoded in the Fano factor , defined as the ratio between the shot noise and its Poissonian value. Fermionic statistics tend to impose some order on charge transport Reznikov et al. (1995); Kumar et al. (1996) , characterized by reduced fluctuations (), or, in the case of perfectly ballistic conductors, fully noiseless transport (). While Coulomb interactions tend to do the same Birk et al. (1995), they can, in some remarkable cases, give rise to positively correlated transport processes with super-Poissonian () fluctuations, where charges flow in bursts through the conductor.
Coulomb-blockaded quantum dots are very rich systems, as they can not only present Poissonian and sub-Poissonian transport regimes Birk et al. (1995); Blanter and Büttiker (2000), but also, depending on their internal structure, strongly correlated transport with super-Poissonian current fluctuations Sukhorukov et al. (2001); Belzig (2005); Thielmann et al. (2005); Onac et al. (2006); Weymann et al. (2007); Aghassi et al. (2008); Carmi and Oreg (2012); Kaasbjerg and Belzig (2015); Zhang et al. (2007); Zarchin et al. (2007); Fricke et al. (2007); Okazaki et al. (2013); Harabula et al. (2018). The latter regime corresponds to non-Markovian transport processes where the transfer of a charge across the dot changes its state, thereby influencing the next transfer event Sukhorukov et al. (2001). As a result, the quantum dot randomly switches between highly and poorly conducting channels while other parameters (e.g. temperature, bias voltage) remain fixed. This can happen in the sequential tunneling regime if several levels of a dot, with markedly different couplings to the leads, participate to transport. In that case the current across the quantum dot shows random telegraph signal features Fricke et al. (2007), yielding strongly enhanced fluctuations Belzig (2005); Zhang et al. (2007); Zarchin et al. (2007); Fricke et al. (2007); Harabula et al. (2018).
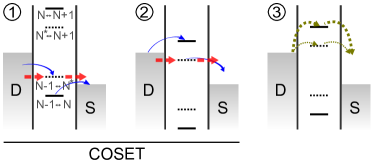
Inelastic cotunneling De Franceschi et al. (2001) is also expected to enhance the current fluctuations, as it is, by definition, a charge transfer process that changes the state of the quantum dot Sukhorukov et al. (2001). Several mechanisms leading to super-Poissonian shot noise in the inelastic cotunneling regime have been proposed, depending on the internal structure of the quantum dot and the respective chemical potentials of the dot and the leads. Some of these mechanisms are depicted in Fig. 1, for a -charge quantum dot with a single excited state labeled . Inelastic cotunneling (blue arrows) events leave the dot in the excited state . In \raisebox{-.9pt} {1}⃝ (resp. \raisebox{-.9pt} {2}⃝), the (resp. ) transition involving sits in the bias window, allowing direct transport through the dot after the cotunneling event Wegewijs and Nazarov (2001); Schleser et al. (2005). This process, usually referred to as cotunneling-assisted tunneling (CAST Golovach and Loss (2004); Aghassi et al. (2008), or COSET Andergassen et al. (2010); Kaasbjerg and Belzig (2015); Gaudenzi et al. (2017); Harabula et al. (2018)), is depicted as dashed red arrows in Fig. 1. It leads to enhanced fluctuations, as the system randomly switches between the blocked state and the conducting (excited) state Thielmann et al. (2005); Weymann et al. (2007); Aghassi et al. (2008); Kaasbjerg and Belzig (2015). In \raisebox{-.9pt} {3}⃝, all transitions are outside the bias window, and the dot is always in a blocked state. This can nonetheless lead to enhanced fluctuations: indeed, whether the quantum dot is blocked in the ground or excited state, elastic cotunneling (green dashed arrows in Fig. 1) with a priori different rates can occur. Inelastic cotunneling events will then randomly switch the quantum dot between states with different (albeit small) conductances, yielding super-Poissonian fluctuations Aghassi et al. (2008); Kaasbjerg and Belzig (2015). This latter regime occurs if , where is the excited state energy and the charging energy Wegewijs and Nazarov (2001); Golovach and Loss (2004); Aghassi et al. (2008); Kaasbjerg and Belzig (2015); Gaudenzi et al. (2017); Harabula et al. (2018). Previous experimental works reported the observation of super-Poissonian noise in carbon nanotubes Onac et al. (2006); Harabula et al. (2018) and in GaAs/AlGaAs Okazaki et al. (2013) quantum dots in the inelastic cotunneling regime. In refs. Okazaki et al. (2013); Harabula et al. (2018), the structure of the excited states suggest that the enhanced shot noise is due to COSET processes; however, no clear modulations in the Fano factor, such as the ones predicted in refs. Aghassi et al. (2008); Kaasbjerg and Belzig (2015) that discriminate between the mechanisms described above, have been observed so far. In this letter, we present the first clear observation of such modulations.
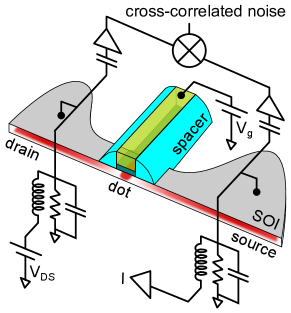
We have investigated quantum dots formed in silicon nanowire metal-oxide-semiconductor field-effect transistors (MOSFETs), fabricated using a microelectronics technology based on 300 mm silicon-on-insulator (SOI) wafers. The low-temperature electronic conductance properties of such devices have been extensively studied in previous works Sanquer et al. (2000); Boehm et al. (2005); Hofheinz et al. (2006a, b); Pierre et al. (2010); Prati et al. (2012); Roche et al. (2012); Lavieville et al. (2015); Voisin et al. (2016), showing very robust Coulomb blockade characteristics. We performed conductance, current and shot noise measurements in several small-size ( nm) p-type devices using the setup described in Fig. 2, at a temperature of K in a cryogen-free He refrigerator. We measure the excess shot noise in the quantum dot with a cross-correlation technique DiCarlo et al. (2006); Parmentier et al. (2016); SM , where the current fluctuations on either side of the device are filtered at low temperature by tanks with a resonance frequency of approx. MHz, and amplified using home-made ultra-low noise preamplifiers. The cross-correlation of the outputs of both preamplifiers is then computed using a high speed digitizer. The dc and low frequency signals through the quantum dot (drain-source voltage , dc current , and differential conductance ) are applied and measured through the inductor of each tanks. This allows us to simultaneously measure and as a function of and gate voltage . In the most stable devices, we can compare the simultaneously acquired differential conductance and shot noise with the current, obtained in separate acquisitions, with very small drifts in gate voltage over extended periods of time (typically mV in a week). From the independents measurements of and , we compute an effective Fano factor .
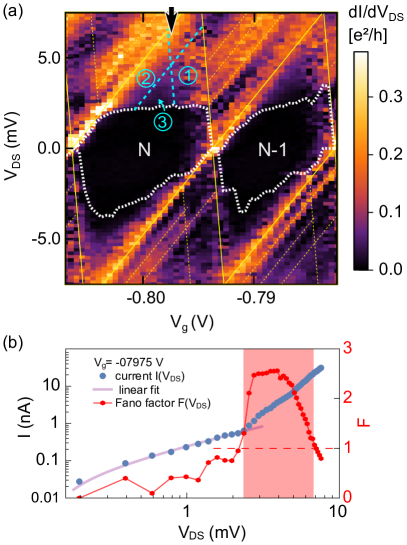
Figure 3a shows measurements of in our best device, displaying two Coulomb diamonds (identified by the number of holes and ), analyzed in this letter (measurements over the full range of , as well as in other devices, are shown in the supplementary materials SM ). The edges of the diamonds indicate the transitions involving ground states of the quantum dot, highlighted by the continuous yellow lines in Fig. 3a. Similarly, the transitions involving excited states of the quantum dot, associated to resonances in outside of the diamonds, are highlighted by the dashed yellow lines. The negative slope resonance lines, corresponding to quantum dot transitions aligned with the electrochemical potential of the source, are constructed by comparing and SM . We extract the lever arms SM , as well as the charging and typical excited states energies meV, meV. Note that these parameters are not constant over the full range of , as the shape of the quantum dot is modified for large excursions in gate voltage SM . is non-zero inside the diamonds, indicating the presence of cotunelling processes. The aforementioned condition to observe the various cotunneling regimes \raisebox{-.9pt} {1}⃝, \raisebox{-.9pt} {2}⃝ and \raisebox{-.9pt} {3}⃝ is fulfilled in our device. This is shown by extending the (yellow dashed) excited transitions lines into the Coulomb diamonds, yielding the light blue dashed lines in Fig. 3a. As demonstrated below, these regimes indeed give rise to different shot noise contributions.
We quantitatively discriminate elastic and inelastic cotunneling regimes by exploiting our measurements of the current flowing across the dot. We check that the measured current SM shows and dependences accurately matched by the resonance lines shown in Fig. 3a. We then extract the onset of inelastic cotunneling, plotted as thick, dotted white lines in Fig. 3a, by tracking, for a given value of , at which does change from a linear dependence (characteristic of elastic cotunneling) to a power-law dependence (characterizing inelastic cotunneling) Averin and Nazarov (1990); Glattli et al. (1991). The onset closely follows the edges of the diamonds in vicinity of the charge degeneracy points, then clearly bifurcate inside the diamonds upon reaching the first excited state resonance. Furthermore, is clearly non-zero beyond the onset lines. Note that the onset lines do not correspond to constant , which is reminiscent of energy renormalization due to inelastic cotunneling Holm et al. (2008); Splettstoesser et al. (2012). The extraction of the onset is illustrated in Fig. 3b for V, plotting in log-log scale (left Y-axis, blue dots). Below mV, defining the onset, is linear (the violet line is a linear fit of the data in that range), then takes a power law , with (red area) SM . Plotting the Fano factor on the same graph (right Y-axis, red symbols) shows the noise contribution of each cotunneling regime: while stays below the Poissonian value in the elastic cotunneling regime, it rapidly shoots up to significantly large values in the inelastic cotunneling regime, then decreases back to sub-Poissonian values outside of the Coulomb diamond.
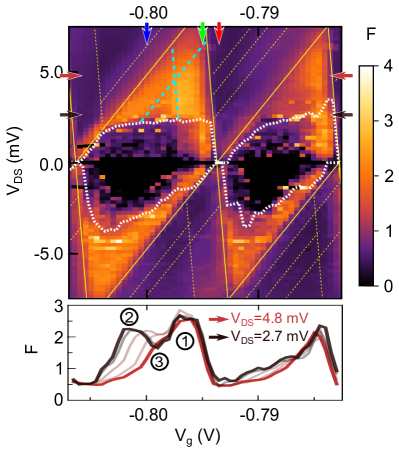
Fig. 4 shows a map of over the same range of and as in Fig. 3a, also including the resonance lines and the inelastic cotunneling onset presented in the latter. With a few notable exceptions, which we discuss below, is, very clearly, only above the Poisson value in the regime of inelastic cotunneling. In the elastic cotunneling regime, generally takes values smaller than . Note that given the small magnitude of both and in this regime, presents large relative fluctuations. For clarity, we have set whenever either pA or AHz. Outside of the diamonds, is close to , the value for sequential tunneling across a dot with symmetric barriers Blanter and Büttiker (2000).
We now discuss the variations of in regions \raisebox{-.9pt} {1}⃝, \raisebox{-.9pt} {2}⃝ and \raisebox{-.9pt} {3}⃝ in the inelastic cotunneling regime. As shown in Fig. 4, presents sizable modulations, on the order of unity, depending on the position of the excited states transitions with respect to source and drain electrochemical potentials, that match the regions delimited by the blue dashed lines. This appears clearly when taking line cuts of the data at fixed , as a function of : just above the inelastic cotunneling onset, at mV (dark brown line in the bottom panel of Fig. 4), is non-monotonous inside the diamond, with a local minimum at in the region labeled \raisebox{-.9pt} {3}⃝ in Fig. 3. Larger values of on either side of that minimum can thus be attributed to COSET processes such as \raisebox{-.9pt} {1}⃝ and \raisebox{-.9pt} {2}⃝. As is increased, all cotunneling processes end with an excited transition in the transport window, and the local minimum vanishes, as illustrated by the line cut at mV (brown line in the bottom panel of Fig. 4). The measured modulations of in the inelastic cotunneling regime mimic those predicted in Aghassi et al. (2008); Kaasbjerg and Belzig (2015), indicating that super-Poissonian current fluctuations indeed stem from different mechanisms depending on the position of the excited states transitions with respect to drain and source electrochemical potentials.
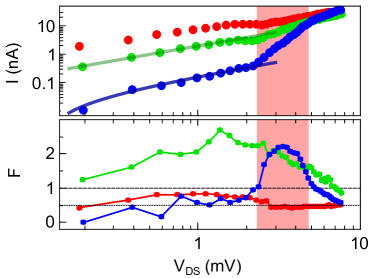
Fig. 4 shows that, unexpectedly, takes super-Poissonian values even for below the inelastic cotunneling onset, close to the edges of the diamonds. This regime of comparatively large fluctuations is quantitatively different from the inelastic cotunneling regime, as illustrated by Fig. 5, where we have plotted the dependence of both and , in (resp.) log-log and semi-log scale, for three values of leading to different transport regimes. These values are indicated by vertical arrows in Fig. 4: for V (red), Coulomb blockade is lifted, and the tunneling through the quantum dot is sequential, leading to comparatively large currents. This regime yields usual, sub-Poissonian values of , saturating at the symmetric value at large . The data at V (blue) is similar to the one shown in Fig. 3b, first showing a linear behavior in the elastic cotunelling regime (blue line), followed by an approximative dependence in the inelastic cotunneling regime. As discussed above, this leads to super-Poissonian values of only in the inelastic cotunneling regime. The data at V (green), close to the edge of the diamond, differs markedly from the previous regimes: indeed, while here remains essentially linear, taking intermediary values in the nA range, takes large, super-Poissonian values in the whole range of , in particular well below the inelastic cotunneling onset (appearing as the edge of the red shaded areas in both panels of Fig. 5). This behavior of comparatively large, linear together with super-Poissonian fluctuations below the inelastic cotunneling onset appears in both and diamonds shown in Fig. 4, for positive and negative (see also SM for maps of the measured current versus and ). Note, however, that 1) it is not observed in all Coulomb diamonds for this device, and 2) surprisingly, it only appears on one side of each diamond, namely, towards the degeneracy point of the -hole diamond. This asymmetry is also seen to some extent in the inelastic cotunneling regime SM . To our knowledge, there is no straightforward mechanism leading to enhanced current and fluctuations in the elastic cotunneling regime. Among the possible explanations, dynamical channel blockade Belzig (2005) can be ruled out by the fact that it occurs outside of the Coulomb diamonds, and that it requires the presence of excited states at energies below meV, which are not clearly observed in the differential conductance. Another mechanism stems from the possible presence of nearby charge traps poorly coupled to the leads. Single dopants located below the spacers can act as such charge traps Hofheinz et al. (2006b), randomly switching the conduction state of the quantum dot, thereby increasing current fluctuations. Previous studies on similar nanowire MOSFETs showed that the presence of such traps is characterized in measurements by large scale periodicity and phase shifts in the Coulomb diamonds Hofheinz et al. (2006b); Escott et al. (2010); Golovach et al. (2011); Villis et al. (2014). While these features do not appear clearly in the measured conductance, similar ones can be seen in the measured shot noise SM ; it is thus not entirely unlikely that the presence of one or more charge traps gives rise to the measured enhanced fluctuations at low .
In summary, we have observed for the first time clear modulations of super-Poissonian fluctuations in the inelastic cotunneling regime, which stem from distinct mechanisms depending on the chemical potential of the quantum dot. We have also observed previously unreported enhanced fluctuations in the elastic cotunneling regime, which might be attributed to nearby charge traps.
We warmly thank J. Splettstoesser, M. Misiorny, C. Flindt, Ch. Strunk, A. Donarini, R. Maurand, F. Portier and C. Altimiras for enlightening discussions. This work was funded by the CEA (Programme Transversal Nanosciences NanoSiN) and the ERC (ERC-2015-STG COHEGRAPH). M. Seo acknowledges support from Enhanced Eurotalents programme.
References
- (1)
- Blanter and Büttiker (2000) Y. Blanter and M. Büttiker, Physics Reports 336, 1 (2000).
- Reznikov et al. (1995) M. Reznikov, M. Heiblum, H. Shtrikman, and D. Mahalu, Physical Review Letters 75, 3340 (1995).
- Kumar et al. (1996) A. Kumar, L. Saminadayar, D. C. Glattli, Y. Jin, and B. Etienne, Physical Review Letters 76, 2778 (1996).
- Birk et al. (1995) H. Birk, M. J. M. de Jong, and C. Schönenberger, Physical Review Letters 75, 1610 (1995).
- Sukhorukov et al. (2001) E. V. Sukhorukov, G. Burkard, and D. Loss, Physical Review B 63, 125315 (2001).
- Belzig (2005) W. Belzig, Physical Review B 71, 161301 (2005).
- Thielmann et al. (2005) A. Thielmann, M. H. Hettler, J. König, and G. Schön, Physical Review Letters 95, 146806 (2005).
- Onac et al. (2006) E. Onac, F. Balestro, B. Trauzettel, C. F. J. Lodewijk, and L. P. Kouwenhoven, Physical Review Letters 96, 026803 (2006).
- Weymann et al. (2007) I. Weymann, J. Barnaś, and S. Krompiewski, Physical Review B 76, 155408 (2007).
- Aghassi et al. (2008) J. Aghassi, M. H. Hettler, and G. Schön, Applied Physics Letters 92, 202101 (2008) .
- Carmi and Oreg (2012) A. Carmi and Y. Oreg, Physical Review B 85, 045325 (2012).
- Kaasbjerg and Belzig (2015) K. Kaasbjerg and W. Belzig, Physical Review B 91, 235413 (2015) .
- Zhang et al. (2007) Y. Zhang, L. DiCarlo, D. T. McClure, M. Yamamoto, S. Tarucha, C. M. Marcus, M. P. Hanson, and A. C. Gossard, Physical Review Letters 99, 036603 (2007).
- Zarchin et al. (2007) O. Zarchin, Y. C. Chung, M. Heiblum, D. Rohrlich, and V. Umansky, Physical Review Letters 98, 066801 (2007).
- Fricke et al. (2007) C. Fricke, F. Hohls, W. Wegscheider, and R. J. Haug, Physical Review B 76, 155307 (2007).
- Okazaki et al. (2013) Y. Okazaki, S. Sasaki, and K. Muraki, Physical Review B 87, 041302 (2013).
- Harabula et al. (2018) M.-C. Harabula, V. Ranjan, R. Haller, G. Fülöp, and C. Schönenberger, Physical Review B 97, 115403 (2018).
- De Franceschi et al. (2001) S. De Franceschi, S. Sasaki, J. M. Elzerman, W. G. van der Wiel, S. Tarucha, and L. P. Kouwenhoven, Physical Review Letters 86, 878 (2001).
- Wegewijs and Nazarov (2001) M. R. Wegewijs and Y. V. Nazarov, arXiv:0103579, (2001) .
- Schleser et al. (2005) R. Schleser, T. Ihn, E. Ruh, K. Ensslin, M. Tews, D. Pfannkuche, D. C. Driscoll, and A. C. Gossard, Physical Review Letters 94, 206805 (2005).
- Golovach and Loss (2004) V. N. Golovach and D. Loss, Physical Review B 69, 245327 (2004).
- Andergassen et al. (2010) S. Andergassen, V. Meden, H. Schoeller, J. Splettstoesser, and M. R. Wegewijs, Nanotechnology 21, 272001 (2010).
- Gaudenzi et al. (2017) R. Gaudenzi, M. Misiorny, E. Burzurí, M. R. Wegewijs, and H. S. J. van der Zant, The Journal of Chemical Physics 146, 092330 (2017).
- Sanquer et al. (2000) M. Sanquer, M. Specht, L. Ghenim, S. Deleonibus, and G. Guegan, Physical Review B 61, 7249 (2000).
- Boehm et al. (2005) M. Boehm, M. Hofheinz, X. Jehl, M. Sanquer, M. Vinet, B. Previtali, D. Fraboulet, D. Mariolle, and S. Deleonibus, Physical Review B 71, 033305 (2005) .
- Hofheinz et al. (2006a) M. Hofheinz, X. Jehl, M. Sanquer, G. Molas, M. Vinet, and S. Deleonibus, Applied Physics Letters 89, 143504 (2006a).
- Hofheinz et al. (2006b) M. Hofheinz, X. Jehl, M. Sanquer, G. Molas, M. Vinet, and S. Deleonibus, The European Physical Journal B 54, 299 (2006b).
- Pierre et al. (2010) M. Pierre, R. Wacquez, X. Jehl, M. Sanquer, M. Vinet, and O. Cueto, Nature Nanotechnology 5, 133 (2010).
- Prati et al. (2012) E. Prati, M. De Michielis, M. Belli, S. Cocco, M. Fanciulli, D. Kotekar-Patil, M. Ruoff, D. P. Kern, D. A. Wharam, J. Verduijn, G. C. Tettamanzi, S. Rogge, B. Roche, R. Wacquez, X. Jehl, M. Vinet, and M. Sanquer, Nanotechnology 23, 215204 (2012).
- Roche et al. (2012) B. Roche, E. Dupont-Ferrier, B. Voisin, M. Cobian, X. Jehl, R. Wacquez, M. Vinet, Y.-M. Niquet, and M. Sanquer, Physical Review Letters 108, 206812 (2012).
- Lavieville et al. (2015) R. Lavieville, F. Triozon, S. Barraud, A. Corna, X. Jehl, M. Sanquer, J. Li, A. Abisset, I. Duchemin, and Y.-M. Niquet, Nano Letters 15, 2958 (2015).
- Voisin et al. (2016) B. Voisin, R. Maurand, S. Barraud, M. Vinet, X. Jehl, M. Sanquer, J. Renard, and S. De Franceschi, Nano Letters 16, 88 (2016).
- DiCarlo et al. (2006) L. DiCarlo, Y. Zhang, D. T. McClure, C. M. Marcus, L. N. Pfeiffer, and K. W. West, Review of Scientific Instruments 77, 073906 (2006).
- Parmentier et al. (2016) F. D. Parmentier, L. N. Serkovic-Loli, P. Roulleau, and D. C. Glattli, Physical Review Letters 116, 227401 (2016) .
- (36) See Supplemental Materials .
- Averin and Nazarov (1990) D. V. Averin and Y. V. Nazarov, Physical Review Letters 65, 2446 (1990).
- Glattli et al. (1991) D. C. Glattli, C. Pasquier, U. Meirav, F. I. B. Williams, Y. Jin, and B. Etienne, Zeitschrift für Physik B Condensed Matter 85, 375 (1991).
- Holm et al. (2008) J. V. Holm, H. I. Jørgensen, K. Grove-Rasmussen, J. Paaske, K. Flensberg, and P. E. Lindelof, Physical Review B 77, 161406 (2008).
- Splettstoesser et al. (2012) J. Splettstoesser, M. Governale, and J. König, Physical Review B 86, 035432 (2012).
- Escott et al. (2010) C. C. Escott, F. A. Zwanenburg, and A. Morello, Nanotechnology 21, 274018 (2010).
- Golovach et al. (2011) V. N. Golovach, X. Jehl, M. Houzet, M. Pierre, B. Roche, M. Sanquer, and L. I. Glazman, Physical Review B 83, 075401 (2011) .
- Villis et al. (2014) B. J. Villis, A. O. Orlov, S. Barraud, M. Vinet, M. Sanquer, P. Fay, G. Snider, and X. Jehl, Applied Physics Letters 104, 233503 (2014).
See pages 1 of Seo_MOSFET_QDs_SI_2018-06-05.pdf See pages 2 of Seo_MOSFET_QDs_SI_2018-06-05.pdf See pages 3 of Seo_MOSFET_QDs_SI_2018-06-05.pdf See pages 4 of Seo_MOSFET_QDs_SI_2018-06-05.pdf See pages 5 of Seo_MOSFET_QDs_SI_2018-06-05.pdf See pages 6 of Seo_MOSFET_QDs_SI_2018-06-05.pdf See pages 7 of Seo_MOSFET_QDs_SI_2018-06-05.pdf See pages 8 of Seo_MOSFET_QDs_SI_2018-06-05.pdf See pages 9 of Seo_MOSFET_QDs_SI_2018-06-05.pdf