An F-type ultra-fast rotator KIC 6791060: Starspot modulation and Flares
Abstract: Making use of the data obtained from Kepler satellite, we have analysed an F-type ultra-fast rotator KIC 6791060. We derive a rotational period of 0.343650.00004 d. Multiple periodicity with a period separation of 0.00016 d was detected, which appears to be a result of the relative velocity between the multiple spot-groups in different stellar latitudes due to surface differential rotation. During the observations, 38 optical flares are detected. Energies of these flares have been found to be in the range of erg. Preliminary results of surface temperature modeling indicate the existence of two active longitudes on the stellar surface.
1 Introduction
Stars with a spectral type from late-F to early-K have a convective envelope above a radiative interior with an interface where strong shear leads to amplification of magnetic fields. The observational evidence of magnetic activities are surface inhomogeneities, short and long-term variations in spot cycles, and flares. These magnetic activities are even more interesting when the rotational velocities are very high (40 km s-1). We have chosen a poorly known F-type, main sequence, ultra-fast rotator (UFR) KIC 6791060 with a period of 0.344 d (Balona 2015), -band magnitude of 10.57 mag (Høg et al. 2000), and color of 0.44 mag (Høg et al. 2000) with the aims to study the short period cycles, surface inhomogeneities, surface differential rotation (SDR) and flares.
2 Kepler observations and data processing
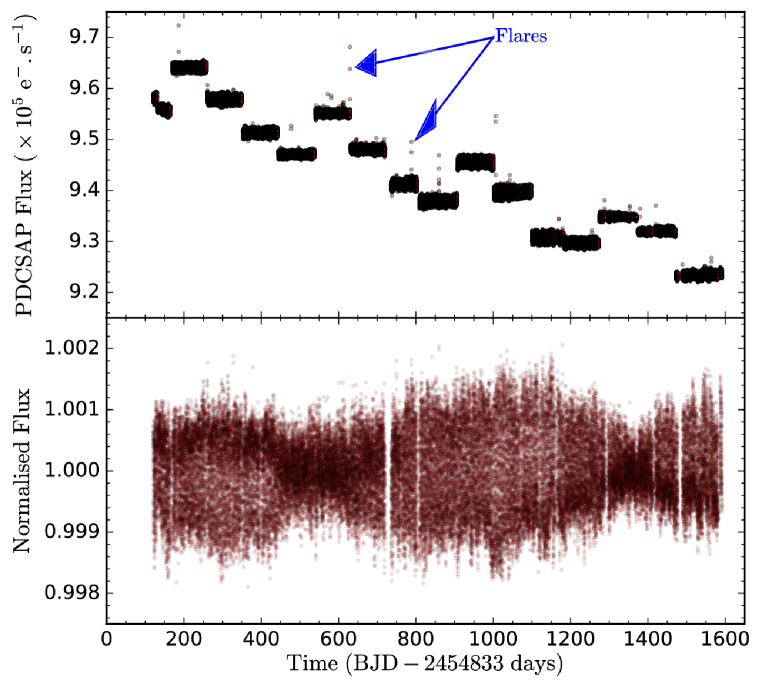
The F-type star KIC 6791060 was observed for four years from 13 December 2009 to 13 December 2013 by the Kepler satellite. The Kepler data consist of practically continuous photometry for that period. The data were subdivided into eighteen quarters with 30-min exposures (long-cadence; LC mode). In one quarter only it was observed with 1-min exposures (short-cadence; SC mode). For our analysis we used the pre-search data conditioning simple aperture photometry (PDCSAP) data in which instrumental effects are removed. The raw PDCSAP light curve obtained in LC mode is shown in upper panel of Fig. 1. For further analysis, we have subtracted a linear fit from the light curve of each individual quarter to remove any long-term calibration errors and normalised it to its average flux.
3 Light curves and period analysis
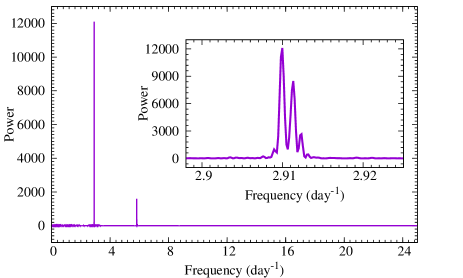
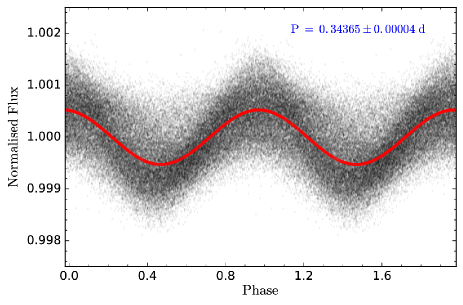
The flare/outlier-removed, flat, normalised light curve is shown in the bottom panel of Fig. 1. The light curve displays both short- and long-term flux variations with a high amplitude. We searched for periodicities in the data using the Scargle-Press period search method (Scargle 1982; Horne & Baliunas 1986; Press & Rybicki 1989). The Scargle power spectrum is shown in Fig. 3. The highest peak in the power spectrum corresponds to a period of 0.343650.00004 d, which could be the rotation period of the star. Our derived period agrees with previous determinations for KIC 6791060 (Balona 2015, McQuillan et al. 2014). In our study, another peak was also seen in the power spectrum which corresponds to a period of 0.343490.00004 d, and is separated by 0.00016 d from the rotational period. This multiple periodicity throughout the observations results in a beat pattern (minimal amplitude near 550 and 1350 days in time = BJD - 2 454 833 days; see bottom panel of Fig. 1). According to our preliminary analysis, this multiple periodicity could be a result of multiple spot groups located in different latitude while the difference in period could be due to the SDR of the star. Fig. 3 shows the phase-folded light curve of KIC 6791060, folded with the dominant frequency in the power spectrum, where the continuous line is the best fitting sinusoid. This indicates that the derived periodicity is real and shows a sinusoidal variation.
4 Flare analysis
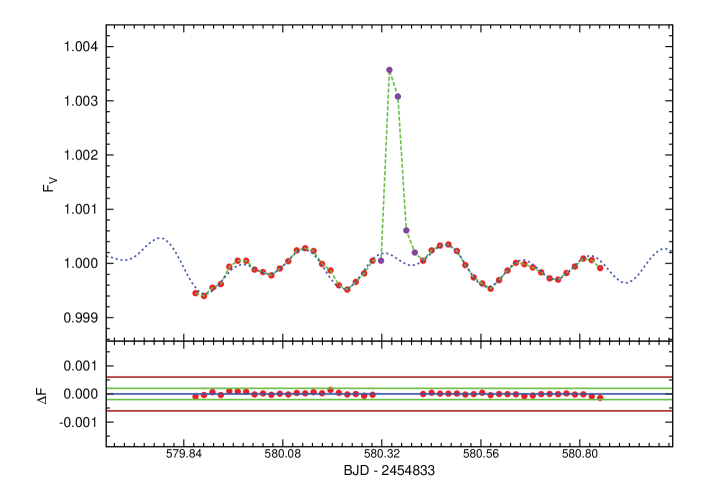
Flares are apparently visible as positive flux excursions throughout the data (see top panel of Fig. 1). In our flare identification method, we took great care so that we do not miss any small flares, and that we do not misdetect an outlier as a flare either. In order to do this job, we have used the following approach: we have computed the moving standard deviation () of the detrended light curve with a data-length equal to twice the rotational period of the star. The data points in any time segments deviating from the detrended light curve gives a larger -value and they were flagged as flare candidates. The light curves are detrended by fitting the sinusoids with periods as obtained from period analysis. All the flagged flare candidates were verified manually and identified as flare only if it contains 3 consecutive points above the 3 level. Fig. 4 shows the light curve of a sample flare on KIC 6791060. The dotted line in top panel shows the best-fit sinusoid, whereas the bottom panel shows the detrended, flare-excluded light curve along with the 1 and 3 level. A total of 38 flares were detected in KIC 6791060 with a flare rate of 1 flare per 40 days. The flare frequency is much lower than the one of G–M dwarfs. This indicates that F-dwarfs are less active than G–M dwarfs and other active UFRs like LO Peg (Karmakar et al. 2016) and AB Dor (Vilhu et al. 1993).
The flare energy is computed using the area under the flare light curve i.e. the integrated excess flux () released during the flare (from flare start-time to flare end-time ) as
| (1) |
With a distance (d) of 79 pc (Ammons et al. 2006) for KIC 6791060 the derived flare energies were found in the order of 1031-33 erg. These flare energies are similar to those of solar flares, but smaller than the ones of other active UFRs like LO Peg (Karmakar et al. 2016).
5 Summary
-
•
Using the Scargle-Press periodogram, we found the rotational period of the F-type UFR KIC 6791060 to be 0.343650.00004 d.
-
•
KIC 6791060 seems to have multiple spot-groups at different latitude over the period of observation.
-
•
A total 38 flares are identified on KIC 6791060, with a flare rate of one flare per 40 days.
-
•
The flare energies are found to be of the order of 1031-33 erg.
Acknowledgements
This paper includes data collected by the Kepler mission. Funding for the Kepler mission is provided by the NASA Science Mission directorate.
References
Balona L. A. 2015, MNRAS, 447, 2714
Høg E., Fabricius C., Makarov V. V. et al. 2000, A&A, 355, L27
Horne J. H., Baliunas S. L. 1986, ApJ, 302, 757
Karmakar S., Pandey J. C., Savanov I. S. et al. 2016, MNRAS, 459, 3112
McQuillan A., Mazeh T., Aigrain S. 2014, ApJS, 211, 24
Press W. H., Rybicki G. B. 1989, ApJ, 338, 277
Scargle J. D. 1982, ApJ, 263, 835
Vilhu O., Tsuru T., Collier Cameron A. et al. 1993, A&A, 278, 467