Quantitative spectral classification of Galactic O stars
Our goal is to provide a quantification of several spectral classification criteria for O stars. We collect high-spectral resolution spectra of 105 Galactic O-type stars from various archives. We measured equivalent widths of classification lines. We defined average values of classification criteria for given spectral types and luminosity classes. We find that the ratio He i 4471 to He ii 4542 well matches the published ratios for spectral types. We have quantified equivalent width ratios of helium and silicon lines among O8-O9.7 stars to refine spectral class typing in this spectral range. We present quantitative criteria to separate between luminosity class V, IV-III-II (grouped), and I among O3-O8.5 stars, mainly based on the strength of He ii 4686. We find that these criteria also define very well the f, (f), and ((f)) classes for O3-O7.5 stars. Among O9-O9.7 stars we quantify the ratios of He ii 4686 to He i 4713 and Si iv 4089 to He i 4026 for all luminosity classes. The tabulated values of the classification criteria should help classify any new O-type stars. The final step of the classification process should rely on a direct comparison to standard stars of the assigned spectral type or luminosity class.
Key Words.:
Stars: massive – Techniques: spectroscopic1 Introduction
Massive stars have initial masses higher than about 10 M☉. They are born as O and B stars and evolve into blue, yellow and red supergiants, Luminous Blue Variables or Wolf-Rayet stars. They end their lives as core-collapse supernovae of type II, Ib or Ic, sometimes associated with a long-soft gamma-ray burst. On and just after the main sequence they appear as O or early B stars. O stars are characterized by the presence of He ii lines in their optical spectra. The MK classification system (Morgan et al. 1943; Morgan & Keenan 1973) introduced criteria to separate O stars with different ratios of He i to He ii lines. Earlier (later) spectral types have stronger He ii (He i) lines. The second dimension of the MK classification – luminosity class – was based on the relative strength if Si iv to He i lines.
The classification scheme was refined by Walborn (1971a, b, 1972); Walborn et al. (2002). New spectral classes were introduced based on both the improved sensitivity of detectors which allowed the detection of weak lines and the addition of nitrogen and carbon lines as classification diagnostics. In particular spectral types O2 to O3.5 where introduced among the earliest O stars based on nitrogen and weak He i lines. The classification scheme developed in the above series of papers relies on the definition of standards for each spectral type and luminosity class: any newly discovered O star is classified according to its spectral similarities to these standards. A catalog of reference optical spectra for the standards stars was presented by Walborn & Fitzpatrick (1990).
In parallel, Conti & Alschuler (1971); Conti & Leep (1974); Conti & Frost (1977) and subsequently Mathys (1988, 1989) developed a classification based on measurement of equivalent widths (EWs). They defined ranges for such EWs or ratios of EWs within which a given spectral type or luminosity class was assigned. For spectral types a quantitative criterion was defined for the full range, from O3 to O9.7. However only for the latest spectral types could they quantitatively define luminosity classes. More recently, Arias et al. (2016) defined a quantitative criterion to distinguish normal dwarfs from Vz stars (stars with very strong He ii absorption lines).
These approaches (standard stars, quantitative criteria) are complementary. However since the advent of digital optical spectra, the scheme based on standard stars has been updated the most. The Galactic O Stars Spectroscopic Survey (Maíz Apellániz et al. 2011) collected medium-resolution optical spectra for essentially all the Galactic O stars. Based on this unique database, Sota et al. (2011) and Sota et al. (2014) presented refined classification criteria for both spectral types and luminosity classes. In particular, they introduced the new spectral class O9.2. But these criteria remain qualitative. For instance, luminosity classes among early O stars rely on whether He ii 4686 is in emission (supergiants), in strong absorption (giants), or in very strong absorption (dwarfs) – see Table 5 in Sota et al. (2011). A direct comparison to standard stars is thus mandatory to assess the strength of He ii 4686. This is usually not straightforward since broadening mechanisms, especially rotational broadening, affect the strength of any absorption line.
To partially reduce these difficulties, we present a quantitative study of classification criteria for spectral classes and luminosity classes among O stars. We used high-resolution optical spectra to measure equivalent widths (and ratios of EWs) for selected classification diagnostics. The results should facilitate the process of spectral classification of newly discovered stars (or of theoretical spectra). Once this is done a final comparison to standard stars spectra, for which physical parameters have been determined by Holgado et al. (2017), should validate the classification process.
2 Method
Our method relies on the measurement of equivalent widths for key classification lines. For that, we have used high spectral resolution spectra from various archives and sources:
-
•
The SOPHIE archive111http://atlas.obs-hp.fr/sophie/ (Moultaka et al. 2004a). SOPHIE is an échelle spectrograph mounted on the 193cm telescope of the Haute Provence Observatory (Bouchy et al. 2013). It covers the 3872-6943Å wavelength range with a spectral resolution of 40000. All the SOPHIE data used in the present paper have been obtained between 2014 and 2015 and have been described by Hervé (2015). Archive data result from reduction with the SOPHIE pipeline (Bouchy et al. 2009) adapted from the ESO/HARPS software.
-
•
The ELODIE archive222http://atlas.obs-hp.fr/elodie/ (Moultaka et al. 2004b). ELODIE was the precursor of SOPHIE on the 193cm telescope of the Haute Provence Observatory. It covered the 3850-6800Å wavelength range at a resolution of 42000. Details of the automated data reduction can be found on the instrument web page (see above).
-
•
The CFHT Science Archive at the Canadian Astronomical Data Center333http://www.cadc-ccda.hia-iha.nrc-cnrc.gc.ca/en/cfht/. Data from the spectro-polarimeter ESPaDOnS have been used. They cover the 3700-10500Å wavelength range with a spectral resolution of 68000. Data reduction was performed automatically with the Libre Esprit software (Donati et al. 1997). See Wade et al. (2016) for more information on the data.
-
•
The PolarBase archive of NARVAL spectra444http://tblegacy.bagn.obs-mip.fr/narval.html (Petit et al. 2014). NARVAL is a twin of ESPaDOnS mounted on the Telescope Bernard Lyot of the Pic du Midi Observatory. Data reduction was performed similarly to ESPaDOnS data.
-
•
The ESO archive555http://archive.eso.org/cms.html of FEROS spectra collected by the OWN survey (Barbá et al. 2010). FEROS is operated on the La Silla 2.2m telescope. It has a resolving power of 48000 and covers the 3500-9200Å wavelength range. Data were automatically reduced using the ESO FEROS pipeline. We also retrieved HARPSPol spectra collected on the La Silla 3.6m telescope. They cover the range 3780-6910Å with a resolution of 115000.
The list of stars and instrumental resources is given in Tab. 3. A total of 105 spectra has been collected. In practice we have measured the EWs of the following lines: He i 4026, Si iv 4089, He i 4144, He i 4388, He i 4471, He ii 4200, He ii 4542, Si iii 4552, N iii 4630-34-40, He ii 4686, and He i 4713.
3 Results
In this section we present the quantification of classification criteria for spectral types and luminosity classes.
3.1 Spectral types
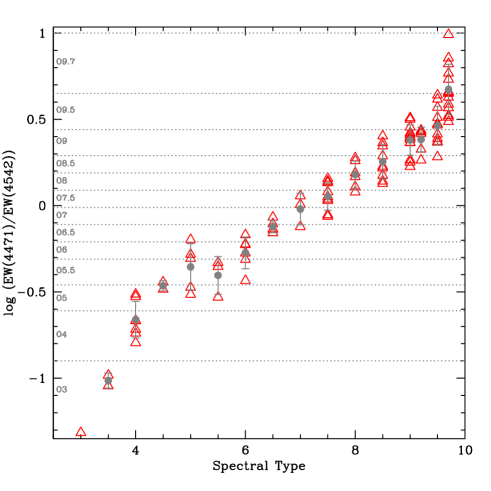
Figure 1 shows the classical spectral type criterion: the ratio of EW(He i 4471) to EW(He ii 4542) (Conti & Alschuler 1971; Morgan & Keenan 1973; Mathys 1989). We note that the O9.2, O4.5 and O3.5 spectral types are not defined in the Conti & Alschuler / Mathys classification scheme. Our average equivalent widths ratios fall nicely in the range defining each spectral type. The only exception is spectral O5 for which there is a large dispersion and an average ratio similar to the O5.5 range. The reason for this mismatch is unclear. ALS 2063 is classified as Ifp indicating peculiar lines and HD 93843 is variable: these peculiarities partly explain the large scatter in EW ratios. Removing both stars from the sample decreases the EW ratio down to the limit between spectral types O5 and O5.5. Other than that, O3.5 stars fall in the O3 range of Conti & Alschuler / Mathys and O4.5 stars have EW ratios between O4 and O5-O5.5. O9.2 stars have on average the same ratio of EW(He i 4471) to EW(He ii 4542) as O9 stars.
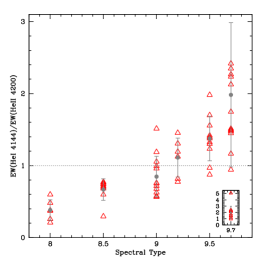
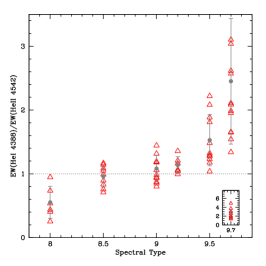
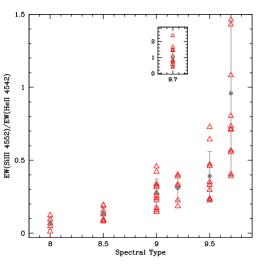
In Fig. 2 we show the three equivalent width ratios defined by Sota et al. (2011, 2014) to refine spectral classification among O8-O9.7 stars. The values of the average ratios are gathered in Table 1. We see that for the three ratios there is a clear trend with spectral type. Both He i 4388/He ii 4542 and He i 4144/He ii 4200 are larger than 1.0 for O9.5 and O9.7 stars, and lower than 1.0 for O8 stars. For O8.5, O9 and O9.2, the ratios are close to 1.0 and the range of observed values overlap. He i 4144/He ii 4200 shows a stronger variation than He i 4388/He ii 4542 across these spectral types and may be preferred to separate between them. Sota et al. (2011) define spectral type O9 as the one where He i 4144/He ii 4200 and He i 4388/He ii 4542 are about 1.0: our results are consistent with this definition. There is a large overlap in the equivalent width ratios at spectral types O9.5 and O9.7. The main difference is that much larger values (up to between three and five) are reached at O9.7, whereas the ratios are limited to 2 at O9.5. The ratio Si iii 4552/He ii 4542 follows a monotonic variation in the spectral range covered, being almost 0.0 at O8 and reaching 1.0 at O9.7 which corresponds to the definition of the O9.7 spectral type (Sota et al. 2011).
These findings are consistent with the qualitative classification proposed by Sota et al. (2014) – see their Table 3. The only difference is the separation between O9 and O9.2: we find that the two sub-classes can be distinguished only from He i 4144/He ii 4200. For the other two ratios, there is no significant difference. But we also stress that the number of O9.2 stars in our sample remains small (six, versus thirteen O9 stars) and thus this result may be revised in future studies. We note that our ratios are expressed in terms of equivalent widths, while Sota et al. (2011, 2014) define ratios of peak intensities. A test of the effect of these different definitions on the ratio He i 4144/He ii 4200 reveals that the same trends are observed if peak intensities are used instead of equivalent widths.
| Spectral type | |||
|---|---|---|---|
| O8 | 0.380.14 | 0.550.25 | 0.070.04 |
| O8.5 | 0.670.15 | 0.960.17 | 0.130.04 |
| O9 | 0.850.28 | 1.080.20 | 0.280.09 |
| O9.2 | 1.110.27 | 1.140.13 | 0.310.09 |
| O9.5 | 1.370.32 | 1.530.40 | 0.390.17 |
| O9.7 | 1.981.00 | 2.450.99 | 0.960.57 |
3.2 Luminosity class
3.2.1 O3-O7.5 stars
The main luminosity class criterion for stars with spectral type earlier than O7.5 is the strength of He ii 4686. It is usually accompanied by considering the strength of the N iii 4634-40-42 emission complex. The morphology of both the He ii and N iii lines also defines the “f” phenomenon: ((f)) stars have weak nitrogen emission and strong helium absorption; (f) stars have medium nitrogen emission and neutral or weak helium absorption; f stars have strong nitrogen and helium emission.
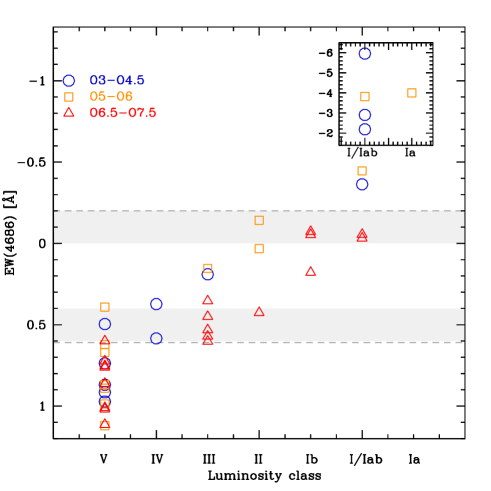
In Fig. 3 we show the equivalent width of He ii 4686 for stars of different luminosity classes. All stars with an equivalent width larger than 0.60 Å are dwarfs. Equivalently, all stars with EW(He ii 4686) smaller than -0.20 Å (i.e., emission stronger than 0.20 Å) are supergiants of class I/Iab or Ia. We thus propose these limits to uniquely (but not exclusively) define dwarfs and supergiants. Gray shaded areas in Fig. 3 indicate transition regions between dwarfs and giants, and between giants and supergiants. More precisely, there is no dwarf with EW(He ii 4686) smaller than 0.40 Å. In the range 0.40–0.60 Å, stars can be dwarfs or sub-giants, giants, or bright giants. Similarly, all but one666HD 156154, a O7.5Ib star, has EW(He ii 4686)=0.18 Å of the bright giants and supergiants have negative EW(He ii 4686), meaning that they have He ii 4686 mainly in emission. Hence stars with EW(He ii 4686) between 0.00 and -0.20 Å can be bright giants or supergiants. For stars in these two transition regions (0.40–0.60 Å and -0.20–0.00 Å), we suggest a direct comparison to standard spectra for a final luminosity class determination.
From Fig. 3 we note that for giants and supergiants EW(He ii 4686) is on average smaller (i.e., more emission) among O3-O6 stars compared to O6.5-O7.5 stars. For instance, there is no O6.5-O7.5 giant (luminosity class IV, III and II) with EW smaller than 0.30 Å, while almost all the O3-O6 giants have smaller EWs. Similarly there is no O6.5-O7.5 supergiant with EW smaller than -0.20 Å while all O3-O6 supergiants have more emission.
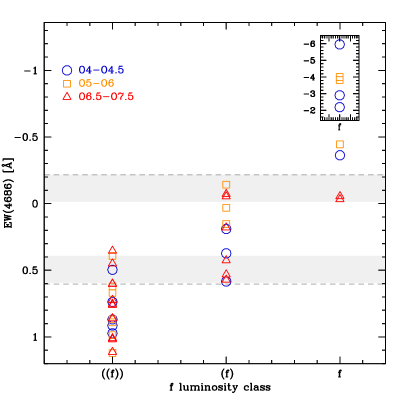
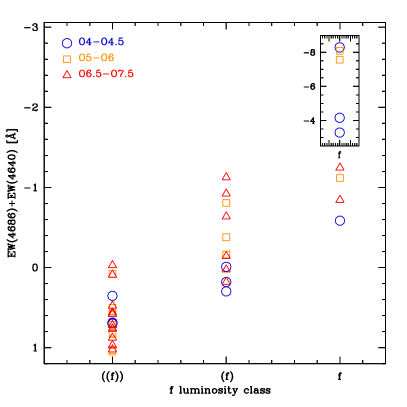
Interestingly, the equivalent width ranges just discussed define remarkably well the three ((f)), (f) and f categories if one considers only EW(He ii 4686), as illustrated in the left panel of Fig. 4. All stars with an equivalent width larger than 0.60 Å (respectively smaller than -0.20 Å) have the ((f)) (respectively the f) classification. Stars classified has (f) objects have EW exactly in between these two values. The range 0.00–0.40 Å is populated uniquely by (f) stars. For EW(He ii 4686) between 0.40 and 0.60 Å there are both ((f)) and (f) stars while for EW(He ii 4686) between 0.00 and -0.20 Å, there are (f) and f stars (gray shaded areas in Fig. 4.) When taking the full definition of the “f” phenomenon (right panel of Fig. 4) the three groups of stars remain well separated. From these two figures one concludes that the “f” phenomenon can be entirely defined by just the equivalent width of He ii 4686, and that the ranges in EW(He ii 4686) defining the luminosity classes V, IV-III-II (grouped) and I can also be used to define the ((f)), (f) and f categories. We thus advise the following quantitative classification scheme:
-
•
For stars with EW(He ii 4686) 0.60, a luminosity class V together with a ((f)) qualifier can be assigned.
-
•
For stars with EW(He ii 4686) -0.20, a luminosity class I (Iab or Ia) and a f qualifier can be assigned.
-
•
For stars with -0.20 EW(He ii 4686) 0.60, various luminosity classes and “f” qualifier can be assigned with the restriction that EWs between 0.00 and 0.40 Å correspond uniquely to the (f) qualifier.
Clearly for equivalent widths close to the above limits, special care must be taken when assigning a luminosity class and comparison to standard stars spectra is advised. Our proposed scheme is generally consistent with Table 2 of Sota et al. (2014) which relates the f qualifier to luminosity classes for various spectral types.
3.2.2 O8-O8.5 stars
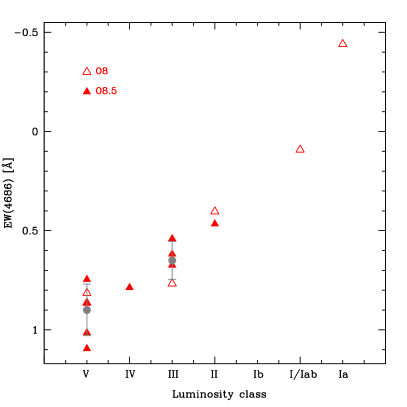
At spectral types O8 and O8.5 the strength of He ii 4686 remains the main luminosity class criterion. However, the mass loss rates are lower than at earlier spectral types so that the strength of He ii 4686 is weaker for a given luminosity class, as was already the case between O3-O6 and O6.5-O7.5 (see above). In addition, the “f” qualifier is seldom used for O8-O8.5 stars. Consequently, a dedicated luminosity classification scheme is defined for these spectral types. In Fig. 5 we show the equivalent width of He ii 4686 as a function of luminosity class for the fifteen O8-O8.5 stars of our sample. There is a clear trend of less absorption/more emission when moving from dwarfs to supergiants. We note the small number of stars in the supergiant classes. This is mainly due to the very small number of O8-O8.5 supergiants known: in the catalog of Maíz Apellániz et al. (2016) there are only seven (six) O8 (O8.5) supergiants (of all subclasses Ia, Iab, and Ib). The O8-O8.5 supergiants are thus a rare class of objects. For these reasons we provide the average value of EW(He ii 4686) only for dwarfs and giants: 0.900.13 for the former, 0.650.10 for the latter.
3.2.3 O9-O9.7 stars
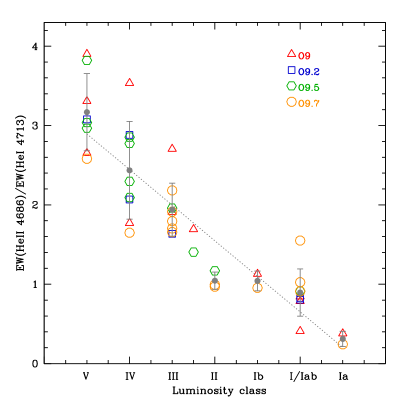
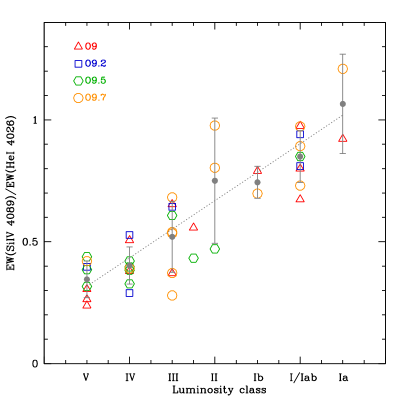
Luminosity classes in the O9-O9.7 spectral type range are best defined using the following two ratios: and (Sota et al. 2011, 2014). These ratios are shown in Fig. 6. For both ratios, there is a clear variation among the entire luminosity class range. The former varies by a factor of about ten between dwarfs and type Ia supergiants. For the latter, the variation is of a factor 3. Although the ranges covered by a given ratio usually overlap between neighboring luminosity classes, the average values show monotonic variations (with the exception of the II class, due to the small number of objects). We note the absence of differences between spectral types: O9 stars cover almost the same range of ratios as O9.5 stars. However, we stress that this is likely due to small number statistics. Future studies based on hundreds of spectra may reveal variations unseen in our sample.
Sota et al. (2011) indicate that a ratio of about one in the ratio of the intensities of He ii 4686 to He i 4713 is reached for bright giants (luminosity class II) with small rotational broadening. In our case, where we use equivalent widths, the ratio of 1.0 corresponds more to Ib stars. We stress that we prefer the ratio of equivalent width since in our sample the ratio based on intensities is basically the same for luminosity classes V, IV and III. It is thus less discriminant.
We advise to use Fig. 6 as a first guess for luminosity class assignment. After computing the observed ratios, they can be plotted on top of Fig. 6 to assign a luminosity class. Table 2 also gathers the average values (and dispersion) of the ratios shown in Fig. 6. Final luminosity class assignment or verification should rely on comparison to standard stars spectra.
Finally we note that Conti & Alschuler (1971) used the ratio for luminosity class determination. We found that this ratio is indeed correlated with luminosity class, but in our measurements the dispersion is much larger than for . We thus prefer to rely on the latter ratio, as also advocated by Sota et al. (2011). Sota et al. (2014) also note that the ratios He ii 4686 to He i 4713 and Si iv 4089 to He i 4026 can lead to discrepant results, especially in the case of unresolved spectroscopic binaries. In Fig. 6 HD 225146, a O9.7Iab star according to Sota et al. (2011), has a high ratio that would better correspond to a luminosity class II (or marginally III) according to our results. Its ratio is also more consistent with a II or Ib star. This shows that, as stated by Sota et al. (2014), different line ratios can lead to different luminosity classes. In addition, our quantitative criteria, if used to reassign luminosity classes, can lead to revision compared to the qualitative classification processes. In the case of HD 225146 one would probably assign a luminosity class II using Fig. 6 instead of Iab from comparison to standard stars. This stresses that spectral classification can have low precision due to the diversity of criteria and morphology among spectral features.
| Luminosity Class | ||
|---|---|---|
| V | 3.170.49 | 0.35 0.07 |
| IV | 2.440.62 | 0.40 0.08 |
| III | 1.940.33 | 0.52 0.15 |
| II | 1.040.11 | 0.75 0.26 |
| Ib | 1.040.12 | 0.74 0.07 |
| I/Iab | 0.900.30 | 0.85 0.11 |
| Ia | 0.310.10 | 1.07 0.20 |
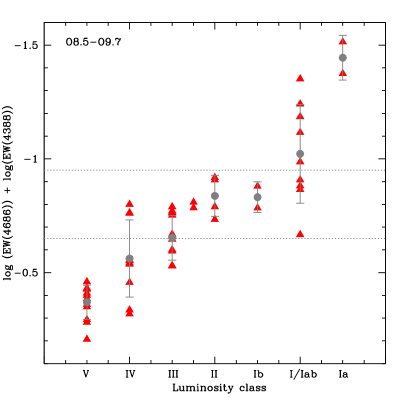
For completeness we show in Fig. 7 the luminosity class criterion for O8.5-O9.7 stars as defined by Mathys (1989). There is a clear trend with luminosity class. In particular, luminosity classes V, III, and Iab-Ia are well separated. For other luminosity classes, overlap with neighboring classes is significant. For instance, luminosity class II stars have that can be those of giants or Ib stars. The limits defined by Mathys (1989) are only partly consistent with our measurements. Dwarfs fall in the Mathys range, but giants (LC III) and supergiants (except Ia) overlap between the V–III and III-I ranges of Mathys. We may tentatively attribute this discrepancy to the limited spectral resolution of the Mathys spectra (R5200).
4 Conclusion
We have collected high-resolution optical spectra of 105 Galactic O-type stars from public archives (ELODIE, SOPHIE, CFHT Science, ESO and PolarBase archives). We have measured equivalent widths of key classification lines. We have calculated the average and dispersion of classification criteria for given spectral types and luminosity classes. We have defined ranges of equivalent widths of He ii 4686 for various luminosity classes among O3-O8.5 stars and for the “f” phenomenon. We have presented quantative spectral type and luminosity class criteria for O8-O9.7 stars. The tabulated values should be used for spectral classification prior to a final comparison to standard stars spectra of the assigned spectral type and luminosity class. Our results should be improved and refined in the future when hundreds of high-resolution spectra of O stars currently collected by spectroscopic surveys (Barbá et al. 2010; Simón-Díaz et al. 2015) are available.
Acknowledgements.
We acknowledge a timely and construtive report from the referee, J. Maíz-Apellániz. Many thanks to R. Barbá for allowing the use of FEROS archive spectra prior to publication and following the referee’s suggestion. This research used the ELODIE and SOPHIE archives developed and maintained by OHP/INSU-CNRS/OSU Pytheas; the PolarBase archive developed and maintained by OMP/INSU-CNRS/Toulouse University; the facilities of the Canadian Astronomy Data Centre operated by the National Research Council of Canada with the support of the Canadian Space Agency. This research has made use of the services of the ESO Science Archive Facility.References
- Arias et al. (2016) Arias, J. I., Walborn, N. R., Simón Díaz, S., et al. 2016, AJ, 152, 31
- Barbá et al. (2010) Barbá, R. H., Gamen, R., Arias, J. I., et al. 2010, in Revista Mexicana de Astronomia y Astrofisica, vol. 27, Vol. 38, Revista Mexicana de Astronomia y Astrofisica Conference Series, 30–32
- Bouchy et al. (2013) Bouchy, F., Díaz, R. F., Hébrard, G., et al. 2013, A&A, 549, A49
- Bouchy et al. (2009) Bouchy, F., Hébrard, G., Udry, S., et al. 2009, A&A, 505, 853
- Conti & Alschuler (1971) Conti, P. S. & Alschuler, W. R. 1971, ApJ, 170, 325
- Conti & Frost (1977) Conti, P. S. & Frost, S. A. 1977, ApJ, 212, 728
- Conti & Leep (1974) Conti, P. S. & Leep, E. M. 1974, ApJ, 193, 113
- Donati et al. (1997) Donati, J.-F., Semel, M., Carter, B. D., Rees, D. E., & Collier Cameron, A. 1997, MNRAS, 291, 658
- Hervé (2015) Hervé, A. 2015, in SF2A-2015: Proceedings of the Annual meeting of the French Society of Astronomy and Astrophysics, ed. F. Martins, S. Boissier, V. Buat, L. Cambrésy, & P. Petit, 381–384
- Holgado et al. (2017) Holgado, G., Simón-Díaz, S., Barbá, R. H., et al. 2017, ArXiv e-prints [arXiv:1711.10043]
- Maíz Apellániz et al. (2016) Maíz Apellániz, J., Sota, A., Arias, J. I., et al. 2016, ApJS, 224, 4
- Maíz Apellániz et al. (2011) Maíz Apellániz, J., Sota, A., Walborn, N. R., et al. 2011, in Highlights of Spanish Astrophysics VI, ed. M. R. Zapatero Osorio, J. Gorgas, J. Maíz Apellániz, J. R. Pardo, & A. Gil de Paz, 467–472
- Mathys (1988) Mathys, G. 1988, A&AS, 76, 427
- Mathys (1989) Mathys, G. 1989, A&AS, 81, 237
- Morgan & Keenan (1973) Morgan, W. W. & Keenan, P. C. 1973, ARA&A, 11, 29
- Morgan et al. (1943) Morgan, W. W., Keenan, P. C., & Kellman, E. 1943, An atlas of stellar spectra, with an outline of spectral classification
- Moultaka et al. (2004a) Moultaka, J., Ilovaisky, S., Prugniel, P., & Soubiran, C. 2004a, in SF2A-2004: Semaine de l’Astrophysique Francaise, ed. F. Combes, D. Barret, T. Contini, F. Meynadier, & L. Pagani, 547
- Moultaka et al. (2004b) Moultaka, J., Ilovaisky, S. A., Prugniel, P., & Soubiran, C. 2004b, PASP, 116, 693
- Petit et al. (2014) Petit, P., Louge, T., Théado, S., et al. 2014, PASP, 126, 469
- Simón-Díaz et al. (2015) Simón-Díaz, S., Negueruela, I., Maíz Apellániz, J., et al. 2015, in Highlights of Spanish Astrophysics VIII, ed. A. J. Cenarro, F. Figueras, C. Hernández-Monteagudo, J. Trujillo Bueno, & L. Valdivielso, 576–581
- Sota et al. (2014) Sota, A., Maíz Apellániz, J., Morrell, N. I., et al. 2014, ApJS, 211, 10
- Sota et al. (2011) Sota, A., Maíz Apellániz, J., Walborn, N. R., et al. 2011, ApJS, 193, 24
- Wade et al. (2016) Wade, G. A., Neiner, C., Alecian, E., et al. 2016, MNRAS, 456, 2
- Walborn (1971a) Walborn, N. R. 1971a, ApJ, 164, L67
- Walborn (1971b) Walborn, N. R. 1971b, ApJ, 167, L31
- Walborn (1972) Walborn, N. R. 1972, AJ, 77, 312
- Walborn & Fitzpatrick (1990) Walborn, N. R. & Fitzpatrick, E. L. 1990, PASP, 102, 379
- Walborn et al. (2002) Walborn, N. R., Howarth, I. D., Lennon, D. J., et al. 2002, AJ, 123, 2754
Appendix A Observational material
| Star | ST | LC | Additional | Spectrograph |
|---|---|---|---|---|
| qualifier | ||||
| HD 64568 | 3 | V | ((f*))z | FEROS |
| HD 319718 | 3.5 | I | f* | FEROS |
| HD 93205 | 3.5 | V | ((f)) | FEROS |
| HD 15570 | 4 | I | f | SOPHIE |
| HD 16691 | 4 | I | f | ELODIE |
| HD 66811 | 4 | I | (n)fp | FEROS |
| HD 93250 | 4 | IV | (fc) | FEROS |
| HD 164794 | 4 | V | ((f)) | FEROS |
| HD 96715 | 4 | V | ((f))z | FEROS |
| HD 46223 | 4 | V | ((f)) | SOPHIE |
| HD 15558 | 4.5 | III | (f) | ELODIE |
| HD 192281 | 4.5 | IV | (n)(f) | SOPHIE |
| ALS 2063 | 5 | I | fp | FEROS |
| CPD -47 2963 | 5 | I | fc | FEROS |
| HD 93843 | 5 | III | (fc) | FEROS |
| HD 46150 | 5 | V | ((f)) | SOPHIE |
| HD 319699 | 5 | V | ((fc)) | FEROS |
| BD -16 4826 | 5.5 | V | ((f))z | FEROS |
| CPD -59 2673 | 5.5 | V | (n)((f))z | FEROS |
| HD 93204 | 5.5 | V | ((f)) | FEROS |
| HD 153919 | 6 | Ia | fcp | ESPaDOnS |
| HDE 229196 | 6 | II | (f) | SOPHIE |
| HD 152233 | 6 | II | (f)) | FEROS |
| CPD -59 2600 | 6 | V | ((f)) | FEROS |
| HD 303311 | 6 | V | ((f))z | FEROS |
| HD 42088 | 6 | V | ((f))z | SOPHIE |
| HD 190864 | 6.5 | III | (f) | SOPHIE |
| HD 17505 | 6.5 | III | n(f) | ELODIE |
| HD 12993 | 6.5 | V | ((f))Nstr | SOPHIE |
| HD 228841 | 6.5 | V | n((f)) | SOPHIE |
| HD 199579 | 6.5 | V | ((f))z | ESPaDOnS |
| HD 193514 | 7 | Ib | (f) | SOPHIE |
| HDE 242926 | 7 | V | z | SOPHIE |
| HD 47839 | 7 | V | ((f))z | ESPaDOnS |
| HD 188001 | 7.5 | Iab | f | ESPaDOnS |
| HD 192639 | 7.5 | Iab | f | SOPHIE |
| HD 17603 | 7.5 | Ib | (f) | SOPHIE |
| HD 156154 | 7.5 | Ib | (f) | ESPaDOnS |
| HD 34656 | 7.5 | II | (f) | SOPHIE |
| HD 186980 | 7.5 | III | ((f)) | ESPaDOnS |
| HD 203064 | 7.5 | III | n((f)) | ESPaDOnS |
| HD 24912 | 7.5 | III | (n)((f)) | SOPHIE |
| HD 35619 | 7.5 | V | ((f)) | ESPaDOnS |
| HD 36879 | 7.5 | V | (n)((f)) | ESPaDOnS |
| HD 155806 | 7.5 | V | ((f)) | ESPaDOnS |
| HD 164492 | 7.5 | V | z | ESPaDOnS |
| HD 151804 | 8 | Ia | f | HARPSpol |
| HD 225160 | 8 | Iab | f | SOPHIE |
| HD 162978 | 8 | II | ((f)) | ESPaDOnS |
| HD 36861 | 8 | III | ((f)) | ESPaDOnS |
| HD 191978 | 8 | V | SOPHIE | |
| HD 66788 | 8 | V | ESPaDOnS |
| Star | ST | LC | Additional | Spectrograph |
|---|---|---|---|---|
| qualifier | ||||
| HD 207198 | 8.5 | II | ((f)) | SOPHIE |
| HD 218195 | 8.5 | III | SOPHIE | |
| HD 153426 | 8.5 | III | ESPaDOnS | |
| HD 13268 | 8.5 | III | ELODIE | |
| HD 46966 | 8.5 | IV | SOPHIE | |
| HD 46149 | 8.5 | V | SOPHIE | |
| HD 14633 | 8.5 | V | SOPHIE | |
| HD 216532 | 8.5 | V | (n) | ELODIE |
| HD 48279 | 8.5 | V | ELODIE | |
| HD 30614 | 9 | Ia | SOPHIE | |
| HD 152249 | 9 | Iab | ESPaDOnS | |
| HD 202124 | 9 | Iab | SOPHIE | |
| HD 210809 | 9 | Iab | ESPaDOnS | |
| HD 209975 | 9 | Ib | SOPHIE | |
| HD 16429 | 9 | III-II | (n) | ELODIE |
| HD 193443 | 9 | III | ESPaDOnS | |
| HD 24431 | 9 | III | SOPHIE | |
| HD 193322 | 9 | IV | (n) | ESPaDOnS |
| HD 209481 | 9 | IV | (n) | ESPaDOnS |
| HD 214680 | 9 | V | SOPHIE | |
| HD 207898 | 9 | V | ELODIE | |
| HD 258691 | 9 | V | ESPaDOnS | |
| HD 154368 | 9.2 | Iab | ESPaDOnS | |
| HD 218915 | 9.2 | Iab | ESPaDOnS | |
| HD 152247 | 9.2 | III | ESPaDOnS | |
| HD 149757 | 9.2 | IV | nn | NARVAL |
| HD 201345 | 9.2 | IV | ESPaDOnS | |
| HD 46202 | 9.2 | V | ESPaDOnS | |
| HD 188209 | 9.5 | Iab | SOPHIE | |
| HD 36486 | 9.5 | II | ELODIE | |
| HD 15137 | 9.5 | III-II | n | ELODIE |
| HD 167263 | 9.5 | III | ESPaDOnS | |
| HD 192001 | 9.5 | IV | SOPHIE | |
| HD 36483 | 9.5 | IV | ELODIE | |
| HD 155889 | 9.5 | IV | HARPSpol | |
| HD 206183 | 9.5 | V-IV | ESPaDOnS | |
| BD+60 499 | 9.5 | V | ESPaDOnS | |
| HD 34078 | 9.5 | V | SOPHIE | |
| HD 38666 | 9.5 | V | SOPHIE | |
| HD 195592 | 9.7 | Ia | SOPHIE | |
| HD 167264 | 9.7 | Iab | NARVAL | |
| HD 225146 | 9.7 | Iab | SOPHIE | |
| HD 149038 | 9.7 | Iab | ESPaDOnS | |
| HD 47432 | 9.7 | Ib | SOPHIE | |
| HD 328856 | 9.7 | II | ESPaDOnS | |
| HD 13745 | 9.7 | II | (n) | NARVAL |
| HD 55879 | 9.7 | III | ESPaDOnS | |
| HD 46106 | 9.7 | III | (n) | ESPaDOnS |
| HD 189957 | 9.7 | III | SOPHIE | |
| HD 37468 | 9.7 | III | ESPaDOnS | |
| HD 154643 | 9.7 | III | ESPaDOnS | |
| HD 207538 | 9.7 | IV | SOPHIE | |
| HD 36512 | 9.7 | V | NARVAL |