NOEMA Observations of a Molecular Cloud in the low-metallicity Galaxy Kiso 5639
Abstract
A giant star-forming region in a metal-poor dwarf galaxy has been observed in optical lines with the 10-m Gran Telescopio Canarias and in the emission line of CO(1-0) with the NOEMA mm-wave interferometer. The metallicity was determined to be , from which we estimate a conversion factor of and a molecular cloud mass of . This is an enormous concentration of molecular mass at one end of a small galaxy, suggesting a recent accretion. The molecular cloud properties seem normal: the surface density, pc-2, is comparable to that of a standard giant molecular cloud, the cloud’s virial ratio of is in the star-formation range, and the gas consumption time, Gyr, at the present star formation rate is typical for molecular regions. The low metallicity implies that the cloud has an average visual extinction of only mag, which is close to the threshold for molecule formation. With such an extinction threshold, molecular clouds in metal-poor regions should have high surface densities and high internal pressures. If high pressure is associated with the formation of massive clusters, then metal-poor galaxies such as dwarfs in the early universe could have been the hosts of metal-poor globular clusters.
Subject headings:
ISM: molecules — galaxies: dwarf — galaxies: individual (Kiso 5639) — galaxies: ISM — galaxies: star formationI. Introduction
Kiso 5639 (Miyauchi-Isobe, Maehara, & Nakajima, 2010) is a dwarf galaxy with a kpc-size starburst at one end, giving the system a tadpole or cometary shape (Elmegreen et al., 2012). The rotation speed of km s-1 (Sánchez Almeida et al., 2013) combined with a radius of 1.2 kpc in the bright part of the disk implies that the dynamical mass there is , which is a factor of larger than the stellar mass of from Sloan Digital Sky Survey photometry (Elmegreen et al., 2012) and comparable to the total Hi mass of (Salzer et al., 2002).
The galaxy is a member of our spectroscopic survey of 22 low metallicity dwarfs where the metallicity in the starburst “head” appears to be less than in the rest of the galaxy (the “tail”); 16 others in this survey have the same metallicity drop, 3 do not and 2 are ambiguous (Sánchez Almeida et al., 2013, 2014, 2015). This peculiar pattern of metallicity suggests that the starbursts in these systems were triggered by accreting gas with lower metallicity than in the rest of the galaxy. Other examples of metallicity drops were reported in Levesque et al. (2011), Haurberg et al. (2013) and Lagos et al. (2018).
HST observations of Kiso 5639 (Elmegreen et al., 2016) in six UV-optical and H filters were used to resolve the head and derive the star formation properties. The head contains 14 young star clusters more massive than and an overall clustering fraction for star formation of %. The H luminosity of the core region of the head is erg s-1 inside an area of square arcsec. The corresponding star formation rate is yr-1. This rate is based on a conversion factor of yr that is appropriate for low metallicity, which introduces a factor of times the standard value (Hunter et al., 2010; Kennicutt & Evans, 2012). For a distance of 24.5 Mpc (Elmegreen et al., 2012), the corresponding area is kpc2 ( square pc), and the star formation rate per unit area is pc-2 Myr -1.
This is a high rate for a small galaxy and it suggests there is a large reservoir of dense gas in the head. For the conventional molecular gas consumption time of Gyr (Bigiel et al., 2008), the molecular mass surface density would be pc-2, which is times higher than the average stellar surface density and times higher than the average dynamical surface density in the bright part of the disk. For the Kennicutt-Schmidt relation in whole galaxies from Figure 11 in Kennicutt & Evans (2012), the required gas surface density would be pc-2. These high gas surface densities suggest that Kiso 5639 is lopsided and recently accreted at least of gas on one side. Simulations of such a process are in Verbeke et al. (2014) and Ceverino et al. (2016).
Detection of CO emission from the head of Kiso 5639 would help to clarify the situation. The metallicity of this galaxy, determined with the 2.5m Nordic Optical Telescope from the [NII] to H line ratio in Sánchez Almeida et al. (2013), was . CO is highly underabundant compared to H2 at low metallicity (Leroy et al., 2011). The lowest metallicities in regions detected in CO, i.e., in Sextens A and DDO 70 (Shi et al., 2015, 2016) and 7.8 in WLM (Elmegreen et al., 2013; Rubio et al., 2015) occur in dwarf Irregular galaxies where the CO clouds are small and in the centers of large HI and H2 clouds. For the large molecular mass expected in Kiso 5639 and in other galaxies of its type, CO emission should be more evident.
To search for CO in Kiso 5639, we observed CO(1-0) in the head region with NOEMA in D configuration. The result was a detection corresponding to a gas surface density similar to that estimated above, depending on the assumed conversion factor. Because the metallicity is important for this , we re-observed Kiso 5639 in several optical lines including [OII]3727 and [OIII]4363 using the 10m Gran Telescopio Canarias (GTC) to get the metallicity again. The observations, results, and implications are discussed in the next three sections.
II. Observations
II.1. Metallicity
The metallicity of Kiso 5639 is central to the discussion on the origin of the CO emission. Sánchez Almeida et al. (2013) found a drop in metallicity coinciding with its largest star-forming region, with the value of . This estimate was based on the strong-line ratio N2 ()), which is known to have biases (e.g., Morales-Luis et al., 2014). On the other hand, the SDSS spectrum of the region gives a metallicity of around 7.8 when using either the direct method (DM) or the HIICM procedure by Perez-Montero (2014) (Ruben García-Benito 2017, private communication). In order to remove uncertainties and secure the metallicity estimate, we obtained long-slit spectra of the galaxy integrating for 2.5 hours with the instrument OSIRIS at the 10-m GTC telescope. The slit was placed along the major axis.
The resulting visible spectra cover from 3600 Å to 7200 Å with a spectral resolution around 550, thus containing all the spectral lines listed below that are needed for the metallicity measurement, including the critically important temperature sensitive line [OIII]4363. The data were calibrated in flux and wavelength using PyRAF111http://www.stsci.edu/institute/softwarehardware/pyraf, and Gaussian fits provided the fluxes of the emission lines. We employed the code HIICM to infer O/H, which requires [OII]3727, [OIII]4363, H, [OIII]5007, H, [NII]6583, and [SII]6717,6737. HIICM was chosen because it is robust and equivalent to the direct method when [OIII]4363 is available (Pérez-Montero, 2014; Sánchez Almeida et al., 2016). The oxygen abundance thus obtained was , considering around the star-forming region. HIICM estimates error bars from the difference between the observed line fluxes and those predicted by the best fitting photoionization model. The inferred metallicity is similar when all the spectra of the galaxy are integrated (), and even if only spectra from the faint tail are considered (). HIICM also provides N/O, which turns out to be roughly constant with a value around , typical for the metallicity assigned to Kiso 5639 (e.g., Vincenzo et al., 2016).
Curiously, the new data still show a slight metallicity drop at the head from the N2 method, down to , with the same value, , as for the HIICM measurements elsewhere. There is also a slight indication of a drop in N/O in the head, by a factor of , which is a deviation for the head measurement compared to the average in the tail, but only a devitation for the weaker tail measurement in comparison to the head. This apparent drop in head metallicity from the [NII] line explains the measurement in Sánchez Almeida et al. (2013), but it is not viewed as relevant for our CO observations, which need the Oxygen abundance. Thus we use the HIICM value of to determine in the head where CO is detected.
II.2. CO Observations
We obtained observations of Kiso 5639 on May, July and August 2017, with the Northern Extended Millimeter Array (NOEMA) at Plateau de Bure, in the CO () line, at 114.572 GHz redshifted to the velocity of Kiso 5639. The observations were carried out with either 7 or 8 antennas in Configuration D, with baselines between 15 m and 175 m. We used the Widex correlator, with a total bandwidth of 3.6 GHz and a native spectral resolution of 1.95 MHz (5.1 km s-1).
Data reduction, calibration and imaging were performed with CLIC and MAPPING softwares of GILDAS222http://www.iram.fr/IRAMFR/GILDAS/, using standard procedures. Images were reconstructed using the natural weighting, resulting in a synthesized beam of 2837 (PA=26∘). The rms noise in the CO cube is 14.3 mK (1.6 mJy beam-1) in a 5.1 km s-1 channel.
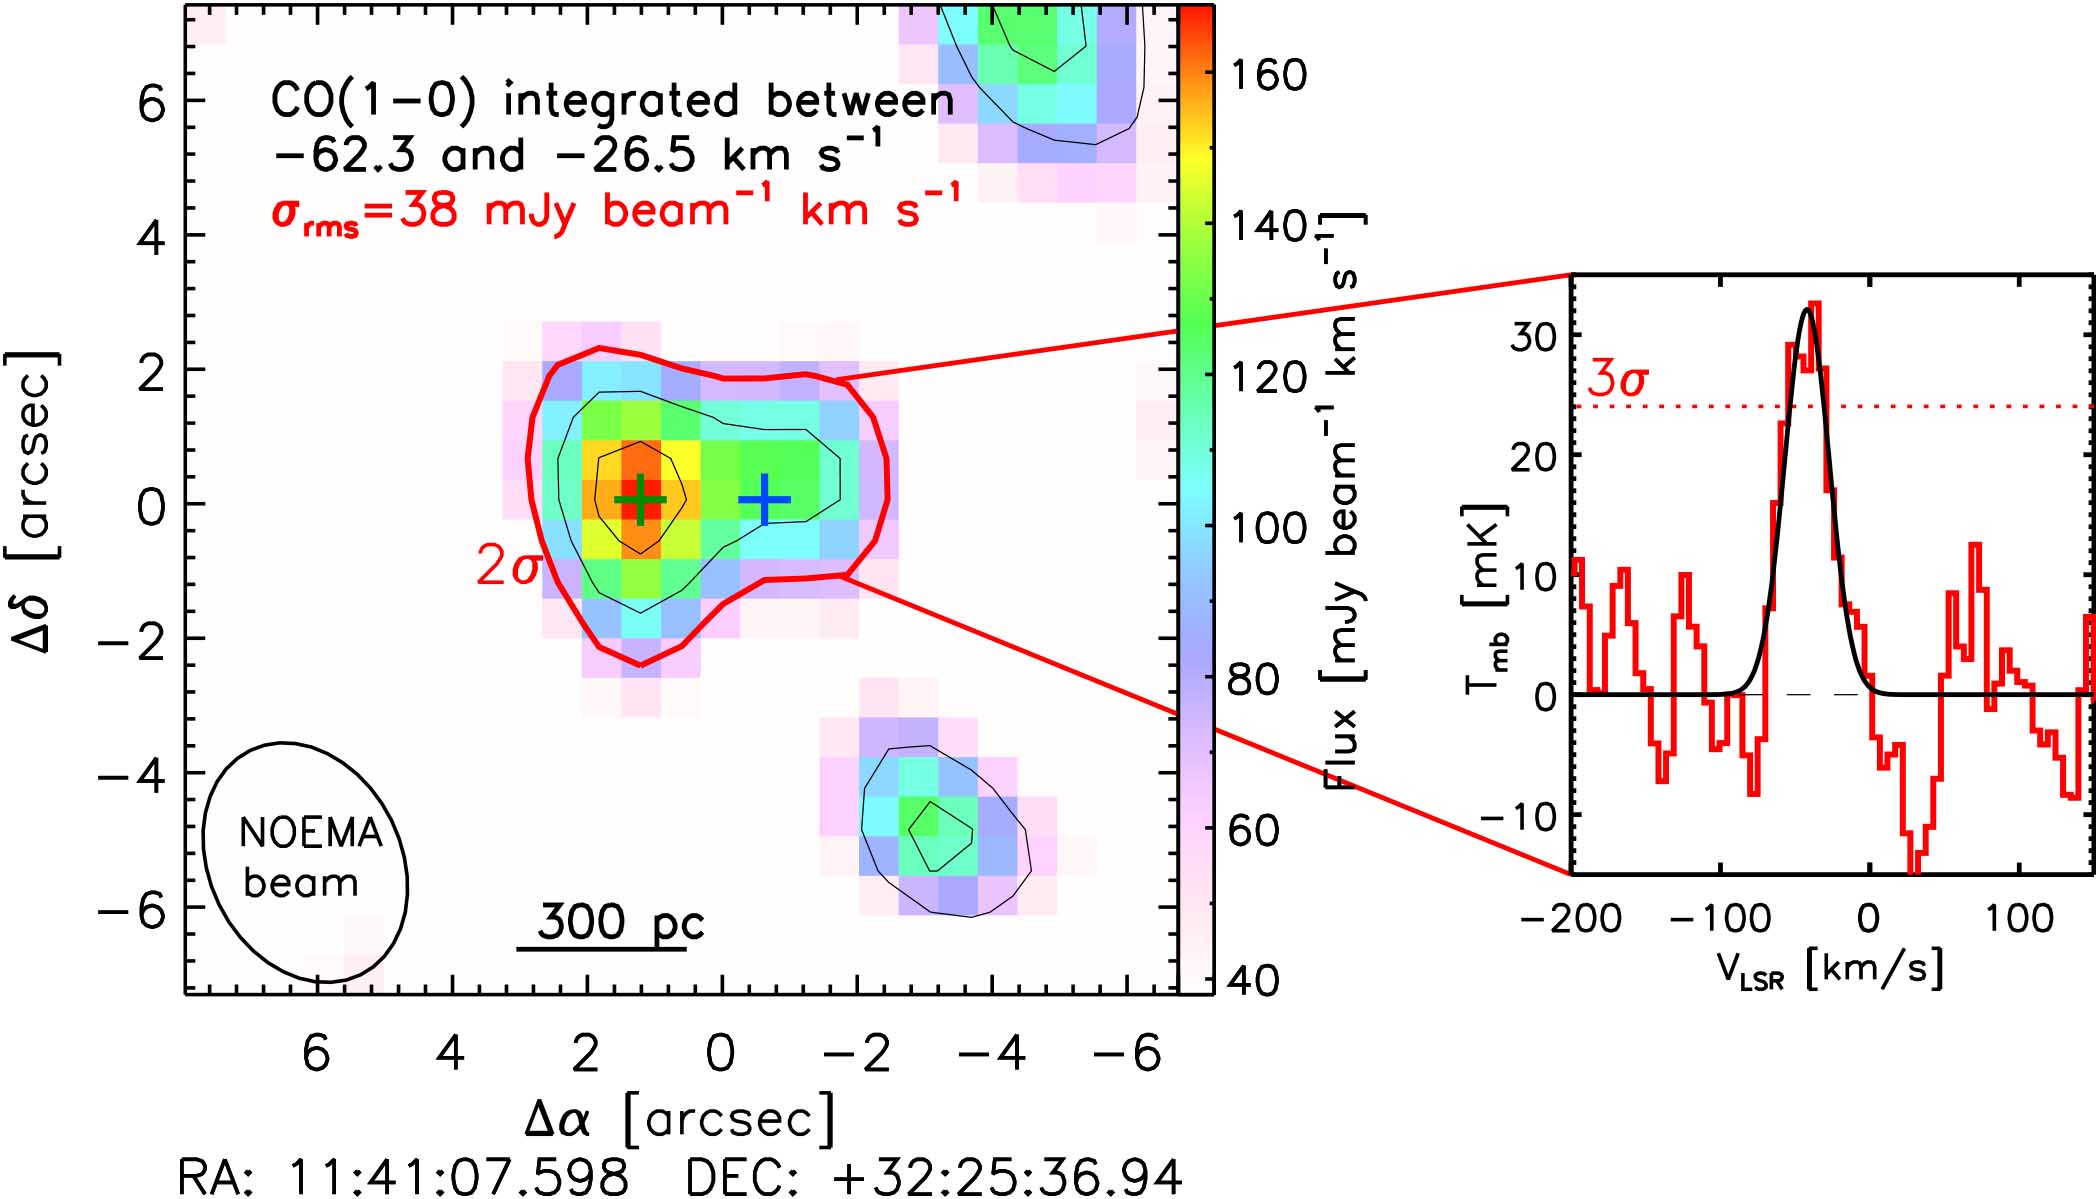
The resulting data cube was integrated between LSR velocities of km s-1 and km s-1 where CO emission was observed. The rms was measured in the integrated image and a mask for pixels with emission greater than was made. The average spectrum of Kiso 5639 was obtained within this mask. A 1D Gaussian fit to this spectrum gives km s-1, FWHM km s-1, peak emission mK, and average integrated line profile, mK km s-1, as summarized in Table 1.
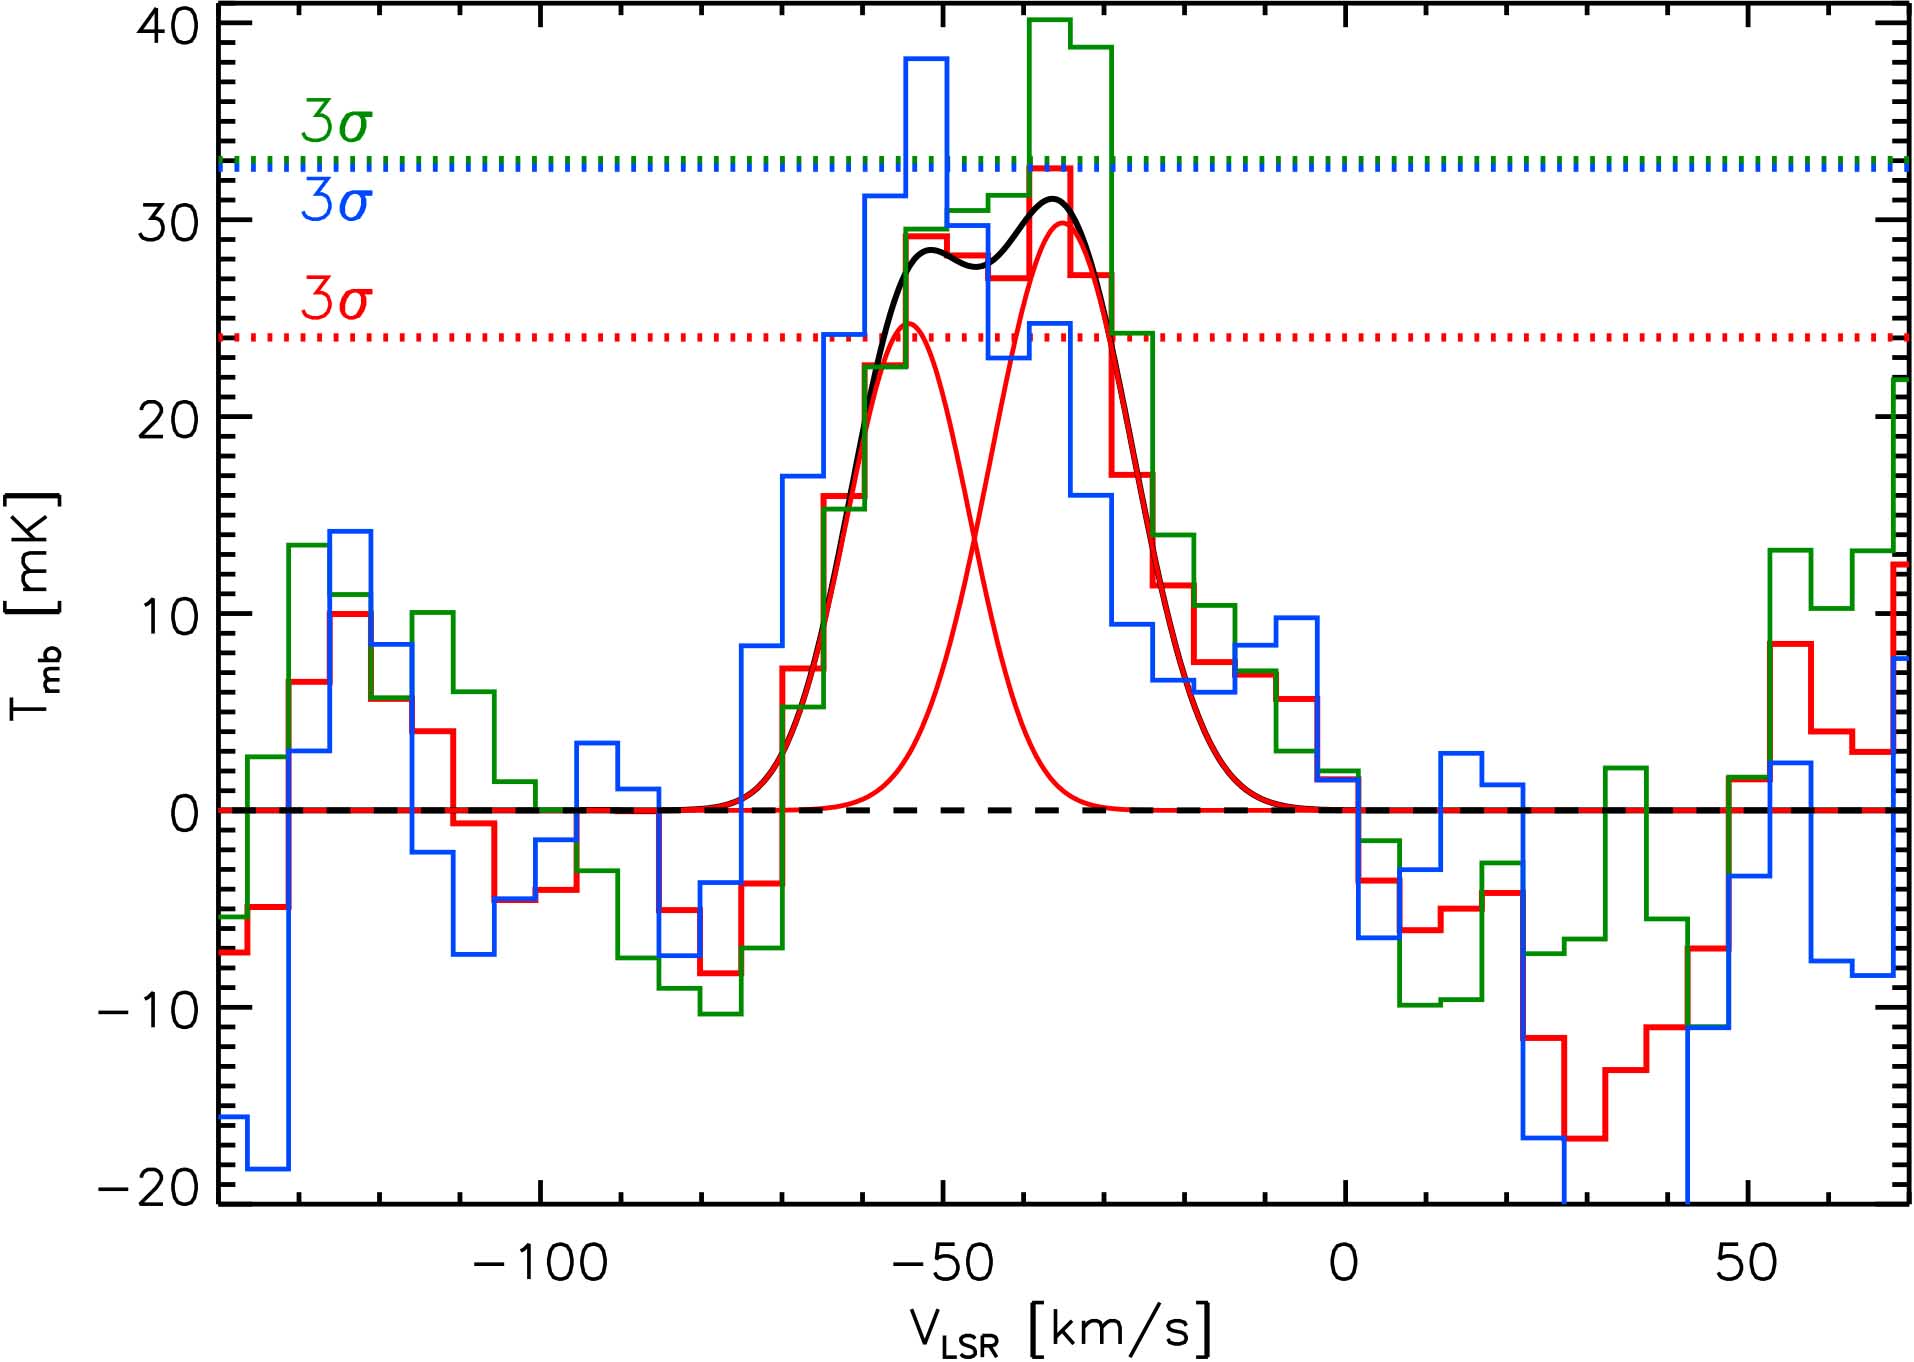
Figure 1 shows a map of the main emission and the integrated spectrum. The velocity resolution is 5.11 km s-1, the half-power beam size is , and the rms is mJy/beam. The equivalent radius of the source is (280 pc), which corresponds to the area of the detection contour, pc2. The emission has two peaks separated by , which is 240 pc. Spectra determined for each peak are shown in Figure 2. The blue histogram is from one of the peaks and the green histogram is from the other; the red double peak histogram is the composite. Each histogram has a Gaussian fit, as indicated by the red lines and the black line. The integrated line fits to these spectra and the derived quantities are in Table 1.
Several other regions inside the primary beam of the NOEMA telescope were also suspected of containing CO emission, but the brightness temperatures were less than 20% of the peak shown in the figure, and we do not consider them to be definitive detections of molecular gas. These include the contoured regions to the southwest and northwest of the main emission in Figure 1.
III. Results
Conversion from the observed CO flux to a molecular mass depends on the conversion factor, . Hunt et al. (2015) suggested an extrapolation of from the solar neighborhood value to low metallicity as , where is the solar metallicity corresponding to (Asplund et al., 2009), and is the metallicity for Kiso 5639 corresponding to . The local conversion factor is including He and heavy elements (Bolatto et al., 2013). Similarly, Amorín et al. (2016) suggested an extrapolation as to the power . In the first case, the result for Kiso 5639 would be in these units, and in the second case it would be . Compared to the WLM galaxy, where (Elmegreen et al., 2013) and , and 112 for the same power law scalings. On the other hand, if we extrapolate between the low- values determined by Shi et al. (2016), we would get and 900 at , respectively, which results in a much larger molecular mass. Here we take as a conservative estimate.
For the observed CO average integrated line profile, K km s-1, estimated , and CO source area, pc2, the H2 mass is the product of these, , with the largest uncertainty in the value of , which is probably a factor of 2. The mass divided by the total emitting area is the molecular surface density, pc-2.
In this same region, the star formation rate is yr-1 and the star formation surface density is pc-2 Myr -1, as given above. These imply that the molecular gas consumption time is Gyr, which is slightly less than in normal spiral galaxy disks (Bigiel et al., 2008; Schruba et al., 2011). This time is about the same as in the SMC, where the metallicity is also low () and is high, (Bolatto et al., 2011).
Following the same method, the masses of the two components of the emission in Figures 1 and 2 can be determined (see Table 1). The component in the east has a velocity of km s-1 and an average integrated line profile of K km s-1, and the component in the west has a velocity of km s1 and an average integrated line profile of K km s-1. We assume each has the same total area. Then the masses are these line integrals multiplied by the areas and the factor, which are in the east and in the west, with surface densities of pc-2 and pc-2, respectively. The velocity difference between the components, km s-1, is nearly half of the rotation velocity of the galaxy, km s-1 (Sánchez Almeida et al., 2013), suggesting a catastrophic event.
The masses, radii, and velocity dispersions can be combined to determine the virial ratio, , where . These ratios require a deconvolved radius, which is for the total cloud (using the source and beam sizes from above). The radii of the components are taken to have upper limits equal to the average beam size of . The results are in Table 1. The virial ratios are in the range to 1.8, which suggests that the whole cloud and the two separate parts are gravitationally self-bound.
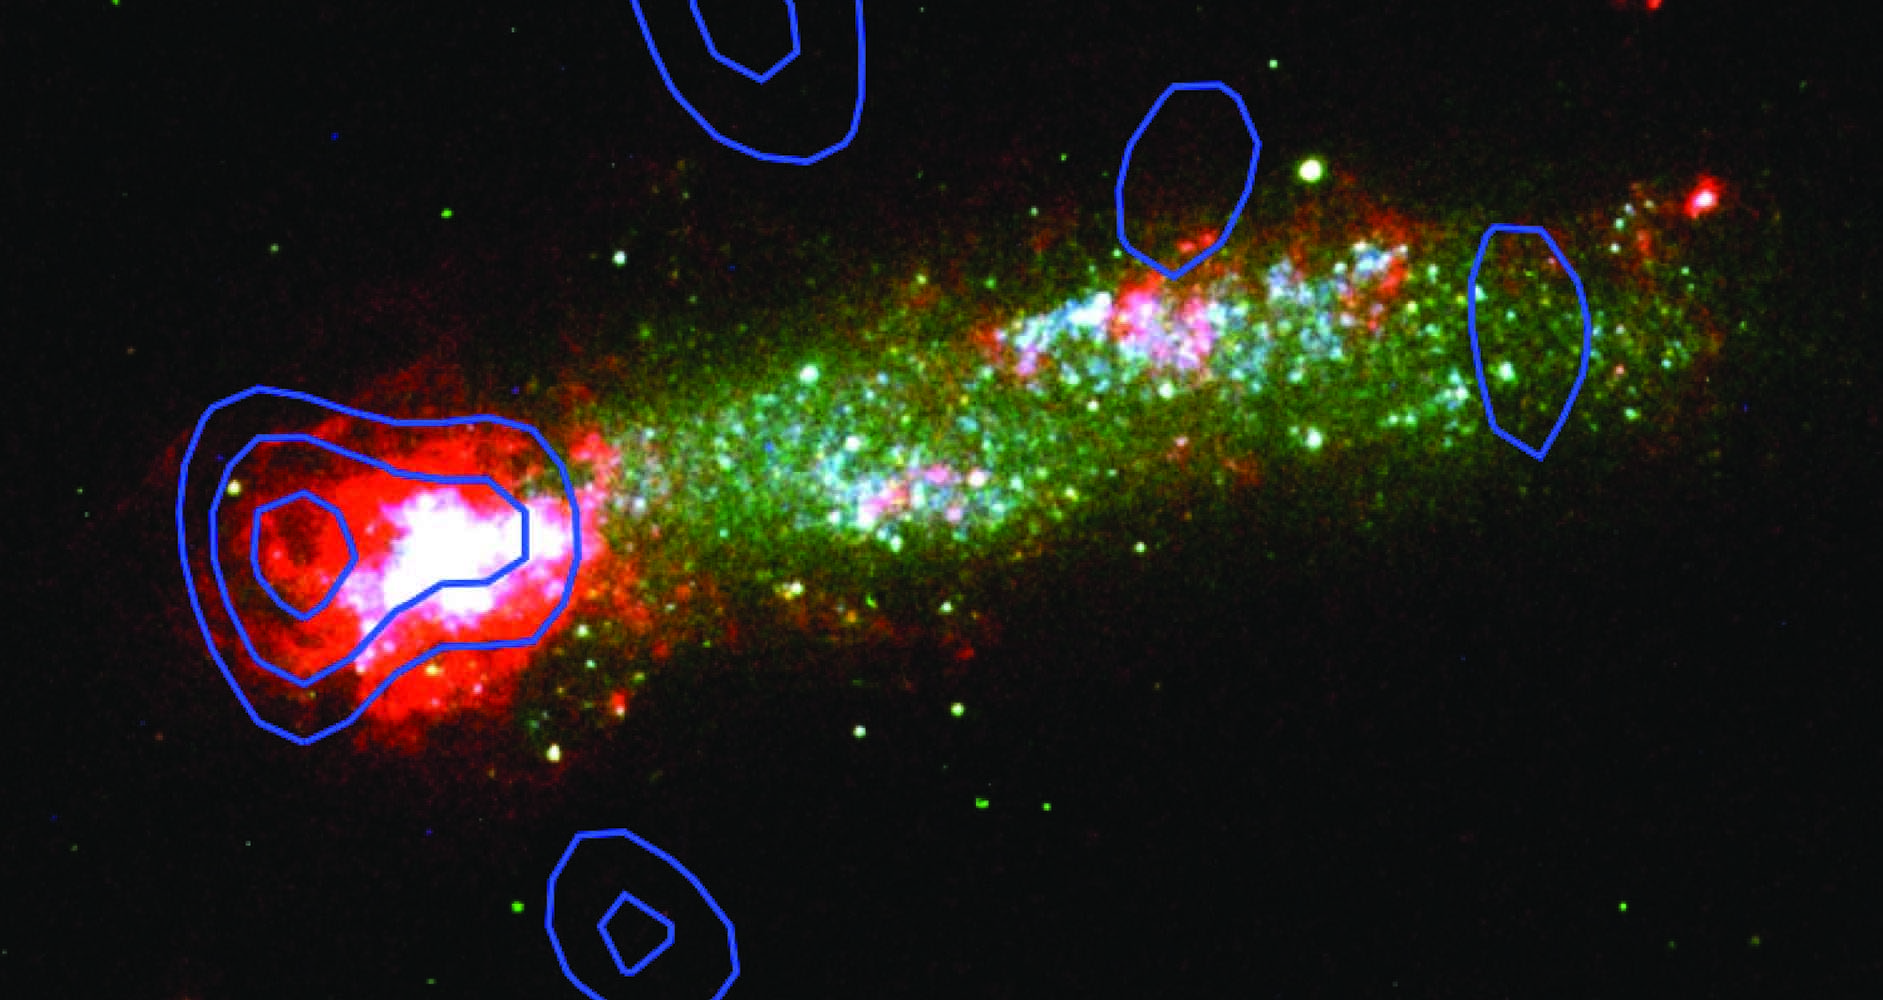
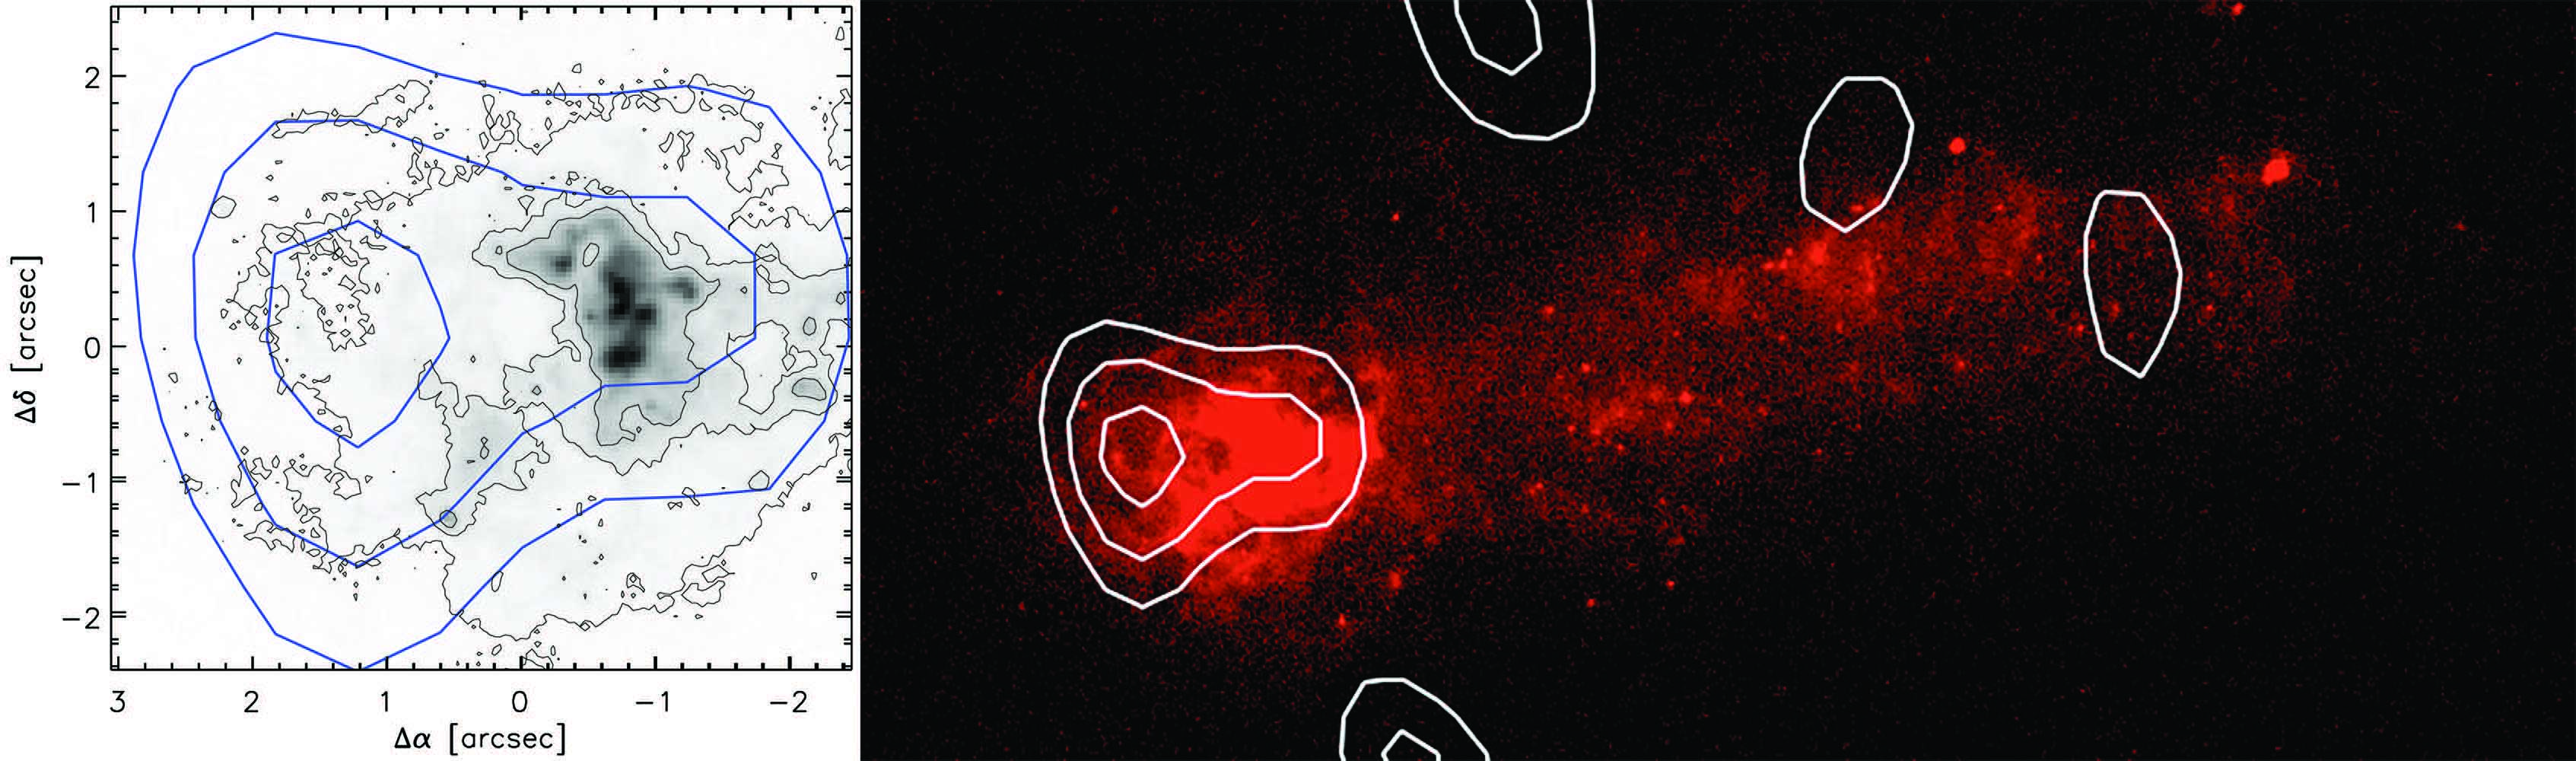
Figure 3 shows the HST image of Kiso 5639 in H, V, and B bands with superimposed CO contours at values of , and . The main molecular cloud is pc to the east of the bright star formation region. This offset means that comparisons to the Kennicutt-Schmidt relation are not exactly appropriate. Still, the molecular gas reservoir for the starburst appears to be of sufficient mass to explain the observed young stars.
Figure 4 shows the same CO contours on the HST H image of the whole galaxy. An expanded view of the head region is on the left, where the black contours are 3%, 10% and 20% of the peak H emission. Offset positions are as in Fig. 1.
IV. Implications
Subject to uncertainties about the conversion factor between CO emission and molecular gas mass, our observations suggest that a molecular cloud with a surface density of pc-2 spanning a region 560 pc in diameter is associated with the starburst head of the tadpole galaxy Kiso 5639, where HST observations previously suggested that the star formation rate is yr-1 and the star formation surface density is pc-2 Myr-1.
The molecular surface density is comparable to that in giant molecular clouds in local galaxies, which average pc-2 (Heyer & Dame, 2015), but the extinction through the molecular cloud in Kiso 5639 should be much less. Considering the local conversion factor between color excess and HI column density (Bohlin et al., 1978), , for a ratio of total to selective extinction , and using a mean molecular weight of 1.36 times the hydrogen mass, the extinction through a cloud is related to its surface density by
| (1) |
For Kiso 5639, , so the observed corresponds to mag. In the solar neighborhood, this is comparable to the threshold for CO formation (Pineda et al., 2008; Glover & Clark, 2012). The same extinction threshold was obtained for the WLM galaxy at a metallicity of , where pc-size CO clouds in the core of a giant HI and H2 envelope had a total shielding column density equivalent to mag visual extinction (Rubio et al. 2015, see also Schruba et al. 2017).
The assumed value of implies that the ratio of invisible molecular hydrogen to observed CO is high, times higher than in the solar neighborhood. A similar situation arises for the low-metallicity galaxy WLM, where the CO clouds resolved by ALMA are pc-scale inside resolved HI and dust clouds that are pc in size. If the peak CO antenna temperature of mK in Kiso 5639 corresponds to a beam-diluted thermal temperature of K, which is not unreasonable for a molecular region of intense star formation (e.g., Glover & Clark, 2012), then the beam-dilution factor of the total CO is , and their individual radii would be of the overall cloud radius, or pc for cores.
Such small CO cores would presumably have a collective motion that is observed as the CO emission Gaussian linewidth of km s-1. Considering again a typical dense cloud temperature of 30 K, these motions would have a Mach number of and a compression ratio in the shocked regions of approximately the square of this, . The average compressed density is then the compression ratio times the average density. The average density is the surface density divided by the cloud thickness. For a self-gravitating slab, the thickness is , which is 140 pc in our case. Then the average density is cm-3. If this average density is compressed by shocks, then the density in the compressed regions, where the CO might actually be located, is cm-3. For a temperature of K, the thermal pressure would be . This derivation of pressure is the same as what we would get from the equation for self-gravitational binding pressure, , using pc-2. Any additional contribution to the surface density from atomic gas in an envelope around the molecular cloud would increase the pressure.
The derived pressure inside the Kiso 5639 molecular cloud is comparable to the pressures in local giant molecular clouds, corresponding to similar surface densities. Pressure has been proposed to control the fraction of mass in the form of bound clusters in the star formation process (Kruijssen, 2012). Kiso 5639 has a relatively high clustering fraction, 30%-45% (Elmegreen et al., 2016) compared to other dwarf galaxies (Billett et al., 2002), perhaps because of its relatively high pressure. Its clustering fraction is about the same as in spirals (Adamo et al., 2015) where the pressure is the same.
High pressure might also be necessary to form more massive clusters (Elmegreen & Elmegreen, 2001). The present observation of molecular clouds close to the extinction threshold for molecule formation (and in Rubio et al., 2015; Schruba et al., 2017) suggest that the surface densities (and therefore pressures) of star-forming clouds will be higher at lower metallicity. That is, low metallicity and the corresponding low dust opacity per column of gas could diminish the ability of self-gravitating clouds to shield themselves against background starlight. This would delay the formation of molecules and cold thermal temperatures until the cloud surface density is high. Then the pressure, which depends only on the surface density, would become high too. The result would be a greater likelihood of gravitationally bound massive clusters in low metallicity galaxies. Massive concentrations of molecular gas as in Kiso 5639 would be needed too.
We thank R. García-Benito for deriving the abundance of Oxygen from the SDSS spectrum. We are grateful to the referee for comments. M.R. wishes to acknowledge support from CONICYT(CHILE) through FONDECYT grant No1140839 and partial support from project BASAL PFB-06. M.R. is a member of UMI-FCA, CNRS/INSU, France (UMI 3386). AOG thanks Fundación La Caixa for financial support in the form of a PhD contract, and SA and CMT acknowledge MINECO for funding through the project AYA2016-79724-C4-2-P. This work is based on observations carried out under project number S17AP with the IRAM NOEMA Interferometer. IRAM is supported by INSU/CNRS (France), MPG (Germany) and IGN (Spain). Based on observations made with GTC, in the Spanish Observatorio del Roque de los Muchachos of the IAC, under DDT.
References
- Adamo et al. (2015) Adamo, A., Kruijssen, J. M. D., Bastian, N., Silva-Villa, E., & Ryon, J. 2015, MNRAS, 452, 246
- Amorín et al. (2016) Amorín, R., Muñoz-Tuñón, C., Aguerri, J. A. L., & Planesas, P. 2016, A&A, 588, 23
- Asplund et al. (2009) Asplund, M., Grevesse, N., Sauval, A.J., & Scott, P. 2009, ARA&A, 47, 481
- Bigiel et al. (2008) Bigiel, F., Leroy, A., Walter, F., Brinks, E., de Blok, W. J. G., Madore, B., & Thornley, M. D. 2008, AJ, 136, 2846
- Billett et al. (2002) Billett, O.H., Hunter, D.A., Elmegreen, B.G. 2002, AJ, 123, 1454
- Bohlin et al. (1978) Bohlin, R. C., Savage, B. D., Drake, J. F. 1978, ApJ, 224, 132
- Bolatto et al. (2011) Bolatto, A.D., Leroy, A.K., Jameson, K., et al. 2011, ApJ, 741, 12
- Bolatto et al. (2013) Bolatto, A.D., Wolfire, M., Leroy, A.K. 2013, ARA&A, 51, 207
- Ceverino et al. (2016) Ceverino, D., Jorge Sánchez Almeida, J., Muñoz-Tuñón, C., Dekel, A., Elmegreen, B.G., Elmegreen, D.M., & Primack, J. 2016, MNRAS, 457, 2605
- Elmegreen & Elmegreen (2001) Elmegreen, B.G. & Elmegreen, D.M. 2001, AJ, 121, 1507
- Elmegreen et al. (2013) Elmegreen, B.G., Rubio, M., Hunter, D.A., Verdugo, C., Brinks, E. & Schruba, A. 2013, Nature, 495, 487
- Elmegreen & Hunter (2015) Elmegreen, B.G., & Hunter, D.A. 2015, ApJ, 805, 145
- Elmegreen et al. (2012) Elmegreen, D.M., Elmegreen, B.G., Sańchez Almeida, J., Muñoz-Tuñón, C., Putko, J., & Dewberry, J. 2012, ApJ, 750, 95
- Elmegreen et al. (2016) Elmegreen, D.M., Elmegreen, B.G., Sánchez Almeida, J., Muñoz-Tuñón, C., Mendez-Abreu, J., Gallagher, J.S., Rafelski, M., Filho, M., Ceverino, D., 2016, ApJ, 825, 145
- Glover & Clark (2012) Glover, S.C.O. & Clark, P.C. 2012, MNRAS, 421, 9
- Haurberg et al. (2013) Haurberg, N.C., Rosenberg, J. & Salzer, J.J. 2013, ApJ, 765, 66
- Heyer & Dame (2015) Heyer, M., & Dame, T.M. 2015, ARA&A, 53, 583
- Hunt et al. (2015) Hunt, L. K., Garc a-Burillo, S., Casasola, V., et al. 2015, A&A, 583, A114
- Hunter et al. (2010) Hunter, D.A., Elmegreen, B.G., & Ludka, B.C. AJ, 139, 447
- Kennicutt & Evans (2012) Kennicutt, R.C., & Evans, N.J. 1 2012, ARA&A, 50, 531
- Kruijssen (2012) Kruijssen, J. M. D. 2012, MNRAS, 426, 3008
- Lagos et al. (2018) Lagos, P., Scott, T. C., Nigoche-Netro, A., Demarco, R., Humphrey, A., & Papaderos, P. 2018, MNRAS, tmp, 603
- Leroy et al. (2011) Leroy, A.K. et al. 2011, ApJ, 737, 12
- Levesque et al. (2011) Levesque, E.M., Berger, E., Soderberg, A.M., Chornock, R. 2011, ApJ, 739, 23
- Miyauchi-Isobe, Maehara, & Nakajima (2010) Miyauchi-Isobe, N., Maehara, H., & Nakajima, K. 2010, Pub.Nat.Astro.Ob.Japan, 13, 9
- Morales-Luis et al. (2014) Morales-Luis, A. B., Pérez-Montero, E., Sánchez Almeida, J., Muñoz-Tuñón, C. 2014, ApJ, 797, 81
- Pérez-Montero (2014) Pérez-Montero, E. 2014, MNRAS, 441, 2663
- Pineda et al. (2008) Pineda, J. E., Caselli, P., & Goodman, A. A. 2008, ApJ, 679, 481
- Rubio et al. (2015) Rubio, M., Elmegreen, B.G., Hunter, D.A., Brinks, E., Cortés, J.R., & Cigan, P. 2015, Nature, 525, 218
- Salzer et al. (2002) Salzer, J., Rosenberg, J., Weisstein, E., Mazzarella, J., & Bothun, G. 2002, AJ, 124, 191
- Sánchez Almeida et al. (2013) Sánchez Almeida, J., Muñoz-Tuñón, C. Elmegreen, D., Elmegreen, B., & Mendez-Abreu, J. 2013, ApJ, 767, 74
- Sánchez Almeida et al. (2014) Sánchez Almeida, J. Morales-Luis, A.B., Muñoz-Tuñón, C., Elmegreen, D.M., Elmegreen B.G., & Mendez-Abreu, J. 2014a, ApJ, 783, 45
- Sánchez Almeida et al. (2015) Sánchez Almeida, J. Elmegreen, B.G., Munoz-Tunon, C., Elmegreen D.M., Perez-Montero, E., Amorin, R., Filho, M.E., Ascasibar, Y., Papaderos, P., & Vilchez, J.M. 2015, ApJL, 810L, 15
- Sánchez Almeida et al. (2016) Sánchez Almeida, J., Pérez-Montero, E., Morales-Luis, A. B., et al. 2016, ApJ, 819, 110
- Schruba et al. (2017) Schruba, A. Leroy, A. K., Kruijssen, J. M. D., Bigiel, F., Bolatto, A.D., de Blok, W. J. G., Tacconi, L., van Dishoeck, E.F., & Walter, F. 2017, ApJ, 835, 278
- Schruba et al. (2011) Schruba, A., Leroy, A. K., Walter, F., et al. 2011, AJ, 142, 37
- Shi et al. (2015) Shi, Y., Wang, J., Zhang, Z.-Y., Gao, Y., Armus, L., Helou, G., Gu, Q., Stierwalt, S. 2015, ApJ, 804, L11
- Shi et al. (2016) Shi, Y., Wang, J., Zhang, Z.-Y., Gao, Y., Hao, C.-N., Xia, X.-Y., Gu, Q. 2016, Nature Comm, 7, 13789
- Verbeke et al. (2014) Verbeke, R., De Rijcke, S., Koleva, M., et al. 2014, MNRAS, 442, 1830
- Vincenzo et al. (2016) Vincenzo, F., Belfiore, F., Maiolino, R., Matteucci, F., & Ventura, P. 2016, MNRAS, 458, 3466
| Cloud | FWHM | Ave. Line Int. | Radius | Mass | Surface Density | Virial Ratio | ||
|---|---|---|---|---|---|---|---|---|
| km s-1 | mK | km s-1 | K km s-1 | arcsec | ||||
| Total | 1.8 | |||||||
| East | ||||||||
| West |