Anisotropic magnetocaloric effect in single crystals of CrI3
Abstract
We report a systematic investigation of dc magnetization and ac susceptibility, as well as anisotropic magnetocaloric effect in bulk CrI3 single crystals. A second-stage magnetic transition was observed just below the Curie temperature , indicating a two-step magnetic ordering. The low temperature thermal demagnetization could be well fitted by the spin-wave model rather than the single-particle model, confirming its localized magnetism. The maximum magnetic entropy change J kg-1 K-1 and the corresponding adiabatic temperature change K are achieved from heat capacity analysis with the magnetic field up to 9 T. Anisotropy of was further investigated by isothermal magnetization, showing that the difference of between the plane and the axis reaches a maximum value 1.56 J kg-1 K-1 with the field change of 5 T. With the scaling analysis of , the rescaled curves collapse onto a universal curve, indicating a second-order type of the magnetic transition. Furthermore, the follows the power law of with , and the relative cooling power RCP depends on with .
I INTRODUCTION
Layered intrinsically ferromagnetic (FM) semiconductors hold great promise for both fundamental physics and future applications in nano-spintronics.McGuire0 ; McGuire ; Huang ; Gong ; Seyler For instance, Cr2X2Te6 (X = Si, Ge) and CrX3 (X = Cl, Br, I) have recently attracted wide attention as promising candidates for long-range magnetism in monolayer.Gong ; Lin ; Zhuang
Bulk Cr2X2Te6 (X = Si, Ge) shows FM order with the Curie temperature () of 32 K for Cr2Si2Te6 and 61 K for Cr2Ge2Te6, respectively.Ouvrard ; Carteaux1 ; Carteaux2 ; Casto ; Zhang Scanning magneto-optic Kerr microscopy experiment shows that the monotonically decreases with decreasing thickness of Cr2Ge2Te6, from bulk of 68 K to bilayer of 30 K.Gong Similarly, bulk CrI3 shows FM with of 61 K, and the magnetism can persist in mechanically exfoliated monolayer with of 45 K.Huang The magnetism in CrI3 is intriguingly layer-dependent, from FM in the monolayer, to antiferromagnetic (AFM) in the bilayer, and back to FM in the trilayer,Huang providing great opportunities for designing magneto-optoelectronic devices. A rich phase diagram, including in-plane AFM, off-plane FM, and in-plane FM, is further predicted by applying lateral strain and/or charge doping.Zheng Besides, the magneto-transport measurement on the thin exfoliated CrI3 reveals a tunneling magnetoresistance as large as 10,000, exhibiting multiple transitions to the different magnetic states.Wang ; SongTC The magnetism in monolayer and/or bilayer CrI3 can also be controlled by electrostatic doping using a dual-gate field-effect device.Jiang ; Huang1
Since the layered van der Waals magnetic materials may exibit magnetocrystalline anisotropy, in this paper, we study magnetocaloric effect by heat capacity and magnetization measurements around .ZhangWB ; VerchenkoVY Isothermal magnetic entropy change can be well scaled into a universal curve independent on temperature and field, indicating the magnetic transition is of a second-order type. Moreover, the follows the power law of with . The temperature dependence of values reaches minimum at K, at of bulk CrI3.
II EXPERIMENTAL DETAILS
Single crystals of CrI3 were grown by chemical vapor transport (CVT) method and characterized as described previously.LIUYU The heat capacity was measured in Quantum Design PPMS-9 system with field up to 9 T. Several crystals with mass of 5.6 mg were used in heat capacity measurement. The magnetization data as a function of temperature and field were collected using Quantum Design MPMS-XL5 system in temperature range from 10 to 100 K with a temperature step of 2 K around and field up to 5 T. One crystal with mass of 1.67 mg was covered with scotch tape on both sides and used in magnetization measurement. The magnetic entropy change from the magnetization data was estimated using a Maxwell relation.
III RESULTS AND DISCUSSIONS

Figures 1(a) and 1(b) exhibit the temperature dependences of zero-field cooling (ZFC) and field-cooling (FC) magnetizations for bulk CrI3 single crystal measured in the fields ranging from 0.05 to 5 T applied in the plane and along the axis, respectively. An apparent increase in around is observed, which corresponds well to the reported paramagnetic (PM) to FM transition.McGuire The is roughly defined by the minima of the curves [insets in Figs. 1(a) and 1(b)], which is about 61 K in low fields and increases to 74 K in 5 T. The magnetization is nearly isotropic in 5 T, while in low fields, significant magnetic anisotropy is observed at low temperatures. An additional weak kink was observed below with field in the plane. Below , the magnetization measured along the axis saturates at a relatively low field, indicating that the moments are aligned in this direction. As shown in Figs. 1(c) and 1(d), the splitting of ZFC and FC curves is observed at low field of = 100 Oe, which originates from the anisotropic FM domain effect. The anomaly below the PM-FM transition is clearly observed. In order to determine the accurate transition temperatures, ac susceptibility was measured at oscillated ac field of 3.8 Oe and frequency of 499 Hz. Two distinct peaks in the real part in the plane [Fig. 1(e)], the PM-FM transition at 61 K and an additional peak at 48 K, as well as the weak anomalies at corresponding temperatures along the axis [inset in Fig. 1(f)], confirm it is a two-step magnetic ordering. This is in agreement with data in Ref. 2 where additional anomaly was observed below bulk FM transition at 61 K.
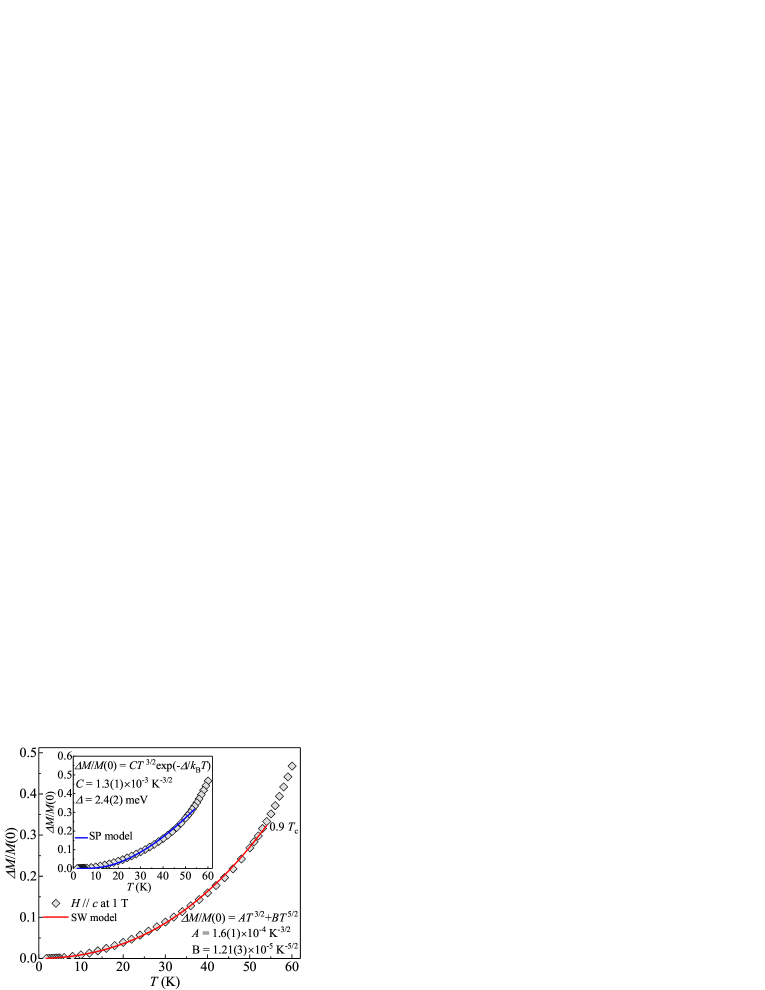
Figure 2 displays the low temperature thermal demagnetization analysis for CrI3 measured at = 1 T along the axis using both spin-wave (SW) and single-particle (SP, inset) models. For a localized moment, the thermal demagnetization at low temperature is generally explained with the spin-wave excitations which follows Bloch equation:Das ; Kaul1 ; Kaul2
| (1) |
where and are the coefficients, is the magnetization at 0 K. The term arises due to harmonic contribution and the term originates from higher order term in spin-wave dispersion relation. While in itinerant or band magnetism where the net moment of system is directly proportional to the displacement energy between spin-up and spin-down subbands, the thermal demagnetization is realized as a result of excitation of electrons from one subband to the other. The single-particle excitation is generally expressed as,Das
| (2) |
where is the coefficient, is the energy gap between the top of full subband and the Fermi level and is the Boltzmann constant. Usually the can be estimated from extrapolation of data. As shown in Fig. 2, the SW model gives a better fitting result than the SP model up to 0.9 , suggesting localized magnetism of insulating CrI3. The fitting yields K-3/2, K-5/2, K-3/2 and meV. It is not surprising that the SP model fails due to intermediate correlation in CrI3. Therefore, a more accurate treatment would be Moriya’s self-consistent renormalization theory.Moriya It further gives that the magnetic anisotropy in CrI3 comes predominantly from the anisotropic symmetric superexchange via Cr-I-Cr with large spin-orbital coupling rather than the single ion anisotropy.Lado
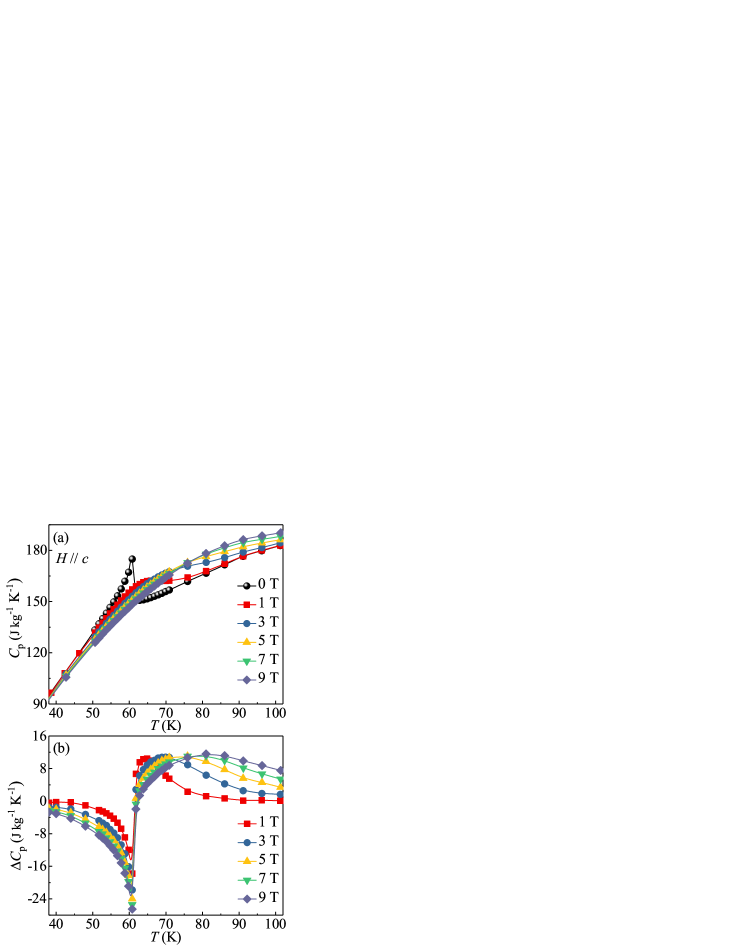
Temperature dependence of heat capacity for CrI3 measured in various fields along the axis is presented in Fig. 3(a). A clear -type peak that corresponds to the PM-FM transition is determined to be at = 61 K in zero field, in line with the magnetization data [Figs. 1(e) and 1(f)]. Its height is lowered, broadened and shifts to higher temperatures with increase in magnetic field. The estimated heat capacity change as a function of temperature in various fields is plotted in Fig. 3(b). Obviously, for and for , whilst, it changes sharply from negative to positive at , corresponding to the change from FM to PM region. The entropy can be calculated as:
| (3) |
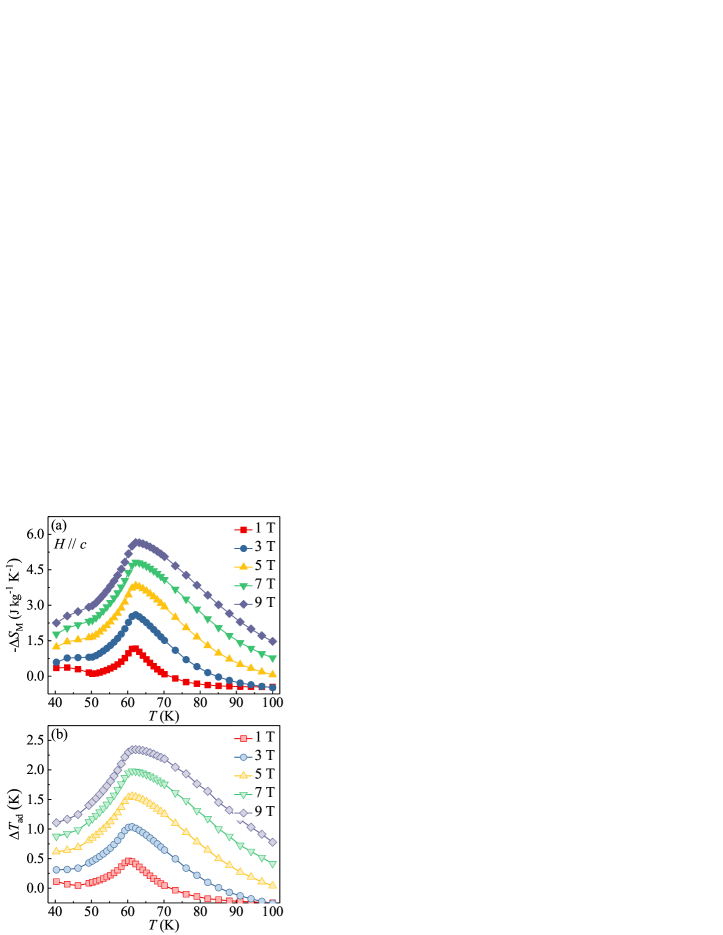
Assuming the electronic and lattice contributions are not field dependent and in an adiabatic process of changing the field, the magnetic entropy change should be . The adiabatic temperature change caused by the field change can be indirectly determined, , where and are the temperatures in the field and , respectively, at constant total entropy . Figures 4(a) and 4(b) exhibit the and estimated from heat capacity data as a function of temperature in various fields, both of which exhibit its maximum near the Curie temperature and increase with increasing fields. The maxima of and reach the values of 5.65 J kg-1 K-1 and 2.34 K, respectively, with the magnetic field of 9 T. Since there is a large magnetic anisotropy in CrI3, it is of interest to calculate the individual magnetic entropy change for the two directions respectively.
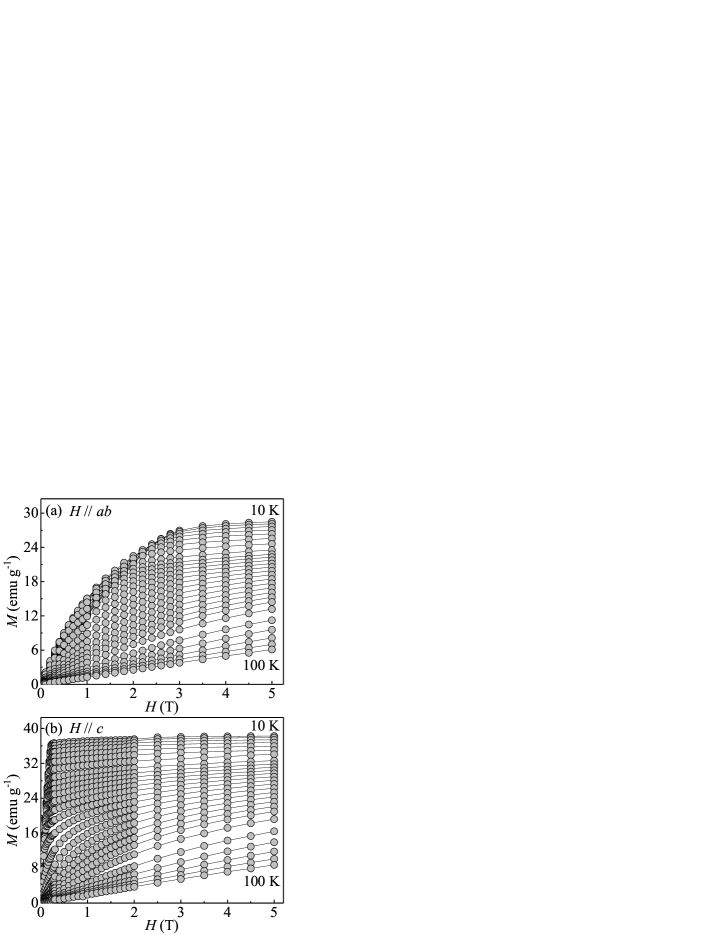
Figures 5(a) and 5(b) show the isothermal magnetizations with field up to 5 T applied in the plane and along the axis, respectively, from 10 to 100 K where data were taken every 2 K around . Below , the magnetization along the axis saturates at a relatively low field, however, it increases slowly at low fields in the plane and is more harder to saturate, confirming its large magnetic anisotropy and the easy axis. The magnetic entropy change can be obtained as:Pecharsky
| (4) |
With the Maxwell’s relation = , it can be further written as:Amaral
| (5) |
In the case of magnetization measured at small discrete magnetic field and temperature intervals, could be practically approximated as:
| (6) |
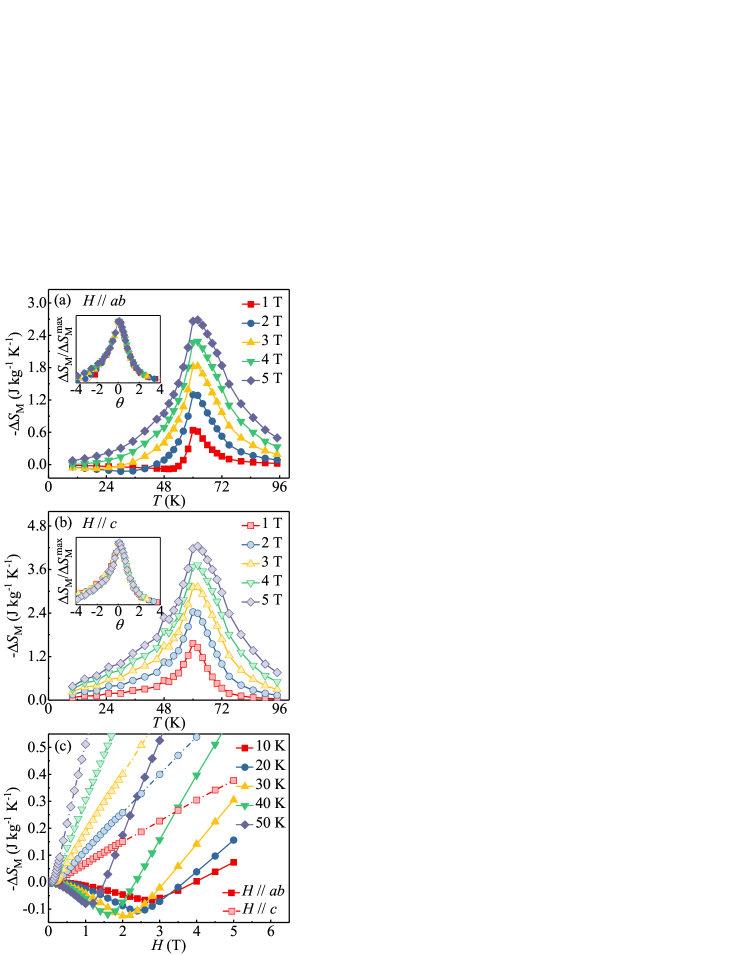
Figures 6(a) and 6(b) gives the calculated as a function of temperature in various fields up to 5 T applied in the plane and along the axis, respectively. All the curves present a pronounced peak around , similar to those obtained from heat capacity data [Fig. 4(a)], and the peak broads asymmetrically on both sides with increasing field. The maximum value of under 5 T reaches 2.68 J kg-1 K-1 in the plane, which is 37 smaller than that of 4.24 J kg-1 K-1 along the axis. It is interesting to note that the values of for the plane are negative at low temperatures in low fields, however, all the values are positive along the axis, indicating large anisotropy. Fig. 6(c) exhibits the field dependence of at low temperatures, in which the sign change is clearly observed with the field in the plane but not along the axis. This originates most likely from the competition of the temperature dependence of magnetic anisotropy and the magnetization. The anisotropy decreases with increasing temperature, whereas the magnetization may exhibit opposite behavior. At low fields, the magnetization at higher temperature could be larger than that at lower temperature [Figs. 1(a,c) and Fig. 5(a)], which gives a negative . To shed more light on the nature of magnetic transition, we have further analyzed the magnetocaloric data following a recently proposed scaling model.Franco It is constructed by normalizing all the curves against the respective maximum , namely, by rescaling the temperature below and above as defined in the following equations:
| (7) |
| (8) |
where and are the temperatures of the two reference points that have been selected as those corresponding to . As shown in the insets of Figs. 6(a) and 6(b), all the curves in various fields collapse into a single curve, indicating a second-order magnetic transition for CrI3.
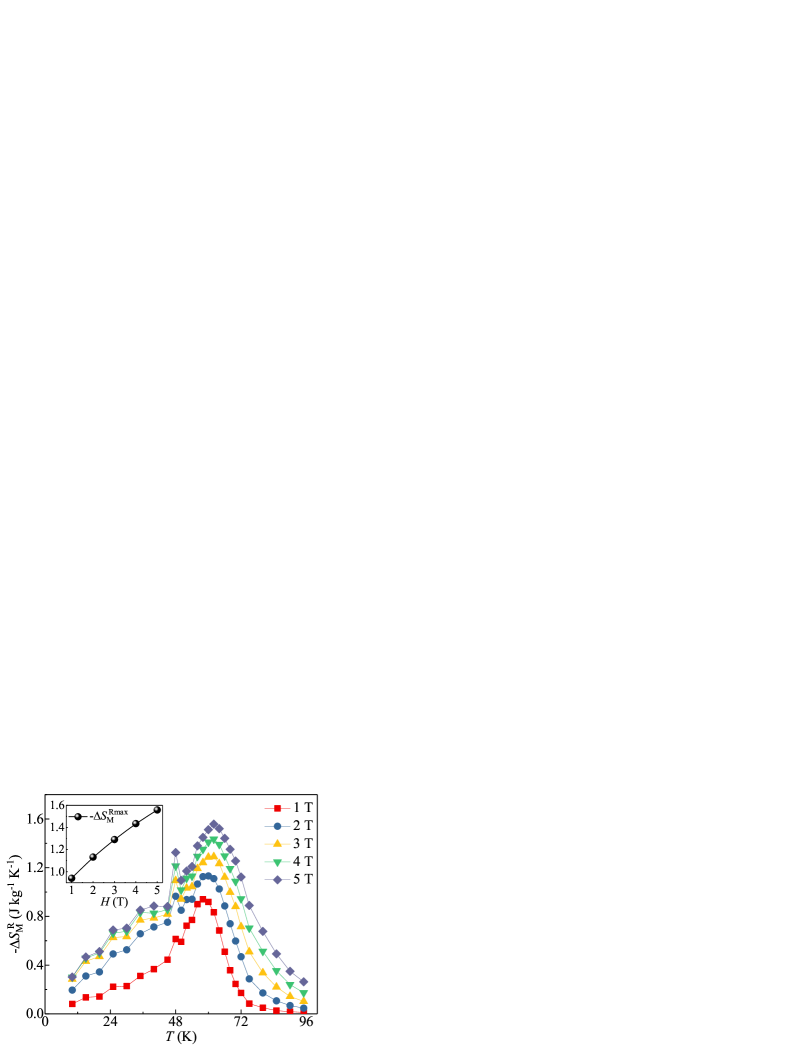
The rotating magnetic entropy change induced by rotating the applied magnetic field from the plane into the axis direction can be represented as:
| (9) | ||||
It illustrates that is equal to the difference value of the magnetic entropy change for and for , as depicted in Fig. 7. The maximum and the width of the main peak increase with increasing field. The field dependence of is presented in the inset of Fig. 7, changing from 0.94 J kg-1 K-1 for 1 T to 1.56 J kg-1 K-1 for 5 T. In addition, the temperature corresponding to shows weak field dependence, however, an additional anomaly just below that was also observed in line with the second-stage magnetic ordering at a fixed temperature of 48 K.
| Material | Theoretical model | Reference | Technique | |||||
|---|---|---|---|---|---|---|---|---|
| CrI3 | This work | 0.64(1) | ||||||
| This work | 1.12(1) | |||||||
| LIUYU | Modified Arrott plot | 0.284(3) | 1.146(11) | 5.04(1) | 0.500(2) | 1.198(1) | ||
| LIUYU | Kouvel-Fisher plot | 0.260(4) | 1.136(6) | 5.37(4) | 0.470(1) | 1.186(1) | ||
| LIUYU | Critical isotherm | 5.32(2) | 1.188(1) | |||||
| Mean field | Stanley | Theory | 0.5 | 1.0 | 3.0 | 0.667 | 1.333 | |
| 3D Heisenberg | Kaul | Theory | 0.365 | 1.386 | 4.8 | 0.637 | 1.208 | |
| 3D XY | Kaul | Theory | 0.345 | 1.316 | 4.81 | 0.606 | 1.208 | |
| 3D Ising | Kaul | Theory | 0.325 | 1.24 | 4.82 | 0.569 | 1.207 | |
| Tricritical mean field | LeGuillou | Theory | 0.25 | 1.0 | 5.0 | 0.4 | 1.20 |
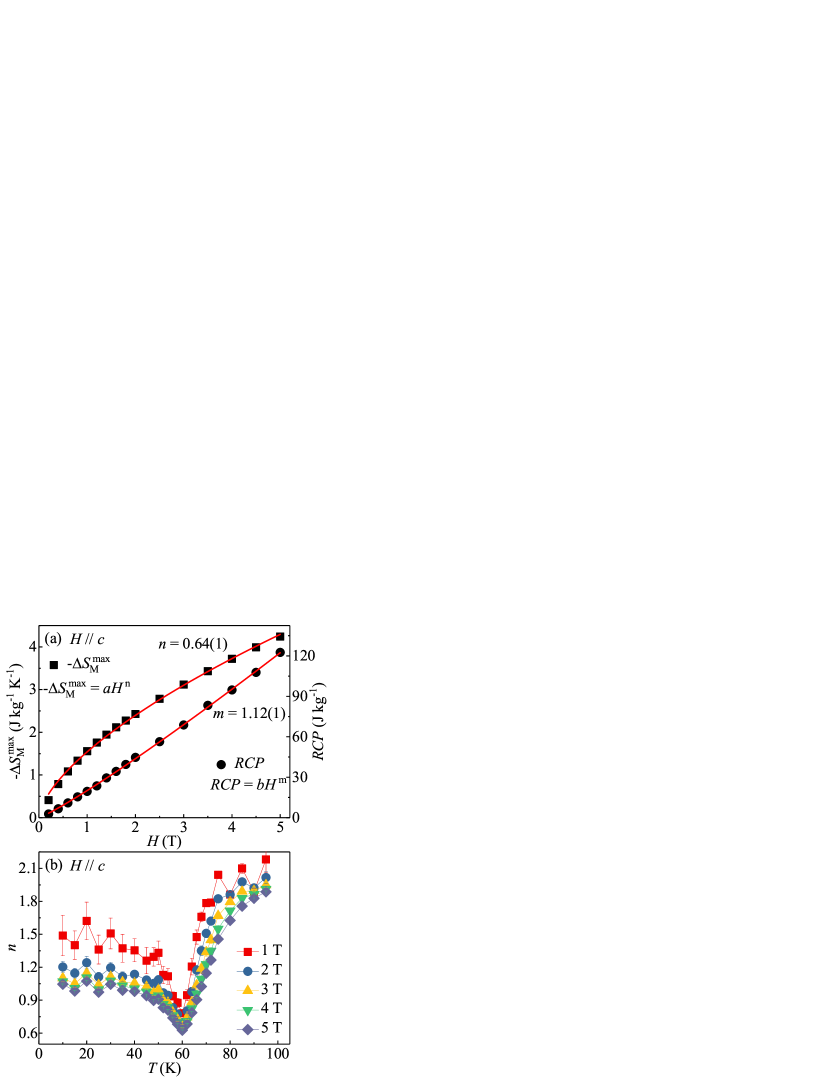
For a material displaying a second-order transition,Oes the field dependence of the maximum magnetic entropy change shows a power law ,VFranco where is a constant and the exponent is related to the magnetic order and depends on temperature and field as follows:Francos
| (10) |
For a FM system above , the direct integration of the Curie-Weiss law indicates that . Based on a mean field approach, it becomes field independent at and corresponds to .Oes However, recent experimental results exhibit deviation from in the case of some soft magnetic amorphous alloys.VFranco In addition, there is a relationship between the exponent at and the critical exponents of the materials as follows:
| (11) |
where , , and are related with the spontaneous magnetization below , the inverse initial susceptibility above , and the isotherm at , respectively. In the case of magnetic refrigerators there is another important parameter that evaluates its cooling efficiency of the refrigerant is the relative cooling power (RCP):Gschneidner
| (12) |
where is the maximum entropy change near and is the full-width at half maxima. The RCP corresponds to the amount of heat that can be transferred between the cold and hot parts of the refrigerator in an ideal thermodynamic cycle.Tishin Actually, the RCP also depends on the magnetic field with the rule , where is related to the critical exponent as follows
| (13) |
Figure 8(a) summarized the field dependence of and RCP with . The value of RCP is calculated as 122.6 J kg-1 for the magnetic field change of 5 T for CrI3, which is about one half of those in manganites and one order of magnitude lower than in ferrites.Phan ; Maalam Fitting of the gives that [Fig. 8(a)], which deviates the value of = 0.667 in the mean-field theory and is close to that of in the three-dimensional (3D) Heisenberg model, in line with its localized magnetism nature. Fitting of the RCP generates that [Fig. 8(a)], which is close to the values estimated from the critical exponent . The obtained critical exponents of CrI3 as well as the values of different theoretical models are summarized in Table I.LIUYU ; Stanley ; Kaul ; LeGuillou Figure 8(b) displays the temperature dependence of in various fields, giving a precise value of = 60 K. It could be found that with field change of 5 T the value of is 1.05 and 1.89 far below and above , respectively, consistent with the universal law of the change.Oes With decreasing field, the value of is nearly unchanged at and higher temperatures, however, it shows visible deviation at lower temperatures, which is most likely contributed by its magnetic anisotropy effect.
IV CONCLUSIONS
In summary, we have studied in detail the magnetism and magnetocaloric effect of bulk CrI3 single crystal. The second-stage magnetic transition was clearly observed at = 48 K, just below the Curie temperature = 61 K, indicating two-step magnetic ordering and suggesting that detailed neutron scattering measurements are of interest to shed more light on its microscopic mechanism. A second-order transition from the PM to FM phase around has been confirmed by the scaling analysis of magnetic entropy change . The follows the power law of with , as well as the field dependence of RCP. The values reach the minimum at 60 K, i.e., its actual . Considering its ferromagnetism can be maintained upon exfoliating bulk crystals down to a single layer, further investigation on the size dependence of magnetocaloric effect is of interest.
Acknowledgements
This work was supported by the US DOE-BES, Division of Materials Science and Engineering, under Contract No. DE-SC0012704 (BNL).
References
- (1) M. A. McGuire, G. Clark, S. KC, W. M. Chance, G. E. Jellison, Jr., V. R. Cooper, X. D. Xu, and B. C. Sales, Phys. Rev. M 1 014001 (2017).
- (2) M. A. McGuire, H. Dixit, V. R. Cooper, and B. C. Sales, Chem. Mater. 27, 612 (2015).
- (3) B. Huang, G. Clark, E. Navarro-Moratalla, D. R. Klein, R. Cheng, K. L. Seyler, D. Zhong, E. Schmidgall, M. A. McGuire, D. H. Cobden, W. Yao, D. Xiao, P. Jarillo-Herrero, and X. D. Xu, Nature 546, 270 (2017).
- (4) K. L. Seyler, D. Zhong, D. R. Klein, S. Guo, X. Zhang, B. Huang, E. Navarro-Moratalla, L. Yang, D. H. Cobden, M. A. McGuire, W. Yao, D. Xiao, P. Jarillo-Herrero, and X. D. Xu, Nature Physics 14, 277 (2018).
- (5) C. Gong, L. Li, Z. L. Li, H. W. Ji, A. Stern, Y. Xia, T. Cao, W. Bao, C. Z. Wang, Y. Wang, Z. Q. Qiu, R. J. Cava, S. G. Louie, J. Xia, and X. Zhang, Nature 546, 265 (2017).
- (6) M. W. Lin, H. L. Zhuang, J. Q. Yan, T. Z. Ward, A. A. Puretzky, C. M. Rouleau, Z. Gai, L. B. Liang, V. Meunier, B. G. Sumpter, P. Ganesh, P. R. C. Kent, D. B. Geohegan, D. G. Mandrus, and K. Xiao, J. Mater. Chem. C 4, 315 (2016).
- (7) H. L. Zhuang, Y. Xie, P. R. C. Kent, and P. Ganesh, Phys. Rev. B 92, 035407 (2015).
- (8) G. Ouvrard, E. Sandre, and R. Brec, J. Solid State Chem. 73, 27 (1988).
- (9) V. Carteaux, G. Ouvrard, J. C. Grenier, and Y. Laligant, J. Magn. Magn. Mater. 94, 127 (1991).
- (10) V. Carteaux, D. Brunet, G. Ouvrard, and G. André, J. Phys.: Condens. Matter 7, 69 (1995).
- (11) L. D. Casto, A. J. Clune, M. O. Yokosuk, J. L. Musfeldt, T. J. Williams, H. L. Zhuang, M. W. Lin, K. Xiao, R. G. Hennig, B. C. Sales, J. Q. Yan, and D. Mandrus, APL Mater. 3, 041515 (2015).
- (12) X. Zhang, Y. L. Zhao, Q. Song, S. Jia, J. Shi, and W. Han, Jpn. J. Appl. Phys. 55, 033001 (2016).
- (13) F. W. Zheng, J. Z. Zhao, Z. Liu, M. L. Li, M. Zhou, S. B. Zhang, and P. Zhang, arXiv:1709.05472.
- (14) Z. Wang, I. Gutiérrez-Lezama, N. Ubrig, M. Kroner, T. Taniguchi, K. Watanabe, A. Imamoğlu, E. Giannini, and A. F. Morpurgo, arXiv:1801.08188.
- (15) T. Song, X. Cai, M. Tu, X. Zhang, B. Huang, N. P. Wilson, K. L. Seyler, L. Zhu, T. Taniguchi, K. Watanabe, M. A. McGuire, D. H. Cobden, D. Xiao, W. Yao, and X. D. Xu, arXiv:1801.08679.
- (16) S. Jiang, L. Li, Z. Wang, K. F. Mak, and J. Shan, arXiv:1802.07355.
- (17) B. Huang, G. Clark, D. R. Klein, D. MacNeill, E. Navarro-Moratalla, K. L. Seyler, N. Wilson, M. A. McGuire, D. H. Cobden, D. Xiao, W. Yao, P. Jarillo-Herrero, and X. D. Xu, arXiv:1802.06979.
- (18) Wei-Bing Zhang, Qian Qu and Chi-Hang Lam, J. Mater. Chem. C 3, (2015).
- (19) V. Yu. Verchenko, A. A. Tsirlin, A. V. Sobolev, I. A. Presniakov and A. V. Shevelkov, Inorg. Chem. 54, 8598 (2015).
- (20) Y. Liu and C. Petrovic, Phys. Rev. B 97, 014420 (2018).
- (21) A. Das, A. K. Majumdar, J. Magn. Magn. Mater. 128, 27 (1993).
- (22) T. Moriya, Phys. Rev. 120, 91 (1960).
- (23) J. L. Lado, and J. F. Rossier, 2D Mater. 4, 035002 (2017).
- (24) S. N. Kaul, Phys. Rev. B 27, 5761 (1983).
- (25) S. N. Kaul, J. Phys.: Condens. Matter 3, 4027 (1991).
- (26) V. Pecharsky, K. Gscheidner, J. Magn. Magn. Mater. 200, 44 (1999).
- (27) J. Amaral, M. Reis, V. Amaral, T. Mendonc, J. Araujo, M. Sa, P. Tavares, J. Vieira, J. Magn. Magn. Mater. 290, 686 (2005).
- (28) V. Franco and A. Conde, Int. J. Refrig. 33, 465 (2010).
- (29) H. Oesterreicher and F. T. Parker, J. Appl. Phys. 55, 4334 (1984).
- (30) V. Franco, J. S. Blazquez, and A. Conde, Appl. Phys. Lett. 89, 222512 (1984).
- (31) V. Franco, A. Conde, D. Sidhaye, B. L. V. Prasad, P. Poddar, S. Srinath, M. H. Phan, and H. Srikanth, J. Appl. Phys. 107, 09A902 (2010).
- (32) H. E. Stanley, Introduction to Phase Transitions and Critical Phenomena (Oxford U. P., London and New York, 1971).
- (33) S. Kaul, J. Magn. Magn. Mater. 53, 5 (1985).
- (34) J. C. LeGuillou, and J. Zinn-Justin, Phys. Rev. B 21, 3976 (1980).
- (35) K. A. Gschneidner Jr., V. K. Pecharsky, A. O. Pecharsky, and C. B. Zimm, Mater. Sci. Forum 315-317, 69 (1999).
- (36) A. M. Tishin, Y. I. Spichkin, The Magnetocaloric Effect and its Applications (Institute of Physics Publishing, Bristol, UK, 2003).
- (37) M. H. Phan and S. C. Yu, J. Magn. Magn. Mater. 308, 325 (2007).
- (38) K. E. Maalam, L. Fkhar, M. Hamedoun, A. Mahmoud, F. Boschini, E. K. Hlil, A. Benyoussef and O. Mounkachi, J. Supercond. Nov. Magn. 30, 1943 (2017).