Spin-State dependent Conductance Switching in Single Molecule-Graphene Junctions†
Enrique Burzurí,∗a,b Amador García-Fuente,c Victor García-Suárez,c Kuppusamy Senthil Kumar,d,e Mario Ruben,d,e Jaime Ferrer,∗c and Herre S. J. van der Zant a
Spin-crossover (SCO) molecules are versatile magnetic switches with applications in molecular electronics and spintronics. Downscaling devices to the single-molecule level remains, however, a challenging task since the switching mechanism in bulk is mediated by cooperative intermolecular interactions. Here, we report on electron transport through individual Fe-SCO molecules coupled to few-layer graphene electrodes via stacking. We observe a distinct bistability in the conductance of the molecule and a careful comparison with density functional theory (DFT) calculations allows to associate the bistability with a SCO-induced orbital reconfiguration of the molecule. We find long spin-state lifetimes that are caused by the specific coordination of the magnetic core and the absence of intermolecular interactions according to our calculations. In contrast with bulk samples, the SCO transition is not triggered by temperature but induced by small perturbations in the molecule at any temperature. We propose plausible mechanisms that could trigger the SCO at the single-molecule level.
Tuning the magnetic properties of individual molecules is sought in molecular spintronics as the key to fabricate switchable molecule-scale electronic components.1, 2, 3 The tuning mechanisms in spin-crossover (SCO) complexes are particularly versatile.4, 5, 6, 7 The spin value of the molecular magnetic core, typically an Fe(II) complex, can be switched between a high-spin (HS) and a low-spin (LS) state by modifying its local geometry with light,8, 9 pressure,10, 11 temperature,12, 13 voltage14, 15, 16, 17 or the adsorption of molecules.18, 19, 20 SCO switching with temperature is established in macroscopic crystals where the molecular geometry is well defined and stable in an ordered lattice. The change in spin state can be detected for example as a change in the crystal color20 or in the magnetic susceptibility.12 Additionally, the electrical current has been used as a probe for the spin-state switching in thin films of nanoparticles21, 13 and molecular thin films.22
Downscaling SCO phenomena to the single-molecule level, however, entails a fundamental difference14 with respect to measurements on large assemblies: the cooperative intermolecular interactions that mediate the SCO in e.g. crystals23, 24 are absent. To overcome this, alternative strategies based on porphyrin, terpyridine and bispyridine derivatives have recently been developed. The SCO is now induced at the molecular level by either electrostatic effects25, 14, 15, 16 or molecular stretching26, 27 in a single-molecule break-junction. The current through the molecule then acts as the probe to detect the SCO transition where bulk characterization methods fail. At present, it is, however, still unclear what happens for individual molecules that show a temperature-induced SCO transition and are embedded in a solid-state device where the steric hindrance of the crystal felt by the molecule is absent. It is, however, known that structural distortions induced in single molecules by their contacts to metallic (Au) surfaces or electrodes are well known to modify their magnetism28, 29, 30, 31 and even quench the SCO mechanism.32
Graphene electrodes provide advantages in studying individual temperature-induced SCO molecules. They have proved to be stable from cryogenic up to room temperatures33 in contrast to gold nanoelectrodes, enabling the study of temperature-induced SCO transitions in single molecules around room temperature. In addition, a soft molecule-graphene coupling via stacking may contribute to preserve the electronic structure of the molecular orbitals34 while providing the flexibility to allow for the SCO transition to occur, as demonstrated for molecules on highly oriented pyrolytic graphite (HOPG) surfaces.35
In this work we study electron transport through individual Fe-based SCO molecules linked via stacking to nanometer-spaced few-layer graphene (FLG) electrodes. We observe a reproducible conductance bi-stability between two well-defined states - a strong indication that the spin-crossover switch is active in our single-molecule junctions. In contrast with the temperature-induced transition observed in macroscopic crystals of these molecules, the SCO behavior at the single-molecule level is triggered in time at any temperature even below the well-defined critical temperature for bulk. Density functional theory (DFT) simulations show that the SCO transition induces a sharp change in the energy spectrum of the molecular orbitals leading to conductance bi-stability, in agreement with the experiments. We find that small perturbations (2.5 ) of the distance between the Fe(II) ion and its coordinated ligand atoms can trigger the switch between the HS and LS states.
We use an [Fe(L)2](BF4)CH3CNH2O molecule,12 hereafter referred to as Fe-SCO, where L is the ligand 4-(2,6-di(1-pyrazol-1-yl)pyridin-4-yl)benzyl-4-(pyren-1-yl)butanoate. A schematic cartoon of this molecule is shown in Figure 1(a). The Fe(II) ion is coordinated with two 2,6-bispyrazolylpyridine (bpp) ligands in an octahedral (Oh) symmetry distorted to a S4 symmetry because of the ligand-Fe(II) coordination specific to this molecule. In addition, our DFT calculations show that the molecule undergoes a Jahn-Teller distortion that reduces the symmetry even further (see Section 3 in the Supplemental Material ). The extended backbone is made of two benzoyl ester and C3 alkyl groups symmetrically connected to the bpp units, thus providing extra length and flexibility to the molecule. These ligands are connected to two pyrene ending-groups that promote soft anchoring to graphene via stacking. Additional details on the molecule and its synthesis can be found in Ref.12.
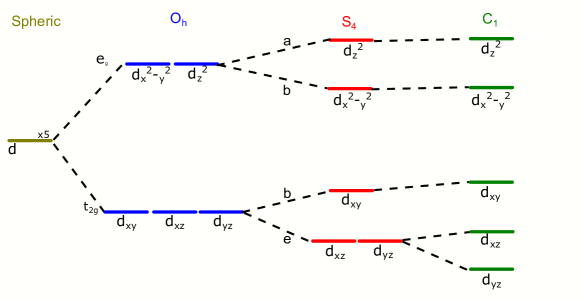
The ligand field interaction of approximate Oh symmetry felt by the Fe(II) ion splits the 5-fold degenerate energy spectrum of its 3 electronic shell into two well separated eg and t2g levels by a ligand field splitting energy as shown schematically in Figure 1(c). depends on the average distance between the central Fe(II) ion and its neighboring ligand atoms approximately as ,36 and therefore depends inversely on temperature due to thermal expansion. At low temperatures is larger than the exchange interaction among the six electrons in the Fe(II) ion. As a result, the Fe-SCO molecules are in a low-spin (LS) = 0 ground state (see Figure 1(c)). However, decreases with increasing temperature and becomes eventually smaller than , making the eg states accessible. These levels are then filled to maximize the spin according to Hund’s first principle, resulting in a high-spin (HS) state = 2 above a certain temperature (see Figure 1(c)). The magnetic characterization of crystals (bulk) made of these Fe-SCO molecules shows that the spin-crossover transition between HS and LS states occurs at around = 225 K.12 Interestingly, it is already observed in crystals made of Fe-SCO molecules that structural factors, such as the length or flexibility of the molecule, are determinant to trigger or not the spin-crossover transition.12
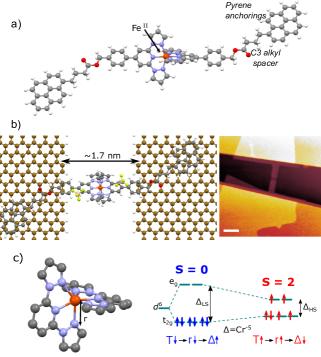
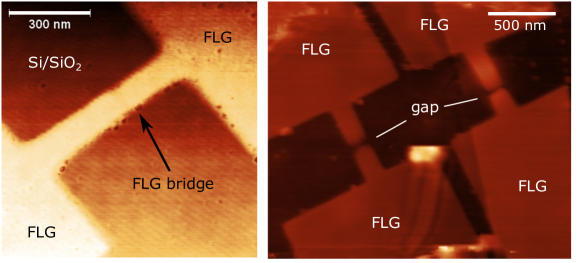
In our devices, a Fe-SCO molecule is anchored to two FLG electrodes. A schematic representation of the FLG/Fe-SCO/FLG junction and an atomic force microscopy (AFM) image of the graphene electrodes is shown in Figure 1(b). FLG flakes are deposited on a Si/SiO2 substrate by mechanical exfoliation. Thereafter, a nanometer-size gap between source and drain is fabricated using 100-200 nm-wide pre-patterned bridges in the flakes37 that are narrowed down during electroburning. 38, 33 See additional details in Section 1.1 of the Supplemental Material. Typical gap sizes after electroburning are39 in the order of 1-2 nm while the length of the molecule spans over 4 nm, so that a substantial part of the molecular backbone may also be lying on the FLG electrodes as depicted in Figure 1(b). The advantage of this configuration is that the anchoring groups lie farther from the edges, facilitating the coupling to graphene by stacking.39 In this paper, including the Supplemental Material, we discuss six molecular junctions that show molecular features and together they provide a consistent set of data.
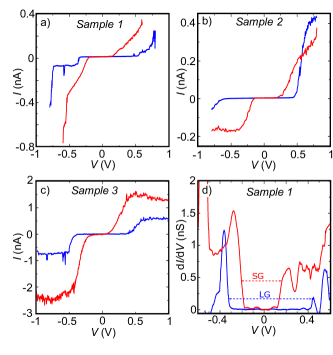
Figure 2(a-c) shows the current () - voltage () characteristics measured at cryogenic temperatures of three different junctions after deposition of the Fe-SCO molecules. When compared with the empty junction, a sharp increase in the current of around two orders of magnitude indicates the formation of a molecular junction (see Section 1.2 in the Supplemental Material). In these three junctions, a clear bi-stability appears between two well-defined states: a large-gap (LG) state (blue curve) and a small-gap (SG) state (red curve). The low-bias current is strongly suppressed in both states. This is a signature of off-resonant transport in a Coulomb blockade regime. At higher bias, sharp resonances at threshold voltages 0.1-0.2 V in the SG state and 0.5 V in the LG state lift the conductance blockade revealing resonant transport through a molecular orbital with the being twice the distance to the closest molecular orbital when expressed in energy.40 These blockade and resonant transport features are more clearly seen in the differential conductance d/d curves shown in Figure 2(d). Sample 5 with a similar bistable behavior is shown in the Supplemental Material. An additional sample (sample 4) that does not show a bi-stability appears to be "trapped" in the SG state with similar resonant voltages (see Section 2 in the Supplemental Material). The source of the negative differential resistance observed in samples 3 and 5 could be found in the intrinsic functionalities of some graphene edges’ shapes41 (see Section 2.1 of the Supplemental Material.)
Bistable conductance characteristics have been observed for SCO nanoparticles38, 13 and electrically16 or mechanically26 induced SCO molecules coupled to gold electrodes or surfaces.42 The sharp change in the resonant voltage from to in our junctions is indicative of an abrupt change in the molecular orbitals around the Fermi level of graphene, tentatively induced by the SCO transition. We further note that current levels and the resonant voltage differ by less than an order of magnitude between the different devices for both the LG and SG states. This reproducibility could stem from the electrode-molecule anchoring geometry facilitated by graphene, as seen in other reports43, 44, 39, 45 and predicted in theoretical simulations.34
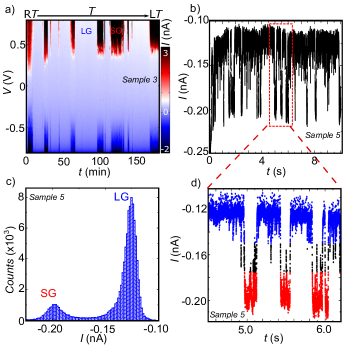
Hereafter, we discuss the stability of the SG and LG states as a function of temperature and time. Figure 3(a) shows a representative color plot of measured as a function of in sample 3 while decreasing the temperature. A telegraph-like switch is observed between well-separated states. Note, that this kind of time-dependent switch has not been observed in empty graphene junctions nor in junctions containing molecules coupled to graphene via - but without SCO functionality37, 44, 43, 39 and that, as expected in molecular junctions, the current levels are orders of magnitude below those observed in electroburned graphene junctions of carbon chains.46 In contrast to crystals of these molecules, the switching mechanism at the single-molecule level is triggered in time at any temperature even well below the bulk HS-LS transition temperature. This is a priori not surprising since the steric hindrance in the crystal is different than that for a single molecule and the SCO transition may sensitively depend on the local geometry adopted by the molecule in the junction.26
Figure 3(b) shows a current versus time trace measured during 10 seconds at a fixed bias voltage of -0.6 V and at 4 K. The voltage is larger than but lower than , and is set well below the SCO transition temperature reported for crystals. The area enclosed in the dotted rectangle is magnified in Figure 3(d). The telegraph-like switch is persistent even at low temperatures. The average lifetime of the states extracted from the plateau lengths is of the order of seconds and tenths of a second for the LG and SG states respectively. These timescales are typical of conformational switches in molecules on surfaces as observed via scanning tunnel microscopy47, 48, 49 and recently, a similar switching in time and timescales of seconds have been observed on SCO molecules deposited on surfaces.42
Figure 3(c) shows a current histogram obtained from the whole data range in Figure 3(b). Two conductance states clearly emerge above the noise level in the statistics. Interestingly, the LG state centered at -0.126 nA is around 80 more stable than the SG state centered at -0.198 nA. The fit to a Lorentzian distribution gives dispersion values of 0.012 nA and 0.017 nA for the LG and SG states respectively. The narrow distributions suggest that the molecule switches back-and-forth between two distinct configurations. A similar analysis has been performed on sample 1 in Section 2 of the Supplemental Material. Note, that the observed temperature and time dependence of the switching makes charge-offset effects a less likely explanation for it (see Section 1.3 of the Supplemental Material).
To analyze the plausibility of the spin-crossover scenario we have performed density functional theory (DFT) calculations of the structural and electronic properties of the Fe-SCO with the SIESTA code.50 Quantum transport simulations of the electrical and spintronic properties of the graphene/Fe-SCO/graphene junctions were carried out with the aid of the code GOLLUM.51, 52 The simulated molecular junctions contain two graphene electrodes, formed by 282 C and 12 H atoms. The distance between the electrodes is set to 1.7 nm and the Fe-SCO molecule is placed bridging the electrodes so that each pyrene unit lies inside the sheets as indicated in Figure 1(b). The fully optimized molecule-electrode structure results in a = 0 (LS) ground state. A less stable = 2 (HS) configuration can also be obtained, which presents longer Fe-N bonds and therefore a smaller ligand field splitting acting on the Fe(II) orbitals. Additional details can be found in Section 3 of the Supplemental Material.
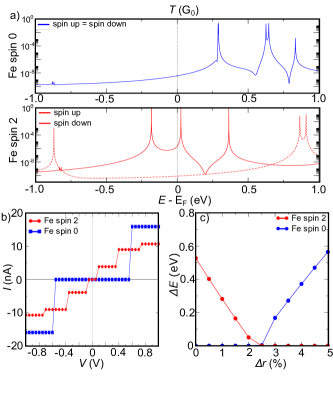
Figure 4(a) shows the spin-dependent transmission function computed for the LS and the HS states. The transmission in the LS state is spin degenerate and, at low energies, is mediated by the lowest unoccupied molecular orbital (LUMO) that lies 0.27 eV above the Fermi energy. For the HS state, the structure of around the Fermi level is remarkably different. The transmission function depends now on the spin component. The minority spin transmission function displays three new peaks, one of which (LUMO) is much closer ( 0.02 eV) to the Fermi level than in the LS state. This shift has a strong effect on the computed - characteristics for the HS and the LS states as shown in Figure 4(b). The calculated curves strikingly resemble to the experimental ones in Figure 2 in terms of resonant voltages ( and ) and current levels. By comparison, we can thus ascribe the SG state in the measurements to the HS state and the LG state to the LS state. This correspondence is in agreement with previous experimental reports with other SCO molecules.16, 26
In contrast with , is rather flat and smaller in a wide energy range. We believe that this feature could be exploited to fabricate switchable spin filters. However, for that to happen the spin direction on the molecule itself needs to be fixed for instance by introducing magnetic anisotropy. The explanation behind this spin-resolved transmission can be attributed to the different filling of the orbitals as explained in more detail in Section 3 of the Supplemental Material.
We have further analyzed the impact of the molecule’s stretching on the relative energies of its HS and LS states. However, DFT may not provide an accurate enough description of the multi-electronic state of the molecule, so we have fitted the DFT estimate of the ligand field effects for the LS state to the following multi-electronic Hamiltonian:
| (1) |
where represents the electrostatic interaction between the electrons of the Fe(II) ion and accounts for the ligand field interaction of the electrons with the surrounding atoms. can be parametrized in terms of the Slater-Condon parameters .53 We have taken as the average distance between the central Fe(II) ion and the surrounding ligands in the most stable configuration of the molecule, and have then stretched this average distance by an amount . Because the strength of the ligand field is known to be approximately proportional to for 3 electrons,36 we have simulated the molecule’s stretching by decreasing the strength of the term by . The total energies of the lowest LS and HS multi-electronic solutions, relative to the lowest state, are plotted in Figure 4(c). Note, that the spin transition from = 0 to = 2 occurs at a as small as 2.5 . Importantly, we note that variations of 1 relative to stabilize either of the two states by more than 0.2 eV. Translating this effect to single-molecule junctions, we expect that small perturbations to the molecule arrangement inside the gap because of bias, temperature fluctuations, vibrations, etc may trigger the spin-switching behavior even below the bulk , or hinder it (as in sample 4 in the Supporting Information) depending on the junction conformation. Note, that the transmission curves shown in Figure 4(a) for the LS (HS) are representative of any below (above) 2.5 with minor variations.
To further study the effect of perturbations we have displaced in the simulations the molecule perpendicular to the junction gap. We have found that the most stable configuration corresponds to the molecule’s core lying inside the gap. We have also found that the molecule may drift easily inside the gap with energy barriers as small as 20 meV. However, once the core hits one of the two electrodes, the energy barrier for further motion above the electrode rises sharply to 0.5 - 1 eV because of steric hindrance. As a consequence, the molecule’s core stays within the gap. Importantly, the relative stability of the different magnetic solutions of the Fe-SCO is not affected by the details of the bonding to the sheets or the orientation.
A final remark concerns the spin-state life times and the associated stimuli needed to switch the SCO molecule. Long spin-state lifetimes at room temperature have been reported for SCO complexes in solution and on surfaces, where cooperative interactions and low-energy phonons proper of a SCO crystal are absent.54, 55, 42 These spin transitions have been observed to involve large structural rearrangements leading to high energy barriers between the LS and HS states. Similar structural distortions have been observed for bpp derivatives.56, 57 Slow, temperature-independent SCO up to 120 K has been found in other Fe(II) complexes that share the same ligand geometry as bpp molecules.58, 59 These two ingredients: lack of cooperative intermolecular interactions and a bpp skeleton are present in our solid-state device. The calculations (see Section 3 of the Supplemental Material) for the Fe(II) SCO molecule in this study indicate that tunneling is the dominant switching mechanism up to temperatures of the order 100 K in the absence of stimuli other than temperature, in agreement with Ref.60. We find resident times in the range 10-3 - 100 seconds independent of the temperature (see Section 3 of the Supplemental Material), that are consistent with our experiments. For higher temperatures vibrational heating reduces those resident times. We note here that, the temperature of a single-molecule that is voltage biased through weakly coupled electrodes is ill-defined and may be subject to fluctuations.61
Additionally, other stimuli, i.e., mechanical, electrical or thermal, could contribute to triggering the SCO mechanism or block it if a single-molecule is embedded in a junction. Transitions between HS and LS states can be induced by the electronic charging of the molecule by an external bias.17 Local perturbations to the binding geometry could, for example, induce strain to the molecule ligands, which can be large enough to stretch the ligand-metal ion distance to induce the spin transition.27 Moreover, the strong electric fields generated by the voltage in these narrow solid-state nano-junctions could induce non-equilibrium spin-orbit effects25 or dipole-induced strain62 in the molecule due to the opposite charge of the Fe core and the ligands. Again, these effects can influence the ligand-metal ion distance and thereby initiate the SCO transition.
In conclusion, we have measured electron transport through individual Fe-SCO molecules coupled to few-layer graphene electrodes. We observe a reproducible switching between two bistable states triggered by the SCO transition in the molecule. DFT calculations provide a qualitative and quantitative agreement thanks to the well-defined geometry of the molecule-graphene coupling. The switching occurs well below the critical temperature for crystals of the same molecules. DFT suggests that the switch at the single-molecule level can be induced by small perturbations to the ligand distance in the molecular junction. Finally, the HS state of the molecule is spin resolved; these molecules could therefore be used as switchable spin polarizers.
Conflicts of interest
There are no conflicts to declare.
Acknowledgments
We acknowledge financial support from the Dutch Organization for Fundamental research (NWO/FOM), the European Commission through an advanced ERC grant (Mols@Mols) and the Marie Curie ITN MOLESCO, from the Netherlands Organization for Scientific Research (NWO/OCW) as part of the Frontiers of Nanoscience program, and from the Spanish Ministerio de Economia y Competitividad through the project FIS2015-63918-R. EB thanks funds from the EU FP7 program through Project 618082 ACMOL and NWO through a VENI fellowship.
Supporting Infromation for Spin-State dependent Conductance Switching in Single Molecule-Graphene Junctions†
This supporting information is divided in three sections. Section 1 contains additional details on the geometry and dimensions of the electrodes and a representative electronic characterization of the empty few-layer graphene (FLG) electrodes. Section 2 contains additional examples of FLGFe-SCOFLG junctions. Finally, Section 3 contains more details of the DFT and quantum transport simulations, including the projection of the density of states on the different molecular orbitals.
1 Geometry and characterization of empty FLG junctions
1.1 Geometry and dimensions of the FLG devices. Molecular deposition.
A thorough description of the fabrication of the FLG electrodes as well as a set of images of the devices can be found in Ref.37 . In summary, a micron-size flake is selected under the optical microscope to fabricate the FLG electrodes. Gold pads are deposited thereafter on the flake to create electrical access. Parts of the flake are etched away with oxygen plasma so that a pre-patterned bridge of approximately 100-200 nm width is formed as seen in Figure 1 of the main manuscript. Additional atomic force microscopy (AFM) images are shown in Figure 5. The gap separating source and drain electrodes is opened by feedback-controlled electroburning. The burning process typically starts around the middle segment of the bridges’ edges as explained in Ref.37 . The minimum separation between the electrodes, 1-2 nm, is localized in a small section of the gap where the last contact point before total electroburning was placed. The remaining sections of the electrodes edges can be separated tens of nanometers apart.
Once the electrodes are prepared, the SCO molecules are dispersed in a 10-4 M solution of acetonitrile. A droplet is drop-casted on the chip and thereafter dried with N2 gas. A low concentration is chosen on purpose to reduce the probability that a given device has its electrodes bridged by more than one molecule. Furthermore, only those molecules that are deposited at the effective gap section can bridge the electrodes.
We note that only 10 of the samples contain molecular traces, so the probability that one molecule bridges the electrodes is . This value is comparable to other studies using electromigrated Au40, or electroburned graphene electrodes39. This spells that the probability of finding two molecules bridging a junction is , if the two events are statistically uncorrelated, so that only one in one hundred samples should have more than one molecule. In addition, steric hindrance among molecules should reduce below 0.01. As a consequence, we expect that the probability that one of our samples contain more than one molecule is low.
In the unlikely scenario of more than one molecule in the gap and bridging the electrodes, the electron-transport across the junction would be dominated by the one more strongly coupled to the electrodes. In the even more unlikely circumstance that two molecules are present with equivalent couplings, three different current values should be observed for switching molecules (2, +, 2) given that the molecules switch incoherently. The latter is ruled out in our experiments. Our conclusions remain trivially the same if they switch coherently.
1.2 Characterization of the empty gap
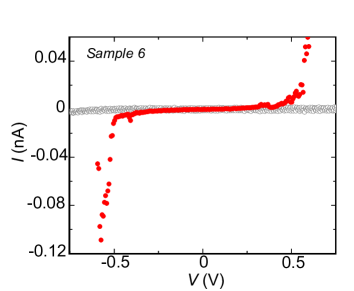
Figure 6 shows the current () - voltage () characteristic measured between a pair of FLG electrodes (sample 6) before (empty electrodes) and after deposition of a solution with the Fe-SCO molecules. The high-bias current increases around two orders of magnitude after molecular deposition pointing to the formation of a molecular junction37, 39. The low-bias conductance gap is consistent with the large-gap (LG) state observed in the other samples and with the Fe-SCO molecule in a LS state according to DFT calculations.
1.3 Charge offset effects
Charge-offsets can lead to abrupt shifts in the current but these are, however, typically "seen in" and "activated by" sweeping the gate voltage. In contrast, our measurements show time-dependent switching at a fixed gate voltage. Furthermore, the switching rate associated with thermally-activated hoping of charges from charge trap to charge trap would be strongly temperature dependent. In contrast, we do not observe a strong temperature dependence of the switching in Figure 3(a) in the main manuscript. Deep traps may still be present and activated by an electrical field. However, the randomness we see in the switching rates (both in time and bias voltage) together with the reproducibility of the threshold voltages mentioned before do no support such a picture.
2 Additional samples
Figure 7(a) shows an - characteristic measured at = 100 K in an additional junction (sample 4) containing an Fe-SCO molecule. The high-bias current and the size of the low-bias suppression gap fit well with the SG state characteristics of samples 1, 2 and 3 shown in Figure 2 of the main manuscript. Following the rationale provided by DFT, the Fe-SCO molecule is in a high-spin (HS) state as explained in Figure 4(b) of the main manuscript. In contrast to samples 1 to 3, no conductance bistability or switching between different conductance states is observed in this junction. The time stability of this sample is plotted in Figure 7(b), showing that the molecule is locked in the small-gap state. This different behavior could be explained for a molecule that undergoes relatively larger deformations between the electrodes (). Small perturbations can in that case not modify the ligand distance enough to induce the spin crossover transition (see Figure 4(c) in the main manuscript).
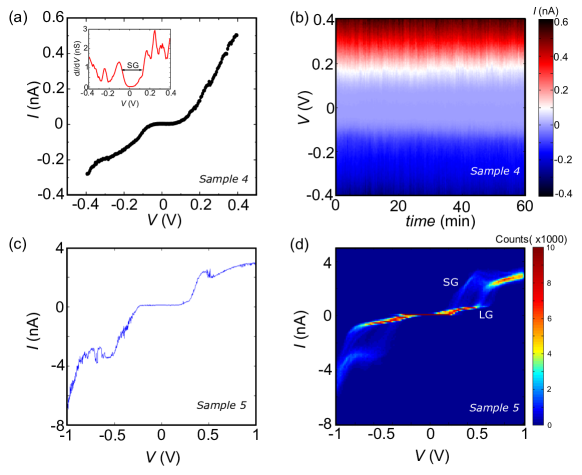
Figure 7(c) shows an - characteristic measured on sample 5 of which the time trace is shown in Figure 3 of the main text. The low-bias conductance gap is consistent with the SG state and therefore with the HS state. The high-bias current shows negative differential conductance. We discuss this in the next subsection. Figure 7(d) shows a 2D versus histogram made with approximately current traces measured over time. Two bistable conductance states, corresponding to the LG and the SG states can be observed consistent with samples 1 to 3 in the main manuscript. The current level dropped around one order of magnitude between these measurements and the time trace shown in Figure 3 of the main manuscript, possibly due to a rearrangement of the molecule in the junction. Importantly, the bistable character of the molecular junction was preserved.
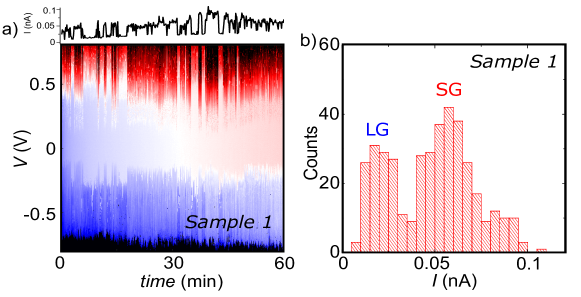
Figure 8(a) shows the time dependence of the - characteristics of sample 1 shown in the main manuscript. A switching in time between two states, similar to the one shown in Figure 3 of the main manuscript, is observed. This is more clearly seen in the single trace taken at = 0.48 V from the plot (top of Figure 8(a)). A histogram of the current at that bias voltage is shown in Figure 8(b). Two conductance values denoted as LG and SG emerge from the noise. The high-current tails of both peaks is more extended in , probably due to a drift of the global current to higher values as already observed in the trace in Figure 8(a).
2.1 Negative differential resistance
Sample 3 shows clear negative differential resistance (NDR) at positive bias. In addition, sample 5 shows symmetric NDR at positive and negative bias, as seen in Figure 7(c). This behavior has been reported for SCO molecules between gold electrodes16. NDR in a molecular junction is a complex phenomenon where several mechanisms could be underlying: vibrational modes, interfering transport paths within the molecule and different electrode-molecule couplings among others, see Ref.63 and references therein for a detailed description. The transmission functions shown in Figure 4 of the main manuscript seem to discard the interference scenario since no suppression of the transmission is observed.
Additionally, in the case of graphene electrodes, it is predicted that sharp zig-zag edges could yield NDR because they carry localized edge states if contacted appropriately; other edge configurations convey trivial functionalities41. Interestingly, the molecular features in the conductance are predicted to be universal for graphene electrodes, in the sense that do not depend on the details of the molecule-electrode contact. This effect is due to the physisorbed nature of our contacts and has been discussed in detail in Ref.34 . The atomic-scale shape of our graphene edges varies from device to device and therefore we expect some variability in the conductance features (like NDR) superimposed to the reproducible features stemming from the molecule (the bi-stable switch).
3 DFT calculations
3.1 Density of states in the LS and HS states
Figure 9 shows the effect of the molecular ligand field on the metallic orbitals of the Fe(II) atom. The five orbitals initially degenerated in the free ion are split into eg and t2g states by an octahedral symmetry. A further reduction of the ligand symmetry to S4 splits further the levels.
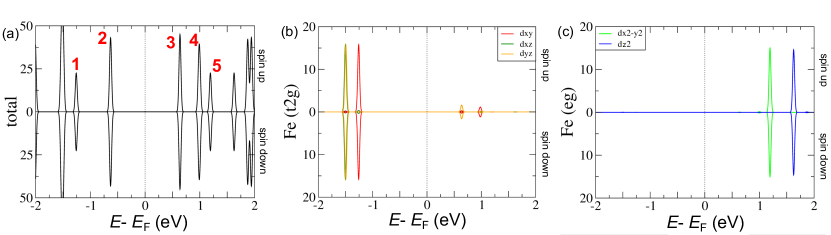
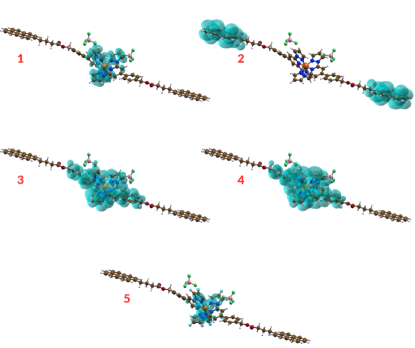
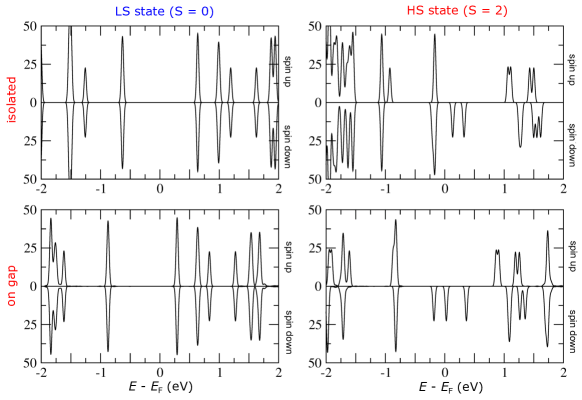
The calculated projected density of states of the isolated Fe-SCO in the LS state is shown in Figure 10(a). As explained in the main manuscript the density of states is spin degenerate. The dxy, dyz and dxz states (t2g) lie mainly below the Fermi level while the d and d states (eg) are found well above as seen in the projected density of states in Figure 10(b) and Figure 10(c) associated to the t2g and eg states respectively. The local density of states of the orbitals closer to the Fermi level is plotted in Figure 11. The states 3 and 4, with small contributions of the t2g orbitals, are strongly delocalized over the Fe-SCO core up to the oxygen atoms where the conjugation is broken. The states 1 and 5, mainly associated with the dxy and d orbitals, which are transversal to the direction of the molecule, are slightly delocalized. The main contribution of dyz and dxz is found well below the Fermi level and d is at higher energies. The state 2 is mainly delocalized over the pyrene anchoring groups.
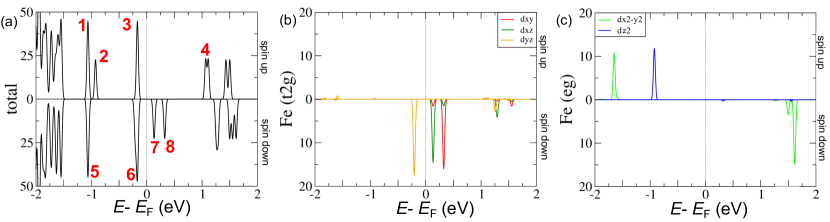
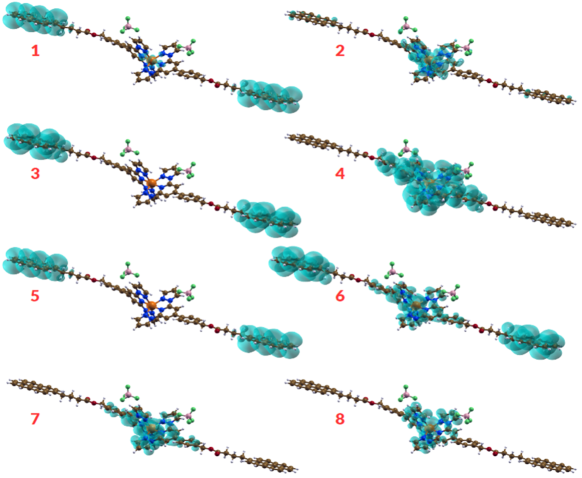
The magnetic behavior of the Fe-SCO in the HS state is rather different. The calculated projected density of states of the isolated Fe-SCO in the HS sate is shown in Figure 12(a). The density of states is now spin resolved. Both the t2g and eg orbitals are occupied and well below the Fermi level for the majority spin component, while only dyz from the t2g orbitals is occupied for the minority spin component (see Figure 12(b) and 12(c)). The minority spin t2g states are only partially occupied, and this fact leads them to be placed quite close to the Fermi level. Indeed, as the symmetry of the Fe-SCO is reduced from Oh to S4, the eg states split into a and b states, and the t2g split into b and e states as seen in Figure 9. The doubly-degenerate states are further split by a Jahn-Teller distortion. Because these turn out to be the two states lying closest to the Fermi energy, this final splitting has a strong impact on around the Fermi level. As a result of the orbital filling, the spin up transmission is mainly blocked up to high energies and only the spin down is transmitted, as explained in the main manuscript. The molecule could therefore be used as a spin filter up to relatively high energies.
The local density of states of the orbitals closer to the Fermi level is plotted in Figure 13. The 2, 6, 7 and 8 states corresponding to d, dyz, dxz and dxy respectively, are slightly delocalized around the Fe core. State 4, with a very small contribution of dyz is very delocalized in the central part of the molecule up to the oxygen atoms. The main contribution of d lies at higher absolute energies above and below the Fermi level. The states 1, 3 and 5 are mainly present in the pyrene anchoring groups.
The discussion and conclusions derived for the isolated molecule can be applied to the molecule placed linking the graphene electrodes. The main effect of the electrodes is a rigid shift of the molecular orbitals associated to the Fe to lower energies as shown in the comparative Figure 14.
3.2 Current switching mechanism and transition rates
We have identified two possible sources of the Low to High Conductance switching, both due to Franck-Condon physics. The first (FCI) is the conventional switching mechanism for Fe(II) spin crossover molecules, where the ground state switches between S=0 and S=2 multiplets due to Temperature, light or perhaps the voltage 64. The second corresponds to sequential () or cotunneling () Franck-Condon physics (FCII) 65, 66, corresponding to or , respectively.
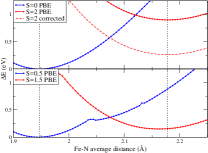
To try and shed some light on this issue we plot in Figure 15 the relative energy of the different spin solutions for the system with (top) and (bottom) electrons, for structural solutions ranging between the ground state of the and the systems. The extra electron of the systems is located in a molecular orbital with contribution from the central Fe ion, thus the spin solutions correspond to the distribution of 7 electrons distributed in a strong () or weak () (or close to ) ligand field. We find that the Fe-N bond distance does not change by adding an extra electron. Therefore, the Franck-Condon factor for sequential tunneling is close to 1. This means that Franck-Condon blockade is not the dominant mechanism, so the FCII scenario is ruled out. On the other hand, there is a strong difference in the Fe-N bond distance of the and systems indicating a strong spin-phonon coupling. This fact implies that Franck-Condon factors for spin-switching are small as usually happens with Fe(II) SCO molecules. We analyse therefore whether the FCI scenario fits with our experiments.
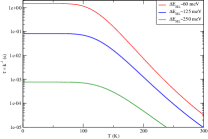
Literature tells that Fe-Terpyridine molecules tend to show slower switching times than other Fe(II) SCO molecules, and that those switching times are temperature-independent up to higher threshold temperatures 64, 67. We borrow the transition rate discussion for switching from Buhks et al.64 :
| (2) |
where indicates the second order transition between electronic states of and due to the spin-orbit coupling and is the Franck-Condon factor which measures the vibrational overlap. To give rough numbers, we use the energy difference between the and ground states ELH, that we extract from our DFT GGA calculations; we find it to be 900 meV (7260 cm-1). However, we note that DFT GGA calculations are known to overstabilize the LS state, thus overestimating ELH. Indeed, our multielectronic calculations of the core Fe2+ levels give an estimate ELH 250 meV (2000 cm-1). So we have decided to shift the two parabolae in Figure (15) accordingly. We can also estimate from the curvature of the two parabolae an elastic constant N/m. The corresponding vibrational energy is =67 meV (537 cm-1). From these parameters we calculate the transition rate as a function of the temperature in Fig. (16). For our estimated value of EHL 250 meV we find a constant transition rate up to more than 100 K, with a value of 10-3 s. This transition rate can be strongly modified if the deposition of the molecule modifies the energy difference between spin states to EHL 125 meV ( 10-1 s) or EHL 60 meV ( 1 s), for example. Other factors, such as the changes in the vibrational states due to the deposition of the molecule, can also play a role.
References
- Bousseksou et al. 2011 A. Bousseksou, G. Molnár, L. Salmon and W. Nicolazzi, Chem. Soc. Rev., 2011, 40, 3313.
- Sanvito 2011 S. Sanvito, Chem. Soc. Rev., 2011, 40, 3336–55.
- Lefter et al. 2016 C. Lefter, V. Davesne, L. Salmon, G. Molnár, P. Demont, A. Rotaru and A. Bousseksou, Magnetochemistry, 2016, 2, 18.
- Gütlich et al. 2000 P. Gütlich, Y. Garcia, H. A. Goodwin, K. S. Murray, J. Shu, R. J. Hemley, H. K. Mao, N. A. Young, F. Varret, O. Kahn, D. R. Smith, K. Wieghardt, M. Zehnder and A. D. Zuberbühler, Chem. Soc. Rev., 2000, 29, 419–427.
- Gamez et al. 2009 P. Gamez, J. S. Costa, M. Quesada and G. Aromí, Dalt. Trans., 2009, 7845–7853.
- Gütlich et al. 2013 P. Gütlich, A. B. Gaspar and Y. Garcia, Beilstein J. Org. Chem., 2013, 9, 342–391.
- Senthil Kumar and Ruben 2017 K. Senthil Kumar and M. Ruben, Coord. Chem. Rev., 2017, 346, 176–205.
- Decurtins et al. 1985 S. Decurtins, P. Gutlich, K. M. Hasselbach, A. Hauser and H. Spiering, Inorg. Chem., 1985, 24, 2174–2178.
- Hauser 1986 A. Hauser, Chem. Phys. Lett., 1986, 124, 543–548.
- Gutlich et al. 2005 P. Gutlich, V. Ksenofontov and A. Gaspar, Coord. Chem. Rev., 2005, 249, 1811–1829.
- Craig et al. 2014 G. A. Craig, J. S. Costa, O. Roubeau, S. J. Teat, H. J. Shepherd, M. Lopes, G. Molnár, A. Bousseksou and G. Aromí, Dalt. Trans., 2014, 43, 729–737.
- González-Prieto et al. 2011 R. González-Prieto, B. Fleury, F. Schramm, G. Zoppellaro, R. Chandrasekar, O. Fuhr, S. Lebedkin, M. Kappes and M. Ruben, Dalt. Trans., 2011, 40, 7564.
- Dugay et al. 2017 J. Dugay, M. Aarts, M. Giménez-Marqués, T. Kozlova, H. W. Zandbergen, E. Coronado and H. S. J. van der Zant, Nano Lett., 2017, 17, 186–193.
- Miyamachi et al. 2012 T. Miyamachi, M. Gruber, V. Davesne, M. Bowen, S. Boukari, L. Joly, F. Scheurer, G. Rogez, T. K. Yamada, P. Ohresser, E. Beaurepaire and W. Wulfhekel, Nat. Commun., 2012, 3, 938.
- Gopakumar et al. 2012 T. G. Gopakumar, F. Matino, H. Naggert, A. Bannwarth, F. Tuczek and R. Berndt, Angew. Chemie Int. Ed., 2012, 51, 6262–6266.
- Harzmann et al. 2015 G. D. Harzmann, R. Frisenda, H. S. J. van der Zant and M. Mayor, Angew. Chemie Int. Ed., 2015, 54, 13425–13430.
- Hao et al. 2017 H. Hao, T. Jia, X. Zheng and Z. Zeng, Phys. Chem. Chem. Phys., 2017, 19, 7652–7658.
- Li et al. 2010 B. Li, R.-J. Wei, J. Tao, R.-B. Huang, L.-S. Zheng and Z. Zheng, J. Am. Chem. Soc., 2010, 132, 1558–1566.
- Coronado et al. 2013 E. Coronado, M. Giménez-Marqués, G. Mínguez Espallargas, F. Rey and I. J. Vitórica-Yrezábal, J. Am. Chem. Soc., 2013, 135, 15986–15989.
- Sánchez-Costa et al. 2014 J. Sánchez-Costa, S. Rodríguez-Jiménez, G. A. Craig, B. Barth, C. M. Beavers, S. J. Teat and G. Aromí, J. Am. Chem. Soc., 2014, 136, 3869–3874.
- Prins et al. 2011 F. Prins, M. Monrabal-Capilla, E. A. Osorio, E. Coronado and H. S. J. van der Zant, Adv. Mater., 2011, 23, 1545–9.
- Lefter et al. 2016 C. Lefter, S. Rat, J. S. Costa, M. D. Manrique-Juárez, C. M. Quintero, L. Salmon, I. Séguy, T. Leichle, L. Nicu, P. Demont, A. Rotaru, G. Molnár and A. Bousseksou, Adv. Mater., 2016, 28, 7508–7514.
- Bedoui et al. 2010 S. Bedoui, G. Molnár, S. Bonnet, C. Quintero, H. J. Shepherd, W. Nicolazzi, L. Salmon and A. Bousseksou, Chem. Phys. Lett., 2010, 499, 94–99.
- Bertoni et al. 2016 R. Bertoni, M. Lorenc, H. Cailleau, A. Tissot, J. Laisney, M.-L. Boillot, L. Stoleriu, A. Stancu, C. Enachescu and E. Collet, Nat. Mater., 2016, 15, 606–610.
- Meded et al. 2011 V. Meded, A. Bagrets, K. Fink, R. Chandrasekar, M. Ruben, F. Evers, A. Bernand-Mantel, J. S. Seldenthuis, A. Beukman and H. S. J. van der Zant, Phys. Rev. B, 2011, 83, 245415.
- Frisenda et al. 2016 R. Frisenda, G. D. Harzmann, J. A. Celis Gil, J. M. Thijssen, M. Mayor and H. S. J. van der Zant, Nano Lett., 2016, 16, 4733–4737.
- Kuang et al. 2017 G. Kuang, Q. Zhang, T. Lin, R. Pang, X. Shi, H. Xu and N. Lin, ACS Nano, 2017, 11, 6295–6300.
- Heersche et al. 2006 H. B. Heersche, Z. de Groot, J. A. Folk, H. S. J. van der Zant, C. Romeike, M. R. Wegewijs, L. Zobbi, D. Barreca, E. Tondello and A. Cornia, Phys. Rev. Lett., 2006, 96, 206801.
- Gaudenzi et al. 2016 R. Gaudenzi, E. Burzurí, D. Reta, I. d. P. R. Moreira, S. T. Bromley, C. Rovira, J. Veciana and H. S. J. van der Zant, Nano Lett., 2016, 16, 2066–2071.
- Burgess et al. 2015 J. A. J. Burgess, L. Malavolti, V. Lanzilotto, M. Mannini, S. Yan, S. Ninova, F. Totti, S. Rolf-Pissarczyk, A. Cornia, R. Sessoli and S. Loth, Nat. Commun., 2015, 6, 8216.
- Burzurí et al. 2015 E. Burzurí, R. Gaudenzi and H. S. J. van der Zant, J. Phys. Condens. Matter, 2015, 27, 113202.
- Warner et al. 2013 B. Warner, J. C. Oberg, T. G. Gill, F. El Hallak, C. F. Hirjibehedin, M. Serri, S. Heutz, M.-A. Arrio, P. Sainctavit, M. Mannini, G. Poneti, R. Sessoli and P. Rosa, J. Phys. Chem. Lett., 2013, 4, 1546–1552.
- Burzurí et al. 2012 E. Burzurí, F. Prins and H. S. J. Van Der Zant, Graphene, 2012, 1, 26–29.
- García-Suárez et al. 2013 V. M. García-Suárez, R. Ferradás, D. Carrascal and J. Ferrer, Phys. Rev. B, 2013, 87, 235425.
- Bernien et al. 2015 M. Bernien, H. Naggert, L. M. Arruda, L. Kipgen, F. Nickel, J. Miguel, C. F. Hermanns, A. Krüger, D. Krüger, E. Schierle, E. Weschke, F. Tuczek and W. Kuch, ACS Nano, 2015, 9, 8960–8966.
- Newman and Ng 2000 D. J. Newman and B. K. C. Ng, Crystal Field Handbook, Cambridge University Press, 2000.
- Island et al. 2014 J. O. Island, A. Holovchenko, M. Koole, P. F. A. Alkemade, M. Menelaou, N. Aliaga-Alcalde, E. Burzurí and H. S. J. van der Zant, J. Phys. Condens. Matter, 2014, 26, 474205.
- Prins et al. 2011 F. Prins, A. Barreiro, J. W. Ruitenberg, J. S. Seldenthuis, N. Aliaga-Alcalde, L. M. K. Vandersypen and H. S. J. van der Zant, Nano Lett., 2011, 11, 4607–4611.
- Burzurí et al. 2016 E. Burzurí, J. O. Island, R. Díaz-Torres, A. Fursina, A. González-Campo, O. Roubeau, S. J. Teat, N. Aliaga-Alcalde, E. Ruiz and H. S. J. van der Zant, ACS Nano, 2016, 10, 2521–2527.
- Perrin et al. 2015 M. L. Perrin, E. Burzurí and H. S. J. van der Zant, Chem. Soc. Rev., 2015, 44, 902–19.
- Carrascal et al. 2012 D. Carrascal, V. M. García-Suárez and J. Ferrer, Phys. Rev. B, 2012, 85, 195434.
- Jasper-Toennies et al. 2017 T. Jasper-Toennies, M. Gruber, S. Karan, H. Jacob, F. Tuczek and R. Berndt, Nano Lett., 2017, 17, 6613–6619.
- Ullmann et al. 2015 K. Ullmann, P. B. Coto, S. Leitherer, A. Molina Ontoria, N. Martín, M. Thoss and H. B. Weber, Nano Lett., 2015, 15, 3512–3518.
- Mol et al. 2015 J. A. Mol, C. S. Lau, W. J. M. Lewis, H. Sadeghi, C. Roche, A. Cnossen, J. H. Warner, C. J. Lambert, H. L. Anderson and G. A. D. Briggs, Nanoscale, 2015, 7, 13181–13185.
- Lumetti et al. 2016 S. Lumetti, A. Candini, C. Godfrin, F. Balestro, W. Wernsdorfer, S. Klyatskaya, M. Ruben and M. Affronte, Dalt. Trans., 2016, 45, 16570–16574.
- Sarwat et al. 2017 S. G. Sarwat, P. Gehring, G. Rodriguez Hernandez, J. H. Warner, G. A. D. Briggs, J. A. Mol and H. Bhaskaran, Nano Lett., 2017, 17, 3688–3693.
- Liljeroth et al. 2007 P. Liljeroth, J. Repp and G. Meyer, Science, 2007, 317, 1203–1206.
- Komeda et al. 2011 T. Komeda, H. Isshiki, J. Liu, Y.-F. Zhang, N. Lorente, K. Katoh, B. K. Breedlove and M. Yamashita, Nat. Commun., 2011, 2, 217.
- Zhang et al. 2015 J. L. Zhang, J. Q. Zhong, J. D. Lin, W. P. Hu, K. Wu, G. Q. Xu, A. T. S. Wee and W. Chen, Chem. Soc. Rev., 2015, 44, 2998–3022.
- Soler et al. 2002 J. M. Soler, E. Artacho, J. D. Gale, A. García, J. Junquera, P. Ordejón and D. Sánchez-Portal, J. Phys. Condens. Matter, 2002, 14, 2745–2779.
- Ferrer et al. 2014 J. Ferrer, C. J. Lambert, V. M. García-Suárez, D. Z. Manrique, D. Visontai, L. Oroszlany, R. Rodríguez-Ferradás, I. Grace, S. W. D. Bailey, K. Gillemot, H. Sadeghi and L. A. Algharagholy, New J. Phys., 2014, 16, 093029.
- García-Suárez and Ferrer 2012 V. M. García-Suárez and J. Ferrer, Phys. Rev. B, 2012, 86, 125446.
- Griffith 1971 J. S. J. S. Griffith, The theory of transition-metal ions., University Press, 1971, p. 455.
- Stock et al. 2013 P. Stock, T. Pȩdziński, N. Spintig, A. Grohmann and G. Hörner, Chem. - A Eur. J., 2013, 19, 839–842.
- Stock et al. 2016 P. Stock, E. Deck, S. Hohnstein, J. Korzekwa, K. Meyer, F. W. Heinemann, F. Breher and G. Hörner, Inorg. Chem., 2016, 55, 5254–5265.
- Kershaw Cook et al. 2015 L. J. Kershaw Cook, F. L. Thorp-Greenwood, T. P. Comyn, O. Cespedes, G. Chastanet and M. A. Halcrow, Inorg. Chem., 2015, 54, 6319–6330.
- Zhang et al. 2015 X. Zhang, M. L. Lawson Daku, J. Zhang, K. Suarez-Alcantara, G. Jennings, C. A. Kurtz and S. E. Canton, J. Phys. Chem. C, 2015, 119, 3312–3321.
- Renz et al. 2000 F. Renz, H. Oshio, V. Ksenofontov, M. Waldeck, H. Spiering and P. Gütlich, Angew. Chemie, 2000, 39, 3699–3700.
- Hauser et al. 2006 A. Hauser, C. Enachescu, M. L. Daku, A. Vargas and N. Amstutz, Coord. Chem. Rev., 2006, 250, 1642–1652.
- Xie and Hendrickson 1987 C. L. Xie and D. N. Hendrickson, J. Am. Chem. Soc., 1987, 109, 6981–6988.
- Ward et al. 2011 D. R. Ward, D. A. Corley, J. M. Tour and D. Natelson, Nat. Nanotechnol., 2011, 6, 33–38.
- Weston et al. 2015 L. Weston, X. Cui, S. Ringer and C. Stampfl, Phys. Rev. Lett., 2015, 114, 247601.
- Perrin et al. 2014 M. L. Perrin, R. Frisenda, M. Koole, J. S. Seldenthuis, J. A. Celis Gil, H. Valkenier, J. C. Hummelen, N. Renaud, F. C. Grozema, J. M. Thijssen, D. Dulić and H. S. J. van der Zant, Nat Nano, 2014, 9, 830–834.
- Buhks et al. 1980 E. Buhks, G. Navon, M. Bixon and J. Jortner, J. Am. Chem. Soc., 1980, 102, 2918–2923.
- Burzurí et al. 2014 E. Burzurí, Y. Yamamoto, M. Warnock, X. Zhong, K. Park, A. Cornia and H. S. J. van der Zant, Nano Lett., 2014, 14, 3191–3196.
- Koch et al. 2006 J. Koch, F. von Oppen and A. V. Andreev, Phys. Rev. B, 2006, 74, 205438.
- Rudavskyi 2014 A. Rudavskyi, Ph.D. thesis, Zernike Institute for Advanced Materials, University of Groningen, the Netherlands, 2014.