The Hard State of the Highly Absorbed High Inclination Black Hole Binary Candidate Swift J1658.2–4242 Observed by NuSTAR and Swift
Abstract
We present a spectral and timing analysis of the newly reported Galactic X-ray transient Swift J1658.2–4242 observed by NuSTAR and Swift. The broad-band X-ray continuum is typical of a black hole binary in the bright hard state, with a photon index of and a low coronal temperature of keV, corresponding to a low spectral cutoff well constrained by NuSTAR. Spectral modeling of the relativistic disk reflection features, consisting of a broad Fe K line and the Compton reflection hump, reveals that the black hole is rapidly spinning with the spin parameter of , and the inner accretion disk is viewed at a high inclination angle of (statistical errors, 90% confidence). The high inclination is independently confirmed by dips in the light curves, which can be explained by absorbing material located near the disk plane temporarily obscuring the central region. In addition, we detect an absorption line in the NuSTAR spectra centered at keV. If associated with ionized Fe K absorption lines, this provides evidence for the presence of outflowing material in the low/hard state of a black hole binary candidate. A timing analysis shows the presence of a type-C QPO in the power spectrum, with the frequency increasing from Hz to Hz during the single NuSTAR exposure. Our analysis reveals that Swift J1658.2–4242 displays characteristics typical for a black hole binary that is viewed at a high inclination angle, making it a good system for studying the accretion geometry in black hole binaries.
Subject headings:
accretion, accretion disks X-rays: binaries X-rays: individual (Swift J1658.2–4242)1. INTRODUCTION
Most Galactic black hole binaries are discovered as X-ray transients that go into recurrent outbursts. During a typical outburst, a black hole binary transitions from the low/hard state (power-law component dominates the energy spectrum with a hard photon index) to the high/soft state (thermal disk component dominates) as the source flux increases (see Remillard & McClintock, 2006, for a review). The changes in the spectral shape are believed to be associated with the evolution of the accretion geometry. One hypothesis that has been widely explored is that the inner disk extends to the innermost stable circular orbit (ISCO) in the soft state, whereas is truncated at a larger radius in the hard state (e.g., Esin et al., 1997; Done et al., 2007). However, it has been suggested from observations that the inner disk extends down to the ISCO in the hard state of black hole binaries in several cases (e.g., Miller et al., 2002, 2006). Whether the accretion disk is truncated can be determined by measuring the degree of relativistic distortion of the Fe K emission line, which comes from reflection of the central emission by the inner accretion disk (e.g., Fabian et al., 1989). Recently, NuSTAR observations of several black hole binaries in the bright hard state revealed very broad Fe K lines (Miller et al., 2015b; El-Batal et al., 2016; Xu et al., 2018b). As NuSTAR spectra are free from pile-up distortions even at high count rates typical of Galactic X-ray binaries, these results clearly challenge the disk truncation interpretation of the hard state.
Mass outflows are important phenomena in the study of accretion processes. Equatorial disk winds, identified by narrow absorption lines from highly ionized iron (mostly Fe XXV and Fe XXVI), have been observed in a number of black hole binaries in the soft state, and are more likely to be observed in high inclination systems (e.g., Neilsen & Lee, 2009; King et al., 2014; Miller et al., 2015a). Detailed studies of several well-known black hole binaries indicate that the presence of accretion disk winds appears to be anti-correlated with relativistic jets (e.g., Neilsen & Lee, 2009; Miller et al., 2012). The disk wind is thought to be responsible for carrying away a considerable amount of kinetic energy when the jet switches off in the high/soft state. During typical low/hard states when the source Eddington ratio is relatively low, however, collimated radio jets are ubiquitous, and disk wind features are either absent or at least much weaker, thus making the detection difficult (e.g., Ponti et al., 2012; Miller et al., 2012).
Swift J1658.2–4242 is a newly discovered X-ray transient in the Galactic plane. The first reported detection was made by Swift/BAT (Krimm et al., 2013) on February 16, 2018. The source was detected by INTEGRAL during its observations of the Galactic center field on February 13, 2018, with a spectral hardness typical for black hole binaries in the hard state (Grebenev et al., 2018; Grinberg et al., 2018). Subsequent radio observations by ATCA imply that the source is a black hole binary at a distance of greater than 3 kpc (Russell et al., 2018). Low frequency quasi-periodic oscillations (QPOs) increasing in frequency were detected by NuSTAR (Xu et al., 2018a) and AstroSAT (Beri et al., 2018). X-ray spectra from Swift/XRT reveal that the source is highly absorbed, with an absorption column density of cm-2 (Lien et al., 2018). In addition, several dips were observed from initial analysis of the NuSTAR data (Xu et al., 2018a), similar to those detected in known dipping low-mass X-ray binaries (LMXBs) (e.g., Tomsick et al., 1998; Díaz Trigo et al., 2009; Kuulkers et al., 2013). Dips in the light curves of black hole and neutron star binaries are signatures of high inclination (). They are thought to originate from obscuring material located at the thick outer region of the accretion disk in LMXBs (White & Swank, 1982; Frank et al., 1987); while in HMXBs, dips can be explained by obscuration by the stellar wind from the donor star.
In this paper, we present a spectral and timing analysis of the newly discovered black hole binary candidate Swift J1658.2–4242, using simultaneous NuSTAR and Swift observations that caught the source in the hard state. The paper is structured as follows: in Section 2, we describe the observations and the data reduction details; we present the results of our spectral modeling and timing analysis in Section 3, 4 and 5, and discuss the results in Section 6.
2. OBSERVATIONS AND DATA REDUCTION
Swift J1658.2–4242 was observed by NuSTAR (Harrison et al., 2013) on February 16, 2018 starting at 23:26:09 UT for an exposure of 33.3 ks per module (OBSID: 90401307002). The observation was approved through DDT time, and was taken on the same day that the outburst was first reported. We reduced the NuSTAR data following standard procedure using NuSTARDAS pipeline v.1.6.0 and CALDB v20170817. The source spectra were extracted from a circular region with the radius of 150 from the two NuSTAR focal plane modules (FPMA and FPMB). Corresponding background spectra were extracted using polygonal regions from source-free areas in the detectors. We also extracted spectra from mode 6 data following the procedures described in Walton et al. (2016), which yielded an extra 3.6 ks of data when an aspect solution was not available from the on board star tracker CHU4. We grouped the NuSTAR spectra with a signal-to-noise ratio (S/N) of 20 per energy bin.
The outburst of Swift J1658.2–4242 was monitored by Swift/XRT (Burrows et al., 2005). The XRT observation (OBSID: 00810300002) overlapping with the NuSTAR observation used in this paper was taken in the Windowed Timing (WT) mode to avoid photon pile-up. The XRT observation was taken around the middle of the NuSTAR exposure, starting from 10:38:52 UT to 16:43:57 UT on February 17, 2018. We reduced the the Swift/XRT data using xrtpipeline v.0.13.2 with CALDB v20171113. We extracted the source spectrum from a circular region with the radius of 70, and the background was extracted from an annulus area with the inner and outer radii of 200 and 300, respectively. After standard data filtering, the total exposure time is 3.9 ks. The XRT spectrum was rebinned to have at a S/N of of least 5 per bin.
3. LIGHT CURVES
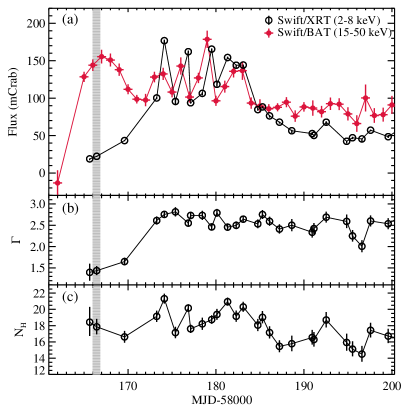
Evolution of the flux of Swift J1658.2–4242 since the beginning of the outburst observed by Swift/XRT and BAT is shown in Figure 1. The Swift/BAT light curve in daily averaged flux is from the Swift/BAT transient monitor (Krimm et al., 2013). Swift/XRT data were reduced following the procedures described in Section 2, and the XRT flux was calculated by fitting the spectra with an absorbed power-law model, TBabs*powerlaw. In this work, we perform all spectral fitting using XSPEC v12.9.0n (Arnaud, 1996) with statistics, and adopt the cross-sections from Verner et al. (1996) and abundances from Wilms et al. (2000). All parameter uncertainties are reported at the 90% confidence level for one parameter of interest unless otherwise clarified. As shown in Figure 1b, the NuSTAR observation caught Swift J1658.2–4242 in the hard state before significant spectral softening occurred.
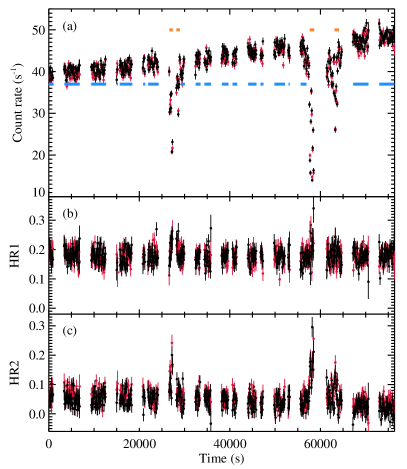
Three dips are evident in the NuSTAR light curve generated by the standard NUPRODUCTS procedure, where the NuSTAR full band count rate decreased by at the dip minima (see Figure 2a). Dipping has been found to be periodic in the black hole binaries GRO J1655–40 and MAXI J1659–152, and are associated with the binary orbital period in these systems (Kuulkers et al., 1998, 2013). It is possible that the dips observed in Swift J1658.2–4242 are also periodic, but cannot be confirmed with the limited exposure time of our NuSTAR observation. We extract source light curves from three energy intervals, 3–6 keV (), 6–10 keV (), 10–79 keV (), and calculate hardness ratios defined as and . The dips are clearly detected in all three energy bands. The hardness ratios are found to increase during the dips (see Figure 2b,c), indicating the dips are caused by increased absorption along the line of sight.
The source count rate was rising linearly during the NuSTAR observation. Despite the increase in count rate, the hardness ratio, HR1, basically remains constant outside of the dips. The overall change in HR2 is also relatively small (decreased by by the end of the exposure), which in this case is mainly due to the change in the high energy cutoff. The cutoff energy, , in black hole binaries has been observed to decrease monotonically with the increasing flux during the rising phases of their hard states (e.g., Joinet et al., 2008; Motta et al., 2009). We note here the corresponding changes in the absolute values of spectral parameters are subtle. Therefore, for spectral modeling, we only consider time-averaged spectra and separate the total exposure by dipping and non-dipping phases.
4. SPECTRAL ANALYSIS
4.1. Persistent spectra
We first consider time-averaged spectra excluding the dips, which we refer to as the persistent spectra henceforth. Although the exposure of Swift/XRT is much shorter than that of the NuSTAR observation, Swift caught the second dip observed by NuSTAR, which we also excluded from the XRT data when extracting the persistent spectrum. The accumulated times for the persistent spectra are 30.9 ks, 31.4 ks and 3.6 ks for NuSTAR/FPMA, NuSTAR/FPMB and Swift/XRT, respectively.
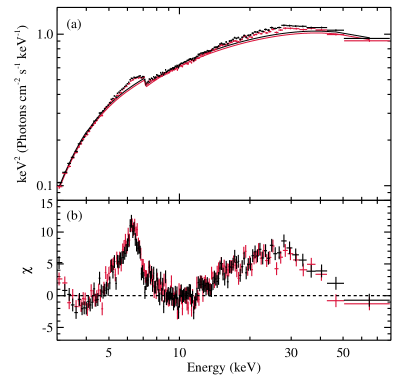
Relativistic reflection features are clearly detected in the NuSTAR spectra, including a broad Fe K line and a Compton reflection hump peaking around 30 keV (see Figure 3). To highlight the disk reflection features, we first fit the NuSTAR spectra with an absorbed cutoff power-law model: TBnew*cutoffpl, in XSPEC notation, only considering the energy intervals of 3–5, 8–12, and 40–79 keV. We note that in the residual plot, there is some indication for an absorption line around 7 keV (see Figure 3b), near the absorption edge. Throughout this work, we use the TBnew111http://pulsar.sternwarte.uni-erlangen.de/wilms/research/tbabs/ model to account for neutral absorption, and fix all abundances at solar in TBnew. This updated version of the TBabs model better characterises the shape of the absorption edges, which could be relevant here as the source has a high absorption column density. This approximate fit requires an absorption column density of cm-2, a photon index of , and a relatively low cutoff energy of keV.
To obtain broad-band X-ray coverage so that spectral parameters can be better constrained, we jointly fit the NuSTAR and the Swift/XRT spectra. We allow the cross-normalization constants to vary freely for NuSTAR/FPMB and Swift/XRT, and fix the value at unity for NuSTAR/FPMA. We use XRT data above 1 keV, as low energy spectral residuals have been reported in heavily absorbed sources observed in the WT mode222http://www.swift.ac.uk/analysis/xrt/digest_cal.php. Also NuSTAR data below 4 keV are ignored during the spectral fitting to avoid possible calibration uncertainties near the low energy end of the band pass. We use the model relxilllpCp in the relxill model family (Dauser et al., 2014; García et al., 2014) to physically model the relativistic reflection spectra. The relxilllpCp model uses an idealized lamp-post geometry for the illuminating source commonly referred to as the corona. In this model, the corona is approximated as a point source located on the spin axis of the black hole above the accretion disk. The reflection fraction, , can be self-consistently calculated in the lamp-post model based on the geometry assumed, which helps to reduce the parameter space. It uses the thermal Comptonization model nthcomp (Zdziarski et al., 1996; Życki et al., 1999) as the input continuum, which provides a generally different spectral curvature from the phenomenological cutoffpl model, especially in the case of a low high-energy cutoff. For all spectral fitting with relxilllpCp, we fix the outer radius of the accretion disk at 400 ( is the gravitational radius), and set the value of reflection fraction to be self-consistently determined by the model given the combination of the black hole spin parameter , the inner radius of the accretion disk and the lamp-post height . The inner disk radius and the black hole spin parameter are degenerate, as they both control the effective inner accretion disk radius. Therefore, for simplicity, during the spectral fitting we assume that the inner disk extends down to the ISCO by fixing at the radius of the ISCO, and fit for the black hole spin as a free parameter (see Section 6 for a discussion about disk truncation).
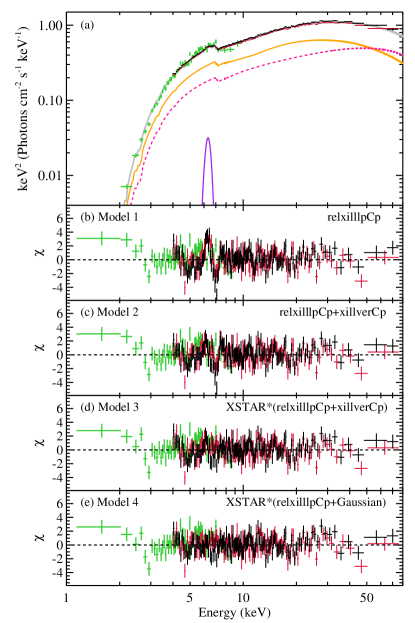
It is clear disk reflection alone TBabs*relxilllpCp (Model 1) is not sufficient to describe the data (reduced chi-squared , where is the number of degrees of freedom). Secondary features including a narrow iron line and possible absorption around 7 keV can be seen in the residual plot (see Figure 4b). A narrow iron line component on top of the broad Fe K profile has been found in a number of black hole binaries observed by NuSTAR (e.g., Walton et al., 2016, 2017; Xu et al., 2018b; Tomsick et al., 2018), although the narrow line complex cannot be spectrally resolved. The origin of this spectral component is still controversial. Possible scenarios generally considered include distant reflection by a flared disk, line emission from the stellar wind of the donor star, or re-emission from an accretion disk wind if detected along with absorption features. We first tentatively fit for this feature using an unblurred reflection model xillverCp (García & Kallman, 2010) to account for possible contribution from distant reflection, with the total model setup as TBabs*(relxilllpCp+xillverCp) (Model 2). We assume the narrow iron line to be neutral by setting the ionization parameter in xillverCp as log (, where is the ionizing flux, and is the gas density). We link other parameters in xillverCp with the corresponding parameters in relxilllpCp, only allowing the normalization of xillverCp to vary freely. This results in an improvement of with one additional free parameter (). Modeling the narrow iron line with relxilllpCp instead results in a similar fit, and it yields a lower limit on the distance of the distant reflection component (), which is far enough from the black hole to justify its low ionization state.
An apparent absorption line is still evident in the residuals of Model 2 (see Figure 4c). Fitting this feature with a simple Gaussian absorption line model brings an improvement of to the fit with three more parameters. It reveals that the line centroid lies at keV, with an equivalent width (EW) of eV. The absorption line is significantly detected at 7.5 confidence via a simple F-test. Strong absorption features from highly ionized iron are unusual for black hole binaries in the low/hard state, as they are considered as signatures of a powerful disk wind. Complications arise from the fact that the apparent absorption line is right at the Fe K edge. Assuming this is indeed an iron absorption line originating from a disk wind, if associated with blueshifted He-like Fe XXV (6.70 keV), it requires an extreme outflowing velocity of (14800 km s-1); alternatively, if this is identified with the more ionized H-like Fe XXVI (6.97 keV), it corresponds to a lower velocity of (2600 km s-1), but is still a high outflowing velocity for a disk wind launched by a stellar-mass black hole (e.g., Neilsen & Lee, 2009; Miller et al., 2015a). However, we note that in the latter case, the velocity shift could only be marginal when taking into account the absolute energy calibration uncertainty of NuSTAR (Madsen et al., 2015).
| Component | Parameter | Persistent (Model 3) | Persistent (Model 4) | Dipping (Model 5) |
|---|---|---|---|---|
| tbnew | () | – | ||
| parcov*(tbnew*cabs) | () | |||
| xstar | () | – | ||
| log () (log []) | – | |||
| – | ||||
| relxilllpCp | () | – | ||
| () | – | |||
| (∘) | – | |||
| – | ||||
| log () (log []) | – | |||
| (solar) | – | |||
| (keV) | – | |||
| 2.19 | 3.25 | – | ||
| Norm () | – | |||
| gaussian | (keV) | – | ||
| (keV) | – | |||
| Norm (10-4) | – | |||
| xillverCp | Norm (10-2) | – | ||
| 1650.0/1595 | 1625.7/1593 | 307.6/287 |
Note. — There is no error estimation for the reflection fraction parameter, , as it is self-consistently calculated by the model in the lamp-post geometry. In model 5, we add one extra absorption component, parcov*(TBnew*cabs), to Model 4 in order to fit the dip spectra. Corresponding parameters in Model 5 are fixed at the best-fit values from Model 4.
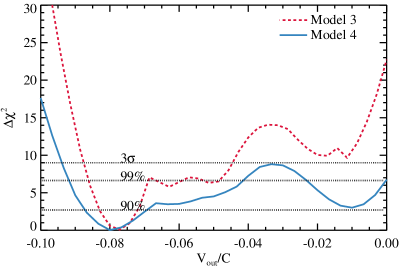
In order to obtain a more physical interpretation, we fit for the absorption feature with an XSTAR table model (Kallman & Bautista, 2001): the full model is setup as TBabs*XSTAR*(relxilllpCp+xillverCp) (Model 3). The XSTAR photoionization grid is customized for the hard state of Swift J1658.2–4242 using a power-law input spectrum with the photon index of . We also assumed a gas density of cm-3 following Miller et al. (2015a), a turbulent velocity of 1000 km s-1 and a source luminosity of erg s-1. The grid covers the parameter space of , and , with the velocity shift as a free parameter. We link the iron abundance of the XSTAR model (in solar units), , with that of the disk reflection component. The XSTAR model successfully accounts for the absorption feature with an ionization parameter of , and a very high outflowing velocity shift of km s. We stress that obtaining an unique constraint on the ionization parameter and the velocity shift simultaneously is difficult here. Since only one absorption line can been clearly seen in the Fe K band, the ionization parameter and the velocity shift of the XSTAR grid are degenerate. At confidence level, a velocity of at (3300 km s-1) can still be considered as marginally acceptable (see Figure 5 for the constraint on ). It indicates that associating the absorption feature with more highly ionized Fe K species cannot be completely ruled out. The heavily absorbed nature of the source plus the short XRT exposure time precludes the possibility of detecting corresponding absorption lines in the soft end of the spectra. Model 3 provides an overall satisfying fit of the spectra, the results indicate that the source is a rapidly spinning black hole with the spin parameter of , and is viewed at a high inclination angle of .
In an attempt to further improve the fit, we replace the xillverCp component with a simple Gaussian emission line model (Model 4), since there is no clear indication that the narrow core of the Fe K profile arises from reflection. This results in a better fit by , with the difference mainly lying at the red wing of the narrow iron line around 6 keV (see Figure 4). The inclusion of an extra disk blackbody component (diskbb) is not statistically required by the data. As the spectra display no obvious bump-like feature at low energies, most likely due to the high absorption column density, the strength or the temperature of the thermal disk emission cannot be well constrained. Although thermal emission from the inner accretion disk is physically required to explain a non-truncated disk, including a diskbb model does not significantly affect the determination of other parameters during the spectral modeling. Therefore, we consider Model 4 as our best-fit model for the persistent broad-band X-ray spectra of Swift J1658.2–4242.
Broadly similar results are obtained with Model 4: a low coronal height of and a high spin of , which lead to a high reflection fraction of calculated self-consistently by the model, signaling strong light-bending effects at the vicinity of the black hole. A high inclination angle of is measured for the inner accretion disk, which is sensitive to the blue wing of the broad iron line. Similar results are obtained if is left to vary freely, and an equally high black hole spin is measured, indicating that the high reflection fraction is indeed required by the data. We note that consistent results are obtained if we replace the lamp-post model used here (relxilllpCp) with the model assuming a broken power-law coronal emissivity profile (relxillCp); the best-fit values of the key physical parameters (black hole spin, disk ionization and inclination) are all consistent within errors. The constraint on the velocity shift of the XSTAR absorption component with Model 4 is weaker compared to that with Model 3. By allowing both line the width and centroid to vary in the Gaussian emission line model, more flexibilities are brought to the spectral modeling near the Fe K edge. However, Model 4 still statistically prefers a considerably large outflowing velocity for the ionized absorber (see Figure 5). The most noticeable difference between Model 4 and 3 is the iron abundance and the photon index (see Table 1 for the list of spectral modeling parameters). is driven by the relative flux in the Fe K band and of the Compton hump. Different from the distant reflection model, the narrow iron line component in Model 4 does not contribute to the flux in the high energy band ( keV). This would cause a small change in the overall spectral shape, resulting in corresponding changes in and .
The fit confirms that the source is highly absorbed. The best-fit neutral absorption column density, cm-2, is consistent with the measurement reported from initial analysis of the Swift/XRT data ( cm-2, Lien et al. (2018)). This value is well in excess of the expected Galactic absorption in the direction of Swift J1658.2–4242, cm-2 (Kalberla et al., 2005). Therefore, the extra absorption is intrinsic to the source, and mostly likely originates from obscuring material near the orbital plane of the system. The parameters of the nthcomp continuum are well constrained: a power-law index of , indicating the source is in the hard state; and a relatively low coronal temperature of keV (the value here is as observed, not corrected for gravitational redshift at the vicinity of the black hole), which is determined by the exponential cutoff at the high energy end of the spectrum. Similar low coronal temperatures or equivalently low high-energy cutoffs have been previously measured by NuSTAR in black hole binaries during their bright hard states (e.g., Miller et al., 2013, 2015b; Xu et al., 2018b).
4.2. Dip spectra
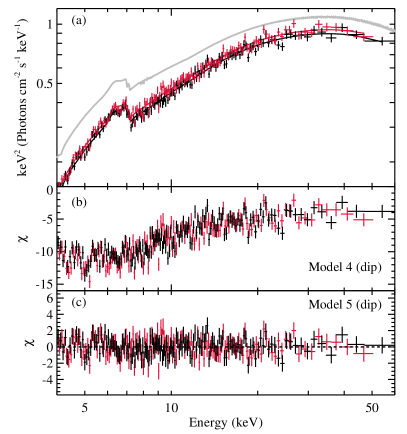
We extracted the spectra of the three dips collectively to obtain the highest S/N data possible for spectral fitting. The dipping intervals were selected as the periods when the source count rate clearly deviates from the linearly increasing trend (see Figure 2 for details). This results in an exposure time of 3.0 ks and 3.3 ks for FPMA and FPMB, respectively. To highlight the spectral difference during the dips, we plot the residuals of the dipping spectra when compared to the best-fit model for the persistent spectra (Model 4) in Figure 6b. It is clear that dip spectra is harder, especially below 10 keV, suggesting that the spectral change is caused by absorption.
An increase in the neutral absorption column density and changes in photon-ionized absorbers are usually invoked to explain spectral change during dipping intervals (e.g., Díaz Trigo et al., 2006; Shidatsu et al., 2013). Evidence have also been found for progressive covering of the accretion disk corona as the dip progresses, during which the covering factor of the absorber was measured to increase, approaching the maximum value at the dip minimum (e.g., Smale et al., 2002; Church & Bałucińska-Church, 2004). Our best-fit model for the dip spectra adds one extra partial covering neutral absorber to the persistent spectral model (Model 4). During the dips, electron scattering by the absorber could reduce the Comptonized emission from the corona, producing a nearly energy independent decrease in intensity (e.g., Parmar et al., 1986; Smale et al., 2002). Therefore, we also include a cabs model to account for the effects of absorbing material scattering X-ray photons away from the line of sight, and link the absorption column density in the cabs model with that of the partial covering absorber. The full model setup is TBnew*(partcov*(TBnew*cabs))*XSTAR* (relxilllpCp+Gaussian) (Model 5). Corresponding parameters in Model 5 are fixed at the best-fit values from Model 4, with only two parameters left to vary freely. The dip spectra can be adequately modeled after including the extra absorption component (, with no obvious residuals in Figure 6c). The best fit requires a neutral absorber with the absorption column density of cm2 and a partial covering factor of . The fit confirms that the spectral changes during the dips can be fully accounted for by photoelectric absorption and Compton scattering from an additional neutral absorber.
5. LOW-FREQUENCY QPO
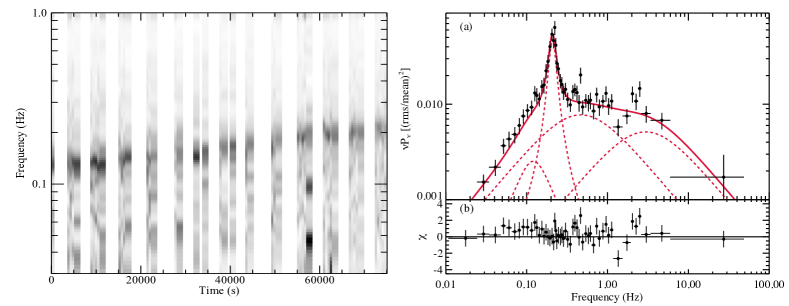
For NuSTAR timing analysis, we first applied barycenter correction to the event files, transferring the photon arrival times to the barycenter of the solar system using JPL Planetary Ephemeris DE-200. The cross-power density spectra (CPDS) were generated using MaLTPyNT (Bachetti, 2015) following the standard procedure. CPDS measures the signals in phase between the two NuSTAR modules (FPMA and FPMB), which helps to reduce dead time distortions to the power density spectra (Bachetti et al., 2015). We selected a light curve binning of 2-8 s and calculated the CPDS in 512 s intervals. The power spectra were generated using the root-mean-square (rms) normalization, and were geometrically rebinned by a factor of 1.03 to reach nearly equally spaced frequency bins in the logarithmic scale.
A low-frequency QPO is clearly detected by NuSTAR. The QPO frequency steadily increased from Hz to Hz during the NuSTAR exposure, as shown in the dynamical power spectrum (Figure 7, left panel). We extract an example CPDS from only the last two orbits, and fit it in XSPEC with a unity response file. We use a multi-Lorentzian model, which is commonly used to fit the power spectra of black hole binaries (e.g., Nowak, 2000). Our model for the power density spectrum includes four Lorentz functions: two Lorentzians with the centroid frequency fixed at zero to fit for the underlying continuum; one Lorentzian for the QPO, and one for the possible sub-harmonic with the frequency linked with half the fundamental QPO frequency. The sample power spectrum can be adequately fitted with no obvious structure left in the residuals, (see Figure 7, right panel). The QPO peak averaged over the last two orbits can be well constrained to be at the frequency of Hz, with a Q-value of and a fractional rms amplitude of . The low QPO frequency, the increasing trend of the centroid frequency with the rising source flux, and the underlying noise continuum in the power density spectrum are consistent with type-C QPOs during hard states of black hole binary outbursts (Wijnands & van der Klis, 1999; Casella et al., 2004, 2005).
6. DISCUSSION
In this work, we performed an X-ray spectral and timing analysis of the recently discovered X-ray transient Swift J1658.2–4242, using data from joint NuSTAR and Swift observations. The shape of the broad-band X-ray spectral continuum and the detection of a low-frequency QPO is similar to the properties of black hole binary in the hard state. Given that no coherent pulsation or type I X-ray burst is detected, this suggests the source is a strong black hole binary candidate. From spectral modeling, the highly absorbed nature of Swift J1658.2–4242 is confirmed, with the neutral absorption column density well measured as cm -2. The hard photon index of and the simultaneous detection of a jet in the radio band (Russell et al., 2018) suggests Swift J1658.2–4242 was in the hard state when the observations were taken. It was most likely in the bright phase of the hard state, as the source was reported to enter the hard-intermediate state four days later (Beri et al., 2018). The averaged non-dip flux is about mCrab in the 2–10 keV band during the NuSTAR exposure, and the absorption corrected source luminosity is erg s-1. Currently, the distance, , to Swift J1658.2–4242 is unknown and the high absorption in the ISM along the line of sight makes it difficult to identify the optical counterpart.
Strong disk reflection features are shown in the NuSTAR spectra. Modeling the reflection features with the self-consistent disk reflection model relxilllpCp indicates that the central black hole is rapidly spinning with the spin parameter of , and the inner disk is viewed at a high inclination angle of . The inclination angle measured is consistent with that fact that absorption dips are detected in the light curves.
During spectral modeling of the reflection spectra in Section 5, we made the assumption that the inner accretion disk extends to the ISCO, which is not necessary true considering the possibility of a truncated disk in the hard state. The black hole spin and the inner disk radius are essentially degenerate parameters. The spin parameter is determined by measuring the location of the ISCO, which decreases monotonically from 9 for an extremely retrograde spinning black hole to 1.235 for a black hole with a maximum positive spin. Therefore, by assuming the disk extends to the ISCO rather than being truncated, we would be conservatively fitting for a lower limit of the black hole spin. Likewise, a high black hole spin obtained this way rules out the possibility of significant disk truncation. If we fix the spin parameter at the maximum value of and instead fit for , the best-fit value for the inner disk radius is , with other parameters remaining at basically identical values. And solutions with can be ruled out at a 5 confidence level.
A nearly maximal spin and the lack of significant disk truncation further support the hypothesis that Swift J1658.2–4242 contains a black hole primary. In the case of neutron stars, the Schwarzschild metric is normally a good approximation, and the neutron star spin parameter is expected to be less than 0.3 (e.g., Galloway et al., 2008). Also in neutron stars the disk must be truncated either at the surface of the star or at its magnetospheric radius, with the typical measured truncation radius as (e.g., Cackett et al., 2010; Miller et al., 2013; Ludlam et al., 2017), which significantly exceeds the constraint on the inner disk radius we obtained for Swift J1658.2–4242. The origin of QPOs in black hole binaries is still unclear despite being studied for decades. The lack of disk truncation plus the simultaneous detection of a type-C QPO in the hard state of a black hole binary candidate by NuSTAR is in tension with the Lense-Thirring precession model for QPOs, one of the currently promising physical models to explain the origin of low-frequency QPOs, as in the Lense-Thirring precession model the inner accretion disk is generally required to be truncated (Stella & Vietri, 1998; Stella et al., 1999; Ingram et al., 2009).
An apparent absorption line is detected in the Fe K band centered at keV. If associated with ionized iron absorption, this implies the unusual presence of a disk wind in the hard state of a black hole binary. As only one absorption feature is clearly detected, the velocity shift and the ionization state of the absorber cannot be unambiguously determined, similar to the case of 4U 1630–472 discussed in King et al. (2014). The best fit favors a lower ionization state and a very high outflowing velocity, comparable to the extreme wind velocity reported in the black hole binary candidate IGR J17091–3624 (King et al., 2012). In the case of an extreme disk wind, the relatively narrow Fe K emission line component required in the spectral modeling could be a part of a P-Cygni profile, arising from redshifted ionized iron line emission in the wind. However, we stress that an alternative solution of a higher ionization and moderate outflowing velocity cannot be rule out from the spectral analysis, where the velocity shift of the ionized absorber is actually close to the absolute energy calibration uncertainty of NuSTAR. Swift J1658.2–4242 is an interesting source for studying the equatorial disk winds in binary systems. Future observations with high spectral resolution would be helpful to resolve this uncertainty.
References
- Arnaud (1996) Arnaud, K. A. 1996, in Astronomical Society of the Pacific Conference Series, Vol. 101, Astronomical Data Analysis Software and Systems V, ed. G. H. Jacoby & J. Barnes, 17
- Bachetti (2015) Bachetti, M. 2015, MaLTPyNT: Quick look timing analysis for NuSTAR data, Astrophysics Source Code Library, ascl:1502.021
- Bachetti et al. (2015) Bachetti, M., Harrison, F. A., Cook, R., et al. 2015, ApJ, 800, 109
- Beri et al. (2018) Beri, A., Belloni, T., Vincentelli, F., Gandhi, P., & Altamirano, D. 2018, The Astronomer’s Telegram, 11375
- Burrows et al. (2005) Burrows, D. N., Hill, J. E., Nousek, J. A., et al. 2005, Space Sci. Rev., 120, 165
- Cackett et al. (2010) Cackett, E. M., Miller, J. M., Ballantyne, D. R., et al. 2010, ApJ, 720, 205
- Casella et al. (2004) Casella, P., Belloni, T., Homan, J., & Stella, L. 2004, A&A, 426, 587
- Casella et al. (2005) Casella, P., Belloni, T., & Stella, L. 2005, ApJ, 629, 403
- Church & Bałucińska-Church (2004) Church, M. J., & Bałucińska-Church, M. 2004, MNRAS, 348, 955
- Dauser et al. (2014) Dauser, T., García, J., Parker, M. L., Fabian, A. C., & Wilms, J. 2014, MNRAS, 444, L100
- Díaz Trigo et al. (2006) Díaz Trigo, M., Parmar, A. N., Boirin, L., Méndez, M., & Kaastra, J. S. 2006, A&A, 445, 179
- Díaz Trigo et al. (2009) Díaz Trigo, M., Parmar, A. N., Boirin, L., et al. 2009, A&A, 493, 145
- Done et al. (2007) Done, C., Gierliński, M., & Kubota, A. 2007, A&A Rev., 15, 1
- El-Batal et al. (2016) El-Batal, A. M., Miller, J. M., Reynolds, M. T., et al. 2016, ApJ, 826, L12
- Esin et al. (1997) Esin, A. A., McClintock, J. E., & Narayan, R. 1997, ApJ, 489, 865
- Fabian et al. (1989) Fabian, A. C., Rees, M. J., Stella, L., & White, N. E. 1989, MNRAS, 238, 729
- Frank et al. (1987) Frank, J., King, A. R., & Lasota, J. P. 1987, A&A, 178, 137
- Galloway et al. (2008) Galloway, D. K., Muno, M. P., Hartman, J. M., Psaltis, D., & Chakrabarty, D. 2008, ApJS, 179, 360
- García & Kallman (2010) García, J., & Kallman, T. R. 2010, ApJ, 718, 695
- García et al. (2014) García, J. A., Dauser, T., Lohfink, A., et al. 2014, ApJ, 782, 76
- Grebenev et al. (2018) Grebenev, S. A., Mereminskiy, I. A., Prosvetov, A. V., et al. 2018, The Astronomer’s Telegram, 11306
- Grinberg et al. (2018) Grinberg, V., Eikmann, W., Kreykenbohm, I., & Wilms, J. 2018, The Astronomer’s Telegram, 11318
- Harrison et al. (2013) Harrison, F. A., Craig, W. W., Christensen, F. E., et al. 2013, ApJ, 770, 103
- Ingram et al. (2009) Ingram, A., Done, C., & Fragile, P. C. 2009, MNRAS, 397, L101
- Joinet et al. (2008) Joinet, A., Kalemci, E., & Senziani, F. 2008, ApJ, 679
- Kalberla et al. (2005) Kalberla, P. M. W., Burton, W. B., Hartmann, D., et al. 2005, A&A, 440, 775
- Kallman & Bautista (2001) Kallman, T., & Bautista, M. 2001, The Astrophysical Journal Supplement Series, 133, 221
- King et al. (2012) King, A. L., Miller, J. M., Raymond, J., et al. 2012, ApJ, 746, L20
- King et al. (2014) King, A. L., Walton, D. J., Miller, J. M., et al. 2014, ApJ, 784
- Krimm et al. (2013) Krimm, H. A., Holland, S. T., Corbet, R. H. D., et al. 2013, ApJS, 209, 14
- Kuulkers et al. (1998) Kuulkers, E., Wijnands, R., Belloni, T., et al. 1998, ApJ, 494, 753
- Kuulkers et al. (2013) Kuulkers, E., Kouveliotou, C., Belloni, T., et al. 2013, A&A, 552, A32
- Lien et al. (2018) Lien, A. Y., Kennea, J. A., Barthelmy, S. D., et al. 2018, The Astronomer’s Telegram, 11310
- Ludlam et al. (2017) Ludlam, R. M., Miller, J. M., Bachetti, M., et al. 2017, ApJ, 836, 140
- Madsen et al. (2015) Madsen, K. K., Harrison, F. A., Markwardt, C. B., et al. 2015, The Astrophysical Journal Supplement Series, 220, 8
- Miller et al. (2015a) Miller, J. M., Fabian, A. C., Kaastra, J., et al. 2015a, ApJ, 814
- Miller et al. (2006) Miller, J. M., Homan, J., Steeghs, D., et al. 2006, ApJ, 653, 525
- Miller et al. (2002) Miller, J. M., Fabian, A. C., Wijnands, R., et al. 2002, ApJ, 570, L69
- Miller et al. (2012) Miller, J. M., Raymond, J., Fabian, A. C., et al. 2012, ApJ, 759
- Miller et al. (2013) Miller, J. M., Parker, M. L., Fuerst, F., et al. 2013, ApJ, 775, L45
- Miller et al. (2015b) Miller, J. M., Tomsick, J. A., Bachetti, M., et al. 2015b, ApJ, 799, L6
- Motta et al. (2009) Motta, S., Belloni, T., & Homan, J. 2009, MNRAS, 400, 1603
- Neilsen & Lee (2009) Neilsen, J., & Lee, J. C. 2009, Nature, 458, 481
- Nowak (2000) Nowak, M. A. 2000, Monthly Notices of the Royal Astronomical Society, 318, 361
- Parmar et al. (1986) Parmar, A. N., White, N. E., Giommi, P., & Gottwald, M. 1986, ApJ, 308, 199
- Ponti et al. (2012) Ponti, G., Fender, R. P., Begelman, M. C., et al. 2012, MNRAS, 422, L11
- Remillard & McClintock (2006) Remillard, R. A., & McClintock, J. E. 2006, ARA&A, 44, 49
- Russell et al. (2018) Russell, T. D., Miller-Jones, J. C. A., Sivakoff, G. R., & Tetarenko, A. J. 2018, The Astronomer’s Telegram, 11322
- Shidatsu et al. (2013) Shidatsu, M., Ueda, Y., Nakahira, S., et al. 2013, ApJ, 779
- Smale et al. (2002) Smale, A. P., Church, M. J., & Bałucińska-Church, M. 2002, ApJ, 581, 1286
- Stella & Vietri (1998) Stella, L., & Vietri, M. 1998, ApJ, 492, L59
- Stella et al. (1999) Stella, L., Vietri, M., & Morsink, S. M. 1999, ApJ, 524, L63
- Tomsick et al. (1998) Tomsick, J. A., Lapshov, I., & Kaaret, P. 1998, ApJ, 494, 747
- Tomsick et al. (2018) Tomsick, J. A., Parker, M. L., García, J. A., et al. 2018, ApJ, 855
- Verner et al. (1996) Verner, D. A., Ferland, G. J., Korista, K. T., & Yakovlev, D. G. 1996, ApJ, 465, 487
- Walton et al. (2016) Walton, D. J., Tomsick, J. A., Madsen, K. K., et al. 2016, ApJ, 826, 87
- Walton et al. (2017) Walton, D. J., Mooley, K., King, A. L., et al. 2017, ApJ, 839
- White & Swank (1982) White, N. E., & Swank, J. H. 1982, ApJ, 253, L61
- Wijnands & van der Klis (1999) Wijnands, R., & van der Klis, M. 1999, ApJ, 514, 939
- Wilms et al. (2000) Wilms, J., Allen, A., & McCray, R. 2000, ApJ, 542, 914
- Xu et al. (2018a) Xu, Y., Kennea, J. A., Harrison, F. A., & Forster, K. 2018a, The Astronomer’s Telegram, 11321
- Xu et al. (2018b) Xu, Y., Harrison, F. A., García, J. A., et al. 2018b, ApJ, 852, L34
- Zdziarski et al. (1996) Zdziarski, A. A., Johnson, W. N., & Magdziarz, P. 1996, MNRAS, 283, 193
- Życki et al. (1999) Życki, P. T., Done, C., & Smith, D. A. 1999, MNRAS, 309, 561