Frustration of square cupola in Sr(TiO)Cu4(PO4)4
Abstract
The structural and magnetic properties of the square-cupola antiferromagnet Sr(TiO)Cu4(PO4)4 are investigated via x-ray diffraction, magnetization, heat capacity, and 31P nuclear magnetic resonance experiments on polycrystalline samples, as well as density-functional band-structure calculations. The temperature-dependent unit cell volume could be described well using the Debye approximation with the Debye temperature of 550 K. Magnetic response reveals a pronounced two-dimensionality with a magnetic long-range-order below K. High-field magnetization exhibits a kink at of the saturation magnetization. Asymmetric 31P NMR spectra clearly suggest strong in-plane anisotropy in the magnetic susceptibility, as anticipated from the crystal structure. From the 31P NMR shift vs bulk susceptibility plot, the isotropic and axial parts of the hyperfine coupling between 31P nuclei and the Cu2+ spins are calculated to be and Oe/, respectively. The low-temperature and low-field 31P NMR spectra indicate a commensurate antiferromagnetic ordering. Frustrated nature of the compound is inferred from the temperature-dependent 31P NMR spin-lattice relaxation rate and confirmed by our microscopic analysis that reveals strong frustration of the square cupola by next-nearest-neighbor exchange couplings.
pacs:
75.50.Ee, 75.40.Cx, 75.10.Jm, 75.30.EtI Introduction
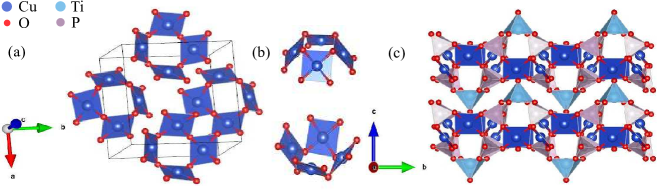
Recently, two new chiral compounds (TiO)Cu4(PO4)4 ( = Ba and Sr) (abbreviated as BTCPO and STCPO, respectively) were synthesized Kimura et al. (2016a). Both the compounds crystallize in the tetragonal space group with the lattice parameters [ Å and Å] and [ Å and Å], respectively. BTCPO and STCPO feature a quasi-two-dimensional (2D) structure, which is formed by the upward and downward Cu4O12 cluster-assembly units with alternating orientations in the -plane, as depicted in Fig. 1(a). Each Cu4O12 unit consists of four corner-sharing CuO4 square plaquettes forming a non-coplanar structure called (irregular) . Two types of the square-cupola units (upward and downward) are present in the structure [see Fig. 1(b)]. Each upward Cu4O12 square cupola is connected to the nearest downward square cupola unit and with the nearest upward TiO5 square pyramid [located on top (or bottom) of each upward (or downward) Cu4O12 square-cupola unit] by the PO4 tetrahedra.
A detailed magnetoelectric study has been reported for BTCPO via magnetization, heat capacity, dielectric, neutron scattering experiments, and subsequent model calculations Kimura et al. (2016b); Kato et al. (2017); Kenta et al. (2017); Babkevich et al. (2017). A huge anomaly in the temperature-dependent dielectric constant was observed at the Nel temperature K in the magnetic field applied along the [100] and [10] directions. It has been proposed that the asymmetric square-cupola units in the crystal structure can sustain magnetoelectric-active multipole moments associated with an antiferroic magnetic quadrupole order. Later, a combined experimental [high-field magnetization measurement] and theoretical [cluster mean-field approximation] study Kato et al. (2017) interpreted the magnetoelectric phase diagram and analyzed microscopically how the asymmetric square-cupola units trigger the magnetoelectric response through anisotropic exchange interactions. The critical role of the in-plane component of the Dzyaloshinsky-Moriya (DM) interaction, induced by the non-coplanar structure of the square cupola was established. The non-collinear magnetic structure of BTCPO has been determined using neutron diffraction and, eventually, spherical neutron polarimetry Babkevich et al. (2017).
Interestingly, the degree of chirality can be tuned in the (O)Cu4(PO4)4 ( Ti and V) series of compounds by changing both the and cations. For example, the structural chirality is more pronounced in STCPO compared BTCPO Kimura et al. (2016a). We therefore investigated and report below the magnetic behavior of STCPO, as revealed by different experimental techniques and ab initio calculations.
II Methods
Polycrystalline sample of STCPO was synthesized by the conventional solid-state reaction technique. The synthesis involves two steps. In the first step, the initial reactants SrCO3 (Aldrich, 99.995%), CuO (Aldrich, 99.999%), TiO2 (Aldrich, 99.9%), and (NH4)H2PO4 (Aldrich, 99%) were taken in stoichiometric ratios, ground thoroughly, and pressed into pellets. The pellets were kept in a quartz crucible and fired at 300 C for 12 hours in air to remove NH3 and CO2 from the sample. In the second step, the sample was re-ground, pelletized, and annealed at 950 C for 24 hours in air in a platinum crucible. Phase purity of the sample was confirmed by powder x-ray diffraction (XRD) measurements using the diffractometer from PANalytical (CuKα radiation, Å). The temperature-dependent powder XRD experiments were carried out over a broad temperature range (15 K K) using the Oxford Phenix (for low temperatures) and Anton-Paar HTK 1200N (for high temperatures) attachments.
Magnetization () measurements were performed using the vibrating sample magnetometer (VSM) attachment to the Physical Property Measurement System (PPMS, Quantum Design). Heat capacity () was measured using the heat capacity option in the PPMS, adopting the relaxation technique. High-field magnetization measurement up to 60 T was performed at the Dresden High Magnetic Field Laboratory using pulsed fields. Details of the measurement procedure are described in Ref. Tsirlin et al. (2009).
The NMR measurements were carried out using pulsed NMR techniques on 31P (nuclear spin and gyromagnetic ratio MHz/T) nuclei. We have carried out the measurements at two different radio frequencies of MHz and MHz, which correspond to the applied fields of about T and T, respectively. The spectra were obtained by sweeping the field at a fixed frequency. The NMR shift was determined by measuring the resonance field of the sample [] with respect to the nonmagnetic reference H3PO4 (resonance field ). The 31P spin-lattice relaxation rate was measured by the conventional inversion recovery method.
Exchange couplings of the spin Hamiltonian
| (1) |
where the summation is over all pairs , were obtained from density-functional (DFT) band-structure calculations performed in the full-potential local-orbital FPLO code Koepernik and Eschrig (1999) using Perdew-Burke-Ernzerhof flavor of the exchange-correlation potential Perdew et al. (1996). First Brillouin zone was sampled by a -mesh with up to 216 points in the symmetry-irreducible part. Exchange couplings were extracted using two complementary approaches. On one hand, the uncorrelated band structure was parametrized by a tight-binding model, and exchange couplings were estimated via the hopping parameters. On the other hand, total energies from DFT+ calculations were used in a mapping procedure Xiang et al. (2011). In DFT+, electronic correlations in the Cu shell are accounted for on the mean-field level using the on-site Coulomb repulsion eV and Hund’s coupling eV Janson et al. (2012); Nath et al. (2013); Lebernegg et al. (2013).
For simulating magnetic susceptibility and magnetization, finite lattices with up to 4 square cupolas and periodic boundary conditions were used. The simulations were performed using the fulldiag routine of the ALPS package Albuquerque et al. (2007).
III Results and Discussion
III.1 Crystal structure
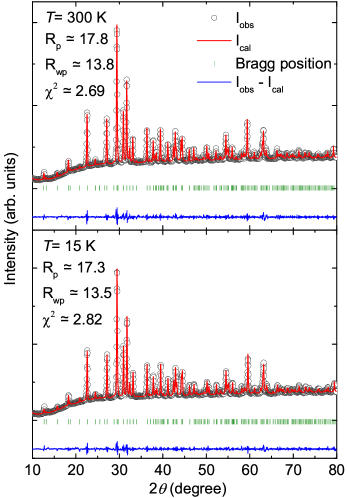
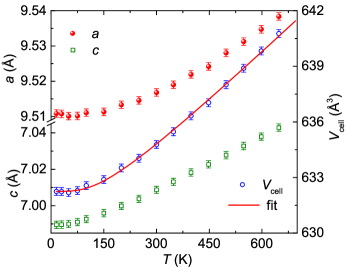
In order to check the phase purity and to detect structural transitions, if any, powder XRD was measured at different temperatures. Le-Bail fits of the XRD patterns were carried out using the FullProf package.Rodríguez-Carvajal (1993) The initial structural parameters for this purpose were taken from Ref. Kimura et al. (2016a). Figure 2 shows the powder XRD patterns at 300 K and 15 K along with the fits. The absence of unindexed peaks confirms phase purity of our sample. The obtained lattice constants and volume of the unit cell () at room temperature are Å, Å, and Å3, which are consistent with the previous report Kimura et al. (2016a). Figure 3 displays the temperature variation of lattice constants and unit cell volume. No structural transition was observed down to 15 K. The lattice constants and were found to decrease systematically upon cooling. The temperature variation of was fitted by the equation Pakhira et al. (2016)
| (2) |
where is the cell volume at K, is the bulk modulus, and is the Grneisen parameter. is the internal energy which can be expressed in terms of the Debye approximation as
| (3) |
Here, is the number of atoms in the unit cell, and is the Boltzmann constant. Using this approximation (see Fig. 3), the Debye temperature () and other parameters were estimated to be 550 K, Pa-1, and Å3.
III.2 Magnetization
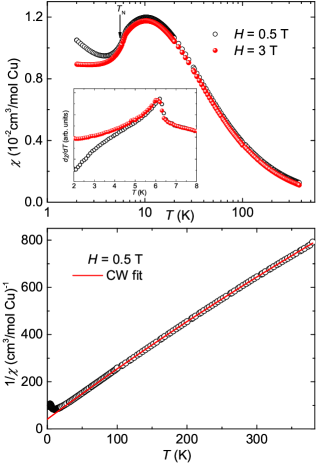
The static magnetic susceptibility () of the polycrystalline STCPO sample measured as a function of temperature at different applied fields T and 3 T is shown in the upper panel of Fig. 4. At high temperatures, increases with decreasing temperature in a Curie-Weiss manner and passes through a broad maximum around K. This broad maximum is indicative of a short-range order, anticipated for low-dimensional antiferromagnetic (AFM) spin systems. The temperature corresponding to the broad maximum is a measure of the dominant AFM exchange coupling. Below , exhibits a small kink at K, a possible indication of magnetic long-range ordering (LRO). In order to see this feature, we plotted temperature derivative of in the inset of Fig. 4. It shows a clear anomaly at K. At very low temperatures, shows an upturn, which is suppressed with the applied magnetic field. This upturn could be due to a small amount of extrinsic paramagnetic impurities and/or defects present in the sample.
For a quantitative analysis, the high-temperature data were fitted by the modified Curie-Weiss (CW) law
| (4) |
Here, is the temperature-independent susceptibility, which includes Van-Vleck paramaganetism and core diamagnetism, and the second term is the CW law. Our fit in the high-temperature regime ( K) (see the lower panel of Fig. 4) yields the following parameters: cm3/mol-Cu2+, the Curie constant cm3K/mol-Cu2+, and the Curie-Weiss temperature K. The core diamagnetic susceptibility of STCPO was calculated to be cm3/mol by adding the core diamagnetic susceptibilities Selwood (1956) of individual ions: Sr2+, Ti4+, Cu2+, P5+, and O2-. The Van-Vleck paramagnetic susceptibility was estimated by subtracting from to be cm3/mol. This value of is close to the values reported for other cuprates Nath et al. (2005); Motoyama et al. (1996).
From the value of , the effective moment is calculated to be using the relation , where is the Boltzmann constant and is the Avogadro’s number. This value of the effective moment corresponds to a Land -factor of [using ]. Such a large value of is typically observed for powder samples containing magnetic Cu2+ ions. The positive value of suggests that the dominant exchange interactions between Cu2+ ions are AFM in nature.
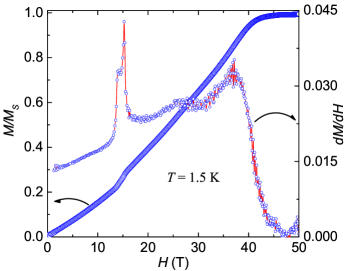
In order to study field-induced effects, magnetization isotherm ( vs ) was measured at K up to 60 T. As shown in Fig. 5, increases almost linearly with and then exhibits a kink at T before reaching full saturation at T. The kink seems to occur around of the saturation magnetization (). To visualize this feature, we plotted the derivative of with respect to i.e. vs in the right -axis of Fig. 5, which shows a sharp peak at this field. The overall behavior of the vs curve is similar to that reported for BTCPO earlier Kato et al. (2017).
III.3 Heat Capacity
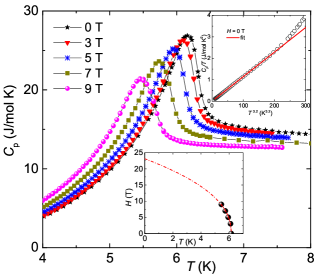
The temperature-dependent heat capacity is presented in Fig. 6. At high temperatures, is dominated by phonon excitations. As the temperature is lowered, shows a sharp -type anomaly at K, reflecting the magnetic LRO. Since a non-magnetic analogue compound could not be synthesized, we were unable to extract the magnetic part of the heat capacity from the total . Hence, no further analysis was possible. As shown in the upper inset of Fig. 6, a linear behavior was observed below when is plotted against . Usually, in the three-dimensional (3D) ordered state, the spin-wave dispersion gives rise to a behavior for . The higher power-law exponent of 4.2 may indicate peculiarities of the magnetic excitation spectrum, such as the presence of a spin gap. However, we were unable to achieve a good fit of assuming an activated behavior.
When the magnetic field is applied, the position of the anomaly at shifts towards low temperatures, suggesting that the transition is AFM in nature. The variation of with is shown in the lower inset of Fig. 6, which is a typical phase diagram expected for an antiferromagnet. Field evolution can be described by an empirical power-law fit with T, K, and .
III.4 31P NMR
The crystal structure of STCPO features one P site. Two adjacent cupolas (one upward and one downward) in the -plane are connected through the PO4 tetrahedra. Since P is strongly coupled with the Cu2+ ions, one can probe static and dynamic properties of Cu2+ spins via 31P NMR.
III.4.1 31P NMR Shift
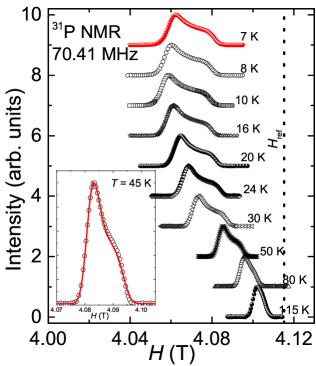
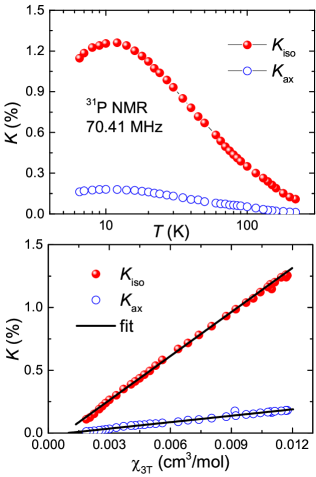
We observed a narrow spectral line above as expected for an nucleus Nath et al. (2005, 2008). Figure 7 presents the 31P NMR spectra measured at different temperatures. The line shape was found to be asymmetric, similar to that observed for Zn2VO(PO4)2 because of the anisotropy in and/or in the hyperfine coupling constant between the P nucleus and Cu2+ spins Yogi et al. (2015). The line position is found to shift with temperature. Temperature dependence of the NMR shift extracted by fitting the spectra (see inset of Fig. 7) is presented in Fig. 8, which shows a strong anisotropy along different directions. At high temperatures, both isotropic () and axial () parts of the NMR shift vary in a Curie-Weiss manner and then pass through a broad maximum at around 10 K reflecting the low-dimensional short-range order, similar to the data (Fig. 4).
The NMR shift is a direct measure of the spin susceptibility and is free from extrinsic contributions. Therefore, one can write in terms of as
| (5) |
where is the temperature-independent chemical shift and is the hyperfine coupling constant between the P nuclei and Cu2+ electronic spins. The vs plot with as an implicit parameter is fitted very well by a straight line [Fig. 8 (lower panel)] over the whole temperature range () yielding the isotropic and axial parts of the hyperfine coupling and Oe/, respectively.
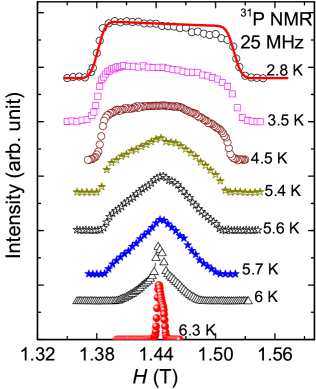
III.4.2 NMR spectra below
Below , the 31P spectra measured at 70.41 MHz were found to broaden abruptly and take a rectangular shape at very low temperatures. In order to precisely probe the intrinsic line shape, we re-measured the 31P spectra at a lower frequency of 25 MHz. As shown in Fig. 9, the 31P line above remains narrow and immediately below it starts broadening indicating that the P site is experiencing the static internal field in the ordered state through the hyperfine field between the P nuclei and the ordered Cu2+ moments. Below about 4 K, it becomes nearly rectangular with the center of gravity at 1.44 T, which is the resonance field for the 31P nuclei. It is well documented that for a polycrystalline sample, in a commensurate ordered state, the direction of the internal field is randomly distributed with respect to the applied field and one gets a rectangular spectral shape Yoshihiro and Akihiko (1986); Kikuchi et al. (2000). Indeed, such rectangular spectra have been observed in several compounds in the commensurate AFM ordered state. On the other hand, for an incommensurate ordered state, the NMR line shape is expected to be nearly triangular Kontani et al. (1975). In an attempt to fit our spectrum at 2.8 K, we followed the procedure adopted in Ref. Ranjith et al., 2016. The simulated spectra (see the solid line in Fig. 9) reproduce the experimental line shape very well, confirming the commensurate nature of the ordering below .
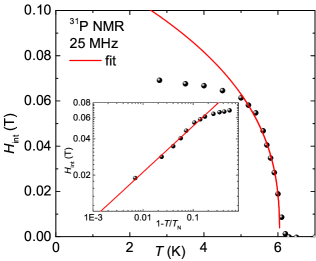
The internal field , which is proportional to the Cu2+ sublattice magnetization, was determined by taking the half-width at half-maximum. The temperature dependence of is plotted in Fig. 10. In order to extract the critical exponent () of the order parameter, was fitted by the power law of the form:
| (6) |
decreases rapidly on approaching . For an accurate estimation of , one needs more data points close to . We have estimated by fitting the data points in the critical region (close to ) as shown in Fig. 10. The value of with T and K was obtained by fitting the data points in the -range 5 K to 6 K, close to . In order to highlight the fit in the critical region, is plotted against the reduced temperature, in the inset of Fig. 10. The solid line is the fit by where is taken to be 6.04 K. At low temperatures, develops the tendency toward saturation and saturates faster than expected from the mean-field theory [see the deviation of fits in Fig. 10 at low-s].
Usually, the critical exponent reflects the universality class of a spin system. The values expected for different spin- and lattice-dimensionalities are listed in Ref. Nath et al., 2009. Our experimental value of is somewhat higher than any of the 3D spin models (Heisenberg, Ising, or XY) suggesting that the magnetic ordering is not driven by simple 3D correlations. This further corroborates our previous assessment based on the data.
III.4.3 Nuclear spin-lattice relaxation rate
The 31P nuclear spin-lattice relaxation rate above was measured at the field corresponding to the central peak position. For an nucleus, the recovery of the longitudinal magnetization is expected to follow a single-exponential behavior. Indeed, our recovery curves were fitted well by the exponential function
| (7) |
where is the nuclear magnetization at a time after the saturation pulse and is the equilibrium magnetization. The temperature dependence of extracted from the fit is presented in Fig. 11.
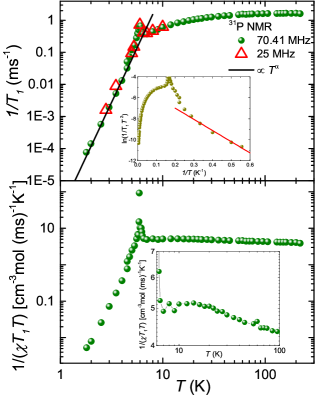
The data measured at two different frequencies (70.41 MHz and 25 MHz) almost resemble each other at low temperatures. At high temperatures ( K), is temperature-independent. In the paramagnetic limit , a temperature-independent behavior is typically expected due to uncorrelated moments Moriya (1956). As the temperature is lowered, decreases slowly for K and then shows a weak anomaly around K. Similar decrease has also been reported earlier for some low-dimensional antiferromagnets Pb2VO(PO4)2 Nath et al. (2009)], SrZnVO(PO4)2 Bossoni et al. (2011), VOMoO4 Carretta et al. (2002), and [Cu(HCO2)2.4D2O], where the decrease of above is explained by the cancellation of the antiferromagnetic spin fluctuations at the probed nuclei Carretta et al. (2000). Below , again decreases smoothly towards zero.
In the lower panel of Fig. 11, is plotted against temperature. For K, it shows a temperature-independent behavior, and a slow increase was observed just below 30 K where the system begins to show an AFM short-range order. In the inset of Fig. 11, the data above is magnified in order to highlight the slow increase. The general expression for in terms of the dynamic susceptibility can be written as Moriya (1963); Mahajan et al. (1998)
| (8) |
where the sum is over wave vectors within the first Brillouin zone, is the form-factor of the hyperfine interactions as a function of , and is the imaginary part of the dynamic susceptibility at the nuclear Larmor frequency . For and , the real component of corresponds to the uniform static susceptibility . Thus the temperature-independent above 30 K in Fig. 11 (bottom panel) demonstrates the dominant contribution of to . On the other hand, a slight increase in below 30 K indicates the growth of AFM correlations with decreasing , which is typically observed in frustrated magnets.
In the magnetically ordered state (), the strong temperature dependence of is a clear signature of the relaxation due to scattering of magnons by the nuclear spins Belesi et al. (2006). For , follows either a behavior or a behavior due to a two-magnon Raman process or a three-magnon process, respectively, where is the energy gap in the spin-wave excitation spectrum Beeman and Pincus (1968); Nath et al. (2014a). At very low temperatures (), it follows an activated behavior . As shown in the upper panel of Fig. 11, below follows a power law () with an unusually large value . In order to check whether there may exist a magnon gap, we have plotted ln() vs in the upper inset of Fig. 11. Indeed, it shows a linear regime below K and a straight line fit below 3.5 K yields the gap value K. This is consistent with the unusually high power-law in the heat capacity, although, as previously mentioned, no clear activated behavior could be seen in .
III.5 Microscopic magnetic model
Exchange couplings were calculated for the experimental crystal structure reported in Ref. Kimura et al., 2016a. First, we mapped valence bands formed by the half-filled Cu orbitals onto a tight-binding model and estimated the hopping parameters (Table 1), which define AFM superexchange interactions as , where is the effective on-site Coulomb repulsion in the Cu bands. This way, the overall span of the exchange couplings is probed.
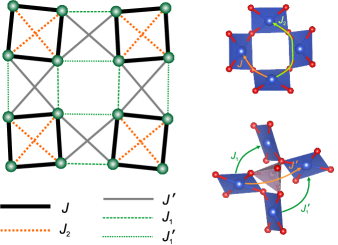
The spin lattice of Sr(TiO)Cu4(PO4)4 comprises square cupola with the leading nearest-neighbor coupling . A weaker and frustrating second-neighbor coupling may exist too. Several superexchange pathways are present between the cupola. Among them, the second-neighbor (”diagonal”) is clearly more efficient than the nearest-neighbor and (Fig. 12). The leading interplane coupling runs perpendicular to the plane via meV that corresponds to a minute K assuming eV Nath et al. (2013).
| 3.147 | 118 | 27.9 | |
|---|---|---|---|
| 3.619 | 23 | 1.0 | |
| 4.101 | 0.0 | ||
| 4.450 | 14 | 5.8 | |
| 4.973 | 7.0 | ||
| 5.097 | 10 | 2.2 |
DFT+ calculations give access to absolute values of the exchange couplings, including both FM and AFM contributions (Table 1). They confirm the leading coupling , the presence of the frustrating second-neighbor coupling within the cupolas and the non-frustrated coupling between them. Therefore, the minimum magnetic model comprises isolated square cupolas with only the nearest-neighbor coupling . As a better approximation, the couplings and should be included.
The model of isolated cupolas with only nearest-neighbor couplings describes the susceptibility down to 30 K but clearly fails to reproduce the position and height of the maximum (Fig. 13, dashed line). Including improves the fit down to about 20 K. However, the main improvement is achieved by including that, even in the absence of , describes the data down to 14 K. By combining and , we get the best fit using K, , and down to 8.5 K. Both position and height of the maximum are well reproduced (Fig. 13, solid line). The fitted -value of 2.17 seems realistic for Cu2+ and consistent with from the Curie-Weiss fit.
Same exchange parameters were used to simulate the magnetization process of Sr(TiO)Cu4(PO4)4 and lead to a good agreement with the experimental saturation field (Fig. 13, inset). However, finite-size effects are significant, and not all features of the experimental curve are reproduced, because the transition around 15 T is anisotropic in nature Kato et al. (2017) and can not be captured on the level of Heisenberg spin Hamiltonian.
IV Discussion and Conclusions
Similar to BTCPO, the spin lattice of STCPO comprises square cupolas. However, the nearest-neighbor coupling within the cupolas is by far insufficient to describe magnetic susceptibility of this compound. Our fits show that the second-neighbor coupling and the coupling between the cupolas are both sizable and integral to the magnetic model.
The moderate size of , 27.9 K in DFT and 16.3 K in the experiment, is controlled by the Cu–O–Cu angle of Kimura et al. (2016a) that lies on the border between FM and AFM superexchange. In this range of the bridging angles, subtle structural details, as well as side groups, have strong influence on the absolute value and even on the sign of the coupling Nath et al. (2013); Lebernegg et al. (2017); Badrtdinov et al. (2018). In BTCPO, a somewhat larger nearest-neighbor coupling of K was reported Kimura et al. (2016b); Kato et al. (2017). Indeed, the Ba compound systematically shows higher values of K Kimura et al. (2016b) (vs. 6.2 K), K Kimura et al. (2016b) (vs. 10 K), and T Kato et al. (2017) (vs. 40 T). Here, the values in brackets are for the Sr compound reported in this work.
The second-neighbor coupling is more unusual, because its experimental value of about 16 K is much larger than 5 K found in DFT. One plausible explanation for this discrepancy would be subtle structural changes upon cooling, as room-temperature crystal structure was used in DFT calculations for the lack of any crystallographic information at lower temperatures. The mechanism of should involve Cu–OO–Cu superexchange mediated by the relatively short OO distance of 2.76 Å along the edge of the CuO4 plaquette. A similar mechanism should be relevant to the couplings , , and , but the shorter OO contact of Å is along the edge of the PO4 tetrahedron in this case. The size of the coupling is controlled by deviations from linearity quantified by the deviation of the Cu–O–O angles from Tsirlin and Rosner (2010); Nath et al. (2014b); Berdonosov et al. (2013). The strongest coupling is found for the least curved Cu–OO–Cu superexchange pathway (Fig. 12).
Magnetic response of STCPO reveals several peculiarities. First, the magnetic ordering transition at K is observed well below the susceptibility maximum at K, and the ratio indicates a sizable reduction in due to the low-dimensionality and frustration. Second, the long-range-ordered state appears to be commensurate, but both specific heat and decrease rapidly at low temperatures. This may indicate gapped nature of magnetic excitations.
A somewhat different coupling regime was reported for BTCPO in previous studies. The authors of Refs. Kimura et al., 2016b; Kato et al., 2017 argue that is about 50% of , whereas is only a minor coupling (). We note, however, that these values were not tested against the experimental magnetic susceptibility, and only a classical analysis of the spin model was performed Kato et al. (2017). Gapped magnetic excitations may be related to the non-neglibigle anisotropy postulated for the Ba compound. On the other hand, the coupling can play a role in the stabilization of the non-coplanar state, an effect hitherto ascribed to the Dzyaloshinsky-Moriya anisotropy Kato et al. (2017).
In summary, we explored the low-temperature behavior of Sr(TiO)Cu4(PO4)4, a quantum magnet comprising the square cupolas of Cu2+ ions. Our results indicate sizable couplings between individual cupola units, as well as strong frustration within the cupolas. A spin gap of about 10 K may form in the ordered state, resulting in the unusually high power-law exponent of the specific heat and the activated behavior of the spin-lattice relaxation rate at low temperatures.
Note Added: after the submission of our work, Kimura et al. Kimura et al. (2018) reported the magnetic structure of STCPO from neutron diffraction experiments. Their commensurate magnetic structure is consistent with our NMR data. Additionally, STCPO shows a pronounced dielectric anomaly at but no ferroelectricity was observed.
Acknowledgements.
SSI and RN would like to acknowledge BRNS, India for financial support bearing sanction No.37(3)/14/26/2017-BRNS. AT acknowledges financial support by the Federal Ministry for Education and Research via the Sofja Kovalevskaya Award of Alexander von Humboldt Foundation.References
- Kimura et al. (2016a) K. Kimura, M. Sera, and T. Kimura, “A2+ cation control of chiral domain formation in A(TiO)Cu4(PO (A = Ba, Sr),” Inorg. Chem. 55, 1002–1004 (2016a).
- Kimura et al. (2016b) K. Kimura, P. Babkevich, M. Sera, M. Toyoda, K. Yamauchi, G. S. Tucker, J. Martius, T. Fennell, P. Manuel, D. D. Khalyavin, R. D. Johnson, T. Nakano, Y. Nozue, H. M. Rønnow, and T. Kimura, “Magnetodielectric detection of magnetic quadrupole order in Ba(TiO)Cu4(PO with Cu4O12 square cupolas,” Nature Comm. 7, 13039 (2016b).
- Kato et al. (2017) Y. Kato, K. Kimura, A. Miyake, M. Tokunaga, A. Matsuo, K. Kindo, M. Akaki, M. Hagiwara, M. Sera, T. Kimura, and Y. Motome, “Magnetoelectric behavior from asymmetric square cupolas,” Phys. Rev. Lett. 118, 107601 (2017).
- Kenta et al. (2017) K. Kenta, S. Masakazu, N. Takehito, N. Yasuo, and K. Tsuyoshi, “Magnetodielectric properties of the square cupola antiferromagnet Ba(TiO)Cu4(PO,” Physica B 536, 93–95 (2017).
- Babkevich et al. (2017) P. Babkevich, L. Testa, K. Kimura, T. Kimura, G. S. Tucker, B. Roessli, and H. M. Rønnow, “Magnetic structure of Ba(TiO)Cu4(PO probed using spherical neutron polarimetry,” Phys. Rev. B 96, 214436 (2017).
- Tsirlin et al. (2009) A. A. Tsirlin, B. Schmidt, Y. Skourski, R. Nath, C. Geibel, and H. Rosner, “Exploring the spin- frustrated square lattice model with high-field magnetization studies,” Phys. Rev. B 80, 132407 (2009).
- Koepernik and Eschrig (1999) K. Koepernik and H. Eschrig, “Full-potential nonorthogonal local-orbital minimum-basis band-structure scheme,” Phys. Rev. B 59, 1743–1757 (1999).
- Perdew et al. (1996) J. P. Perdew, K. Burke, and M. Ernzerhof, “Generalized gradient approximation made simple,” Phys. Rev. Lett. 77, 3865–3868 (1996).
- Xiang et al. (2011) H. J. Xiang, E. J. Kan, S.-H. Wei, M.-H. Whangbo, and X. G. Gong, “Predicting the spin-lattice order of frustrated systems from first principles,” Phys. Rev. B 84, 224429 (2011).
- Janson et al. (2012) O. Janson, I. Rousochatzakis, A. A. Tsirlin, J. Richter, Yu. Skourski, and H. Rosner, “Decorated Shastry-Sutherland lattice in the spin-1/2 magnet CdCu2(BO,” Phys. Rev. B 85, 064404 (2012).
- Nath et al. (2013) R. Nath, A. A. Tsirlin, P. Khuntia, O. Janson, T. Förster, M. Padmanabhan, J. Li, Yu. Skourski, M. Baenitz, H. Rosner, and I. Rousochatzakis, “Magnetization and spin dynamics of the spin hourglass nanomagnet Cu5(OH)2(NIPA)H2O,” Phys. Rev. B 87, 214417 (2013).
- Lebernegg et al. (2013) S. Lebernegg, A. A. Tsirlin, O. Janson, and H. Rosner, “Spin gap in malachite Cu2(OH)2CO3 and its evolution under pressure,” Phys. Rev. B 88, 224406 (2013).
- Albuquerque et al. (2007) A.F. Albuquerque, F. Alet, P. Corboz, P. Dayal, A. Feiguin, S. Fuchs, L. Gamper, E. Gull, S. Gürtler, A. Honecker, R. Igarashi, M. Körner, A. Kozhevnikov, A. Läuchli, S.R. Manmana, M. Matsumoto, I.P. McCulloch, F. Michel, R.M. Noack, G. Pawłowski, L. Pollet, T. Pruschke, U. Schollwöck, S. Todo, S. Trebst, M. Troyer, P. Werner, and S. Wessel, “The ALPS project release 1.3: Open-source software for strongly correlated systems,” J. Magn. Magn. Mater. 310, 1187–1193 (2007).
- Rodríguez-Carvajal (1993) J. Rodríguez-Carvajal, “Recent advances in magnetic structure determination by neutron powder diffraction,” Physica B 192, 55–69 (1993).
- Pakhira et al. (2016) S. Pakhira, C. Mazumdar, R. Ranganathan, S. Giri, and M. Avdeev, “Large magnetic cooling power involving frustrated antiferromagnetic spin-glass state in R2NiSi3 (R = Gd, Er),” Phys. Rev. B 94, 104414 (2016).
- Selwood (1956) P. W. Selwood, Magnetochemistry (Interscience, New York, 1956).
- Nath et al. (2005) R. Nath, A. V. Mahajan, N. Büttgen, C. Kegler, A. Loidl, and J. Bobroff, “Study of one-dimensional nature of (Sr,Ba)2Cu(PO and BaCuP2O7 via 31P NMR,” Phys. Rev. B 71, 174436 (2005).
- Motoyama et al. (1996) N. Motoyama, H. Eisaki, and S. Uchida, “Magnetic susceptibility of ideal spin- Heisenberg antiferromagnetic chain systems, and ,” Phys. Rev. Lett. 76, 3212–3215 (1996).
- Nath et al. (2008) R. Nath, Deepa Kasinathan, H. Rosner, M. Baenitz, and C. Geibel, “Electronic and magnetic properties of : A model Heisenberg chain system,” Phys. Rev. B 77, 134451 (2008).
- Yogi et al. (2015) A. Yogi, N. Ahmed, R. Nath, A. A. Tsirlin, S. Kundu, A. V. Mahajan, J. Sichelschmidt, B. Roy, and Y. Furukawa, “Antiferromagnetism of and the dilution with ,” Phys. Rev. B 91, 024413 (2015).
- Nath et al. (2014a) R. Nath, K. M. Ranjith, B. Roy, D. C. Johnston, Y. Furukawa, and A. A. Tsirlin, “Magnetic transitions in the spin- frustrated magnet and strong lattice softening in and below 200 K,” Phys. Rev. B 90, 024431 (2014a).
- Ranjith et al. (2016) K. M. Ranjith, R. Nath, M. Majumder, D. Kasinathan, M. Skoulatos, L. Keller, Y. Skourski, M. Baenitz, and A. A. Tsirlin, “Commensurate and incommensurate magnetic order in spin-1 chains stacked on the triangular lattice in ,” Phys. Rev. B 94, 014415 (2016).
- Yoshihiro and Akihiko (1986) Y. Yoshihiro and S. Akihiko, “An analysis method of antiferromagnetic powder patterns in spin-echo NMR under external fields,” J. Phys. Soc. Jpn. 55, 1751–1758 (1986).
- Kikuchi et al. (2000) J. Kikuchi, K. Ishiguchi, K. Motoya, M. Itoh, K. Inari, N. Eguchi, and J. Akimitsu, “NMR and neutron scattering studies of quasi one-dimensional magnet CuV2O6,” J. Phys. Soc. Jpn. 69, 2660–2668 (2000).
- Kontani et al. (1975) M. Kontani, T. Hioki, and Y. Masuda, “Hyperfine fields in an incommensurate antiferromagnetic Cr-Mo alloy system,” J. Phys. Soc. Jpn. 39, 672–674 (1975).
- Nath et al. (2009) R. Nath, Y. Furukawa, F. Borsa, E. E. Kaul, M. Baenitz, C. Geibel, and D. C. Johnston, “Single-crystal NMR studies of the frustrated square-lattice compound ,” Phys. Rev. B 80, 214430 (2009).
- Moriya (1956) T. Moriya, “Nuclear magnetic relaxation in antiferromagnetics,” Prog. Theor. Phys. 16, 23–44 (1956).
- Bossoni et al. (2011) L. Bossoni, P. Carretta, R. Nath, M. Moscardini, M. Baenitz, and C. Geibel, “NMR and SR study of spin correlations in SrZnVO(PO4)2: An frustrated magnet on a square lattice,” Phys. Rev. B 83, 014412 (2011).
- Carretta et al. (2002) P. Carretta, N. Papinutto, C. B. Azzoni, M. C. Mozzati, E. Pavarini, S. Gonthier, and P. Millet, “Frustration-driven structural distortion in ,” Phys. Rev. B 66, 094420 (2002).
- Carretta et al. (2000) P. Carretta, T. Ciabattoni, A. Cuccoli, E. Mognaschi, A. Rigamonti, V. Tognetti, and P. Verrucchi, “Spin dynamics and magnetic correlation length in two-dimensional quantum Heisenberg antiferromagnets,” Phys. Rev. Lett. 84, 366–369 (2000).
- Moriya (1963) T. Moriya, “The effect of electron-electron interaction on the nuclear spin relaxation in metals,” J. Phys. Soc. Jpn. 18, 516–520 (1963).
- Mahajan et al. (1998) A. V. Mahajan, R. Sala, E. Lee, F. Borsa, S. Kondo, and D. C. Johnston, “7Li and 51V NMR structure of the heavy-fermion compound LiV2O4,” Phys. Rev. B 57, 8890–8899 (1998).
- Belesi et al. (2006) M. Belesi, F. Borsa, and A. K. Powell, “Evidence for spin-wave excitations in the long-range magnetically ordered state of a molecular crystal from proton NMR,” Phys. Rev. B 74, 184408 (2006).
- Beeman and Pincus (1968) D. Beeman and P. Pincus, “Nuclear spin-lattice relaxation in magnetic insulators,” Phys. Rev. 166, 359–375 (1968).
- Lebernegg et al. (2017) S. Lebernegg, O. Janson, I. Rousochatzakis, S. Nishimoto, H. Rosner, and A.A. Tsirlin, “Frustrated spin chain physics near the Majumdar-Ghosh point in szenicsite Cu3(MoO4)(OH)4,” Phys. Rev. B 95, 035145 (2017).
- Badrtdinov et al. (2018) D. I. Badrtdinov, E. S. Kuznetsova, V. Yu. Verchenko, P. S. Berdonosov, V. A. Dolgikh, V. V. Mazurenko, and A. A. Tsirlin, “Magnetism of coupled spin tetrahedra in ilinskite-type KCu5O2(SeOCl3,” Sci. Reports 8, 2379 (2018).
- Tsirlin and Rosner (2010) A. A. Tsirlin and H. Rosner, “Microscopic model of (CuCl)LaNb2O7: Coupled spin dimers replace a frustrated square lattice,” Phys. Rev. B 82, 060409(R) (2010).
- Nath et al. (2014b) R. Nath, K. M. Ranjith, J. Sichelschmidt, M. Baenitz, Y. Skourski, F. Alet, I. Rousochatzakis, and A. A. Tsirlin, “Hindered magnetic order from mixed dimensionalities in CuP2O6,” Phys. Rev. B 89, 014407 (2014b).
- Berdonosov et al. (2013) P. S. Berdonosov, O. Janson, A. V. Olenev, S. V. Krivovichev, H. Rosner, V. A. Dolgikh, and A. A. Tsirlin, “Crystal structures and variable magnetism of PbCu2(XOCl2 with X = Se, Te,” Dalton Trans. 42, 9547 (2013).
- Kimura et al. (2018) K. Kimura, M. Toyoda, P. Babkevich, K. Yamauchi, M. Sera, V. Nassif, H. M. Rønnow, and T. Kimura, “-cation control of magnetoelectric quadrupole order in A(TiO)Cu4(PO (A = Ba, Sr, and Pb),” Phys. Rev. B 97, 134418 (2018).