Testing Alignment of Node Attributes with Network Structure Through Label Propagation
Abstract.
Attributed network data is becoming increasingly common across fields, as we are often equipped with information about nodes in addition to their pairwise connectivity patterns. This extra information can manifest as a classification, or as a multidimensional vector of features. Recently developed methods that seek to extend community detection approaches to attributed networks have explored how to most effectively combine connectivity and attribute information to identify quality communities. These methods often rely on some assumption of the dependency relationships between attributes and connectivity. In this work, we seek to develop a statistical test to assess whether node attributes align with network connectivity. The objective is to quantitatively evaluate whether nodes with similar connectivity patterns also have similar attributes. To address this problem, we use a node sampling and label propagation approach. We apply our method to several synthetic examples that explore how network structure and attribute characteristics affect the empirical -value computed by our method. Finally, we apply the test to a network generated from a single cell mass cytometry (CyTOF) dataset and show that our test can identify markers associated with distinct sub populations of single cells.
1. Introduction
Community detection in networks is a common pursuit that seeks to partition the network’s nodes into sets of structurally coherent groups, where members of a community have strong similarity in connectivity patterns (Mucha et al., 2010; Fortunato and Hric, 2016; Shai et al., 2017). While the identification of communities based solely on the network’s adjacency matrix is straightforward, the implications of having node attributes and how to integrate that into the community detection problem is not as well understood. We refer to a structural community as a community identified according to only the adjacency matrix, while we define an attribute community as a community that has been identified using the attribute information. Recently, there have been numerous approaches extending common community detection techniques to attributed networks (Hric et al., 2016; Peel et al., 2017; Combe et al., 2015; Yang et al., 2013; Newman and Clauset, 2016; Perozzi and Akoglu, 2018). While each of these methods provide extensions to a variety of community detection approaches, they also differ in their assumption about the dependence relationships between the attributes and connectivity. On one hand, it seems reasonable to assume that members of a structural community should be highly similar in attribute space. However, work by Newman et al. (Newman and Clauset, 2016) and Peel et al. (Peel et al., 2017) have provided phenomenal examples and insight into when this assumption could be invalid.
In this work, we seek to develop a test that returns a statistic reflecting how closely node attributes correlate with connectivity patterns. Our test is based on label propagation and ultimately returns an empirical -value that can be interpreted as the significance of the relationship between network connectivity and node attributes. We demonstrate that the computed empirical -value is meaningful with several synthetic examples and on a network representation of a single-cell mass cytometry CyTOF dataset.
This paper is organized as follows: First, we describe the latest advances in attributed community detection. Next, we define our method and show several synthetic examples to evaluate the performance and meaningfulness of our computed empirical -value. Finally, we apply our test to a single cell mass cytometry CyTOF dataset, identifying identify particular attributes that can distinguish populations of cells.
1.1. Community detection in attributed networks
There are a variety of approaches for identifying structural communities based only on connectivity patterns such as probabilistic methods (Snijders and Nowicki, 1997; Yang and Leskovec, 2013), quality function maximization (Newman, 2006), and higher-order motif-based clustering (Benson et al., 2016). Most of these classes of methods have inspired extensions in attributed networks. Here, we discuss extensions to probabilistic and quality function maximization approaches. Note that throughout this text we use the phrases attributes and metadata interchangeably to be consistent with the terminology in the discussed references.
1.1.1. Probabilistic approaches
Probabilistic community detection methods edge existence in a network based on latent community structure. After learning model parameters through likelihood optimization, samples generated from the model should align closely with the true underlying network. Two common approaches are the stochastic block model (SBM) (Snijders and Nowicki, 1997) and the affiliation model (Yang and Leskovec, 2013).
The assumption of the stochastic block model is that nodes within a community are connected to nodes within and between communities in a characteristic way. Moreover, the objective in the model fitting and parameter inference of a stochastic block model in a network with communities is to learn the node-to-community assignments and the within and between community connection probabilities that maximize the model likelihood. The stochastic block model has been extensively studied in the literature and has been extended to attributed networks in at least four ways (Hric et al., 2016; Peel et al., 2017; Newman and Clauset, 2016; Stanley et al., 2018). Newman et al. provided an extension to the stochastic block model capable of incorporating discrete or continuous metadata (attribute) information (Newman and Clauset, 2016). Peel et al. proposed the neoSBM (Peel et al., 2017), which explores the effects of ‘fixing’ and freeing nodes from their metadata label on the SBM inference. Along with this work, the authors developed BESTest, a statistical test to measure the relationship between a node’s metadata label and community structure. Hric et al. constructed a joint stochastic block model for both the attributes and metadata through a nonparametric, Bayesian framework (Hric et al., 2016). They assessed the alignment of the attributes with the connectivity based on performance in link prediction tasks. Stanley et al. introduced a version of the stochastic block model for networks with nodes having multiple continuous attributes (Stanley et al., 2018).
Another useful probabilistic model for community structure is the affiliation model. This model assumes that nodes can be affiliated to multiple communities to varying extents (Yang and Leskovec, 2013). Moreover, the edge between a pair of nodes is based on their similarity in community affiliations. A useful method for integrating multidimensional vectors of binary attributes was introduced by Yang et al. in a method called CESNA (Yang et al., 2013), which modifies the affiliation model likelihood to incorporate this information. This is achieved by allowing the attributes and connectivity information to be modeled as conditionally independent, giving the node-to-community affiliations and feature importance weights for the attributes.
1.1.2. Quality function maximization
Quality function maximization methods have also been extended to attributed networks. When community detection is formulated with a quality function, the objective is to specify a null model for a network with no community structure and find the partition of nodes to communities that maximizes the difference from this null model. A standard quality function for communities is known as modularity (Newman, 2006). The state-of-the-art optimization heuristic for maximizing modularity is the Louvain algorithm (Blondel et al., 2008). Work by Combe et al. adapted the modularity to take into account multidimensional attribute vectors and optimized this quantity in a Louvain-style manner with I-Louvain (Combe et al., 2015).
Recent work by Perozzi et al. defines a modularity-inspired quantity known as community normality (Perozzi and Akoglu, 2018). This measure prioritizes partitions where members of a community are very similar to each other in attribute space (and obviously in connectivity patterns). Further, members of a community are also expected to be different from nodes on the community boundary or in a different community.
1.2. Novelty and paper objectives
The methods described above indicate great progress in the integration of attributes in community detection. However, there has not been much work focusing on the interplay between attributes and connectivity information and the extent to which these data should be combined. In this paper, we seek to develop a statistical test to evaluate the relationship between connectivity and attribute information. Our approach is meant to be generalizable to all networks and agnostic to the particular community detection algorithm algorithm applied to the network. Our method can also accommodate multiple attributes that can be either discrete, continuous, or a combination of both. After defining the method for implementing this test, we seek to systematically study the properties of our test and its empirical -value output across various types of networks and attributes. Finally, we apply our tool to a single cell mass cytometry (CyTOF) dataset, where our results suggest that our method can successfully identify attributes with discriminative ability for distinguishing between communities.
2. Methods
Our method is built on label propagation (LP), where given a partially labeled network of nodes (i.e. only a subset of nodes have community assignments), the objective is to use this information to predict the community assignments of the unlabeled nodes (Xie and Szymanski, 2011). In this work, we first label the nodes according to their attribute information. We then take several sub samples of labeled nodes and use the prediction of the remaining unlabeled nodes as a proxy for how closely the attributes align with the network connectivity. In particular, we use a label propagation approach that returns a probability distribution for each node over each of the attribute-defined node-to-community assignments. We then quantify the uncertainty of the prediction with a simple entropy measure. In doing this, we assume that if the attributes are aligned with the network connectivity patterns, the entropy should be low. Alternatively, if attributes and connectivity are disparate, then predicting the unlabeled nodes will be difficult and entropy should be higher.
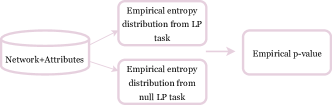
As an overview of this process, we first label the nodes according to their attribute information. This can be achieved by classifying the nodes according to a single discrete value, or through simple clustering of the nodes based on their attributes. After obtaining a labeling of the nodes, we begin our label propagation and null label propagation tasks. For a large number of trials, we take a sample of nodes and their attribute-based labels and denote these nodes as labeled. We then try to predict the labels of the remaining nodes, comprising the unlabeled set, by propagating the labels outward. Since the label propagation method returns a probability distribution over possible community assignments, we can compute an entropy measure. Along with this true label propagation task, in each trial we also permute the labels of the nodes in our sample set to generate a null distribution of entropy values for the unlabeled nodes. Finally, the overlap between the null and empirical entropy distributions are used to compute a -value. This process is outlined in Figure 1. We will now provided a detailed description of each step in this process.
2.1. Notation
We first define some notation that assists in setting up this problem. For a network with nodes, we let be the -length vector of node-to-community assignments, based on only the network connectivity information given in the adjacency matrix, . This implies that the -th entry, , gives the community assignment for node . Alternatively, when nodes are labeled according to the attribute information, we denote their community assignments with . Finally, our permutation test involves taking a subset of nodes and their labels in as the labeled set to propagate labels outward to a set of unlabeled nodes. We denote this distinction between the attribute-based partition of the labeled and unlabeled subsets of nodes by and , respectively. Finally, we assume that each node has associated attributes, which are stored in the matrix, . That is, the th row of , , gives the values of the attributes for node .
2.2. Classifying Nodes
The first step is to classify nodes according to attributes, denoted by . We assume some prior knowledge for the , specifying how many communities are in the data. Hence, each takes on 1 of values. In the case where nodes are classified discretely, according to a single source of information, this labeling occurs without any effort. In the case where each node has multiple attributes, we have found that a simple clustering method, such as -means works well. Because this first step of labeled the nodes is achieved through a clustering procedure, our approach can accommodate discrete and continuous attributes.
2.3. Sampling Nodes and Creating Entropy Distributions
In the sampling step, for a large number of trials, we randomly select nodes, , and their corresponding labels, . From here, we seek to use and the network structure to predict the labels for the the remaining nodes in the unlabeled set, .
After splitting all nodes into their labeled and unlabeled sets, we use the label propagation approach described by Zhu et al. (Zhu and Ghahramani, 2002) to generate a probability distribution over the communities from for each of the nodes in . Ultimately under this LP approach, we seek to define the matrix, , where is the probability that node belongs to class . We can split this matrix into two matrices, and , containing the subset of rows corresponding to nodes in and , respectively. Therefore, the label propagation task is to effectively estimate .
To compute following the approach by Zhu et al. (Zhu and Ghahramani, 2002), we first use the adjacency matrix, , to define and transition probability matrix, . Here, entry gives the probability of jumping from node to node . This is given by,
| (1) |
We then compute , which is simply the row normalized version of . From here, is rearranged so that the first rows and columns correspond to the labeled nodes, and the remaining columns correspond to the unlabeled nodes. This rearrangement allows for to be written as four submatrices, obtained by splitting after the th row and th column as,
| (2) |
Based on the fact that Zhu et al., define their label propagation algorithm as , can be defined as,
| (3) |
More details about this label propagation approach are described in Ref. (Zhu and Ghahramani, 2002). Computing for one pair of labeled and unlabeled node sets, and , comprises the true label propagation task of one trial. To perform a null LP task, we first permute the entries of , and denote this permuted version as . Just as we showed in the true label propagation task, we use to define a corresponding permuted version of with set to be 1 if node belongs to community , under the permuted labels, given by . The analogous update relationship shown in equation 3 gives .
After computing and , the next step is to compute their corresponding entropies, and . We chose to use a cross entropy measure to account for both the attribute-based community assignment () and the prediction under our label propagation task, . From our attribute-based classification vector , we create the indicator matrix, ,where if node is assigned to community . With this notation, we compute cross entropy as,
| (4) |
Moreover, and give and , respectively.
We let and be the collection of entropies over the trials.
2.4. Computing the empirical -value
After having repeated this LP task over trials, we compute the empirical -value for the test. This -value is interpreted as the overlap between and . In the case where attributes () and connectivity () are well-aligned with connectivity, and should not overlap because the entropy for the label propagation task should be very low. Alternatively, as and become less aligned, the entropy of the prediction from the label propagation task should be higher and hence and will overlap. Then the empirical -value, , is calculated as,
| (5) |
Note that this -value is strictly empirical and intended to quantify the overlap between and .
3. Results
We present results on synthetic networks and on a network representation of a single cell mass cytometry CyTOF dataset. In this section, we seek to confirm that the empirical -value leads to an accurate and interpretable conclusion. The results on synthetic data are useful because we have an understanding of when the -value should be significant, due to our knowledge of how the data were generated. Similarly, in the single cell mass cytometry CyTOF dataset, we use particular marker features and their discriminative ability to validate our computed empirical -values.
3.1. Synthetic Examples
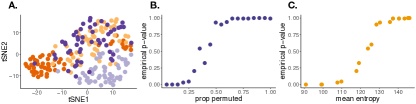
We sought to verify that our empirical -value was capturing desirable behavior. First, we expected the -value to decrease in significance as the LP entropy distribution increased in overlap with the empirical null LP entropy distribution. Second, we sought to have a -value that became less significant (i.e. higher) as the correlation between attributes and network structure decreased. In Figure 2, we considered a network generated from a stochastic block model with nodes, communities, within-community edge probability (), , and between-community edge probability, (), . That is for a pair of nodes, and , the probability of an edge existing between them is modeled as if and if .
Associated with each node is a 3-dimensional Gaussian attribute vector, drawn from 1 of multivariate Gaussian distributions. Under this formulation, each community has its own associated multivariate Gaussian distribution. The attribute vector for a node in community is parameterized by mean and covariance matrix .
To generate each , we draw each of the and from a standard Normal distribution with mean 0 and unit variance. For a community , is also the identity covariance matrix.
When performing our label propagation task, in each of the trials, we used a sample of labeled nodes as the input to the LP task.
First, we performed a tSNE (Maaten and Hinton, 2008) 2-dimensional embedding of the nodes based only on the attribute information, . This is shown in Figure 2A. Each point represents a node and is colored by its community assignment, . We can see that there are clearly clusters of nodes from the same community, but there is also some mixing. This implies that attributes and connectivity are not perfectly correlated.
In this first experiment, we sought to explore how the empirical -value behaved as the LP entropy distribution converged to the null LP entropy distribution. To study this, we consciously made the label propagation task incrementally more difficult by perturbing various proportions of the initial attribute-based node-to-community assignments, . This test was implemented to verify that with a higher proportion of permuted (i.e. incorrect) entries in , the empirical entropy distributions, and would have more extensive overlap. As expected, in Figure 2B. we observed that by permuting a larger proportion of the labels, , there was an associated increase in the empirical -value (decreased significance). Here, the proportion of labels permuted in was varied between 0.01 and 1 (horizontal axis). Next, we examined the relationship between the entropy distribution, and our empirical -value, in the experiments described in Figure 2B. In Figure 2C., we plot the empirical -value against the mean entropy of over the trials. As expected, these quantities are highly related, with a higher entropy leading to a higher (less significant) empirical -value.
3.1.1. Comparison to BESTest
We used the synthetic data from the experiment described in Figure 2 to compare our results to those obtained using BESTest (Peel et al., 2017). Recall that BESTest is the method developed to measure the relationship between communities and a piece of node metadata in the context of a stochastic block model. This comparison is especially appropriate since the synthetic data were generated from a stochastic block model. BESTest works first by labeling the nodes according to , based on the attribute information. Under this partition of the nodes, the SBM parameters are optimized, where the maximum likelihood estimate for the connection probability between a pair of communities and is given by . This maximum likelihood estimate is computed as . Here, is the number of edges between communities and , while and are the number of nodes in communities and , respectively. The entropy, of this partition across the communities is computed as,
| (6) |
The empirical -value is computed with BESTest through a permutation test which computes many times and reports the fraction of . The BESTest entropy measure was developed in the context of a stochastic block model. While we show in subsequent experiments that our results are highly correlated with the BESTest results, our approach is developed outside of the context of the stochastic block model. We analyzed the similarity between BESTest and our label propagation approach by studying the relationship between the BESTest entropy, and our entropy and empirical -value.
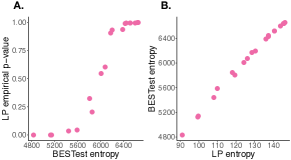
As described in section 3.1, our experiment involved permuting varying proportions of , which resulted in a range of entropies and hence computed empirical -values. Each experiment corresponding to a particular proportion of permuted entries of served as the attribute-based node classifications in our calculations of label propagation entropy and BESTest entropy. Note that to compute the BESTest entropies, the whole network is used. In Figure 3A. we plot our computed -value against the BESTest entropy and observe that these quantities are highly related. Even more related are the BESTest and label propagation entropies, plotted against each other in Figure 3B. These analyses suggest that these tests are highly related for this particular experiment. Since we did use stochastic block models to generate our synthetic data, interesting future work could examine the relationship between these tests for more diverse types of network structures.
3.1.2. Strength of community structure
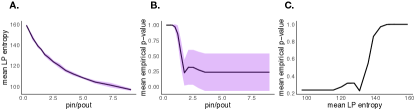
Given that aspects of network structure can influence label propagation results, we sought to experimentally probe how our test performed for community structure of varying strengths. We refer to a strong community structure as one that has many within-community connections and few between-community connections. In this case, communities are easy to identify, based on the prominent organizational structure. To approximate this, we considered the to ratio for a stochastic block model. As previously described, is defined as the probability of observing an edge between a pair of nodes in the same community, while is the probability of observing an edge between a pair of nodes in different communities. We expected that the entropy and empirical -value would decrease with an increasing ratio. That is, as the community structure becomes less prominent with an increased number of connections between communities, the label propagation task should become more difficult. To study this with synthetic data, we varied the ratio, by considering a four community stochastic block model with values of between 0.05 and 0.45 and choosing a corresponding , such that the mean degree was equal 30. For each pair of and , we generated 10 realizations from the corresponding stochastic block model. Accompanying each synthetic network was a fixed 3-dimensional attribute matrix, , where the attribute vectors for the members of community were drawn from a 3-dimensional multivariate Gaussian, parameterized by . For each synthetic network, we computed the entropy under our label propagation method and the corresponding -value.
In Figure 4A. we plot the mean LP entropy over the samples used to construct the empirical entropy distribution, , across the 10 network realizations for each set of and . The shaded region denotes the standard deviation of the LP entropy. As the ratio between and increases, the empirical LP entropy decreases. We see a similar effect in Figure 4B. where we plot the empirical -value as a function of the ratio. In this plot, the shaded region denotes the standard deviation of the empirical -value. Here, a significant -value (at was sometimes reached (implying attributes and connectivity are aligned) when . Finally in Figure 4C. we examined the relationship between the mean empirical entropy () and the associated mean empirical -value across the 10 network realizations generated under each parameter pair. We observe that when the LP entropy (horizontal axis) reaches 130, the mean empirical -value increases (i.e. decreases in significance) very quickly.
4. Mass Cytometry Network Example
We applied our test to a single cell mass cytometry CyTOF dataset. Mass cytometry with CyTOF (Bendall et al., 2012) is an immunological profiling technique that gives simultaneous quantification of various immune features. The output of this technology is approximately 50 immune features profiled for each cell in a large collection of single cells. We used a freely available mass cytometry dataset, originally described in Ref. (Wong et al., 2015), but pre-processed in an R tool called CytofKit (Chen et al., 2016). The dataset profiles 51 immune features across single cells on human T helper cells from peripheral blood and tonsils, which have shown to be heterogeneous within a sample. Note that consistent with the immunology literature, we also refer to these immune features as markers. To untangle the heterogeneity and infer cellular phenotypes, dimension reduction and clustering are typically applied to single cell data. In this pursuit, the objective is to cluster the single cells into predicted phenotypes, based on the measured features. A powerful way to segment the single cells into their respective phenotypes is by constructing a similarity network between the cells and clustering with community detection. This method for studying single cell data is called PhenoGraph and is described in Ref. (Levine et al., 2015). We studied the data in an analogous way by constructing a -nearest neighbor network between the cells and applying community detection to cluster them. In this representation, each node in the nearest neighbor network is a single cell and is connected to its 5 nearest neighbors, based on the pairwise Euclidean distance for the 51 measured immune features. In this example we considered a subset of 1000 single cells. After constructing the network, we predicted phenotypes by identifying communities () with the Louvain algorithm (Blondel et al., 2008). Applying the Louvain algorithm to the network’s adjacency matrix, , identified 11 communities. As shown in Ref. (Chen et al., 2016), one further analysis after clustering the single cells is to identify features with discriminative power between inferred phenotypes. We find the application of our LP task to CyTOF data to be an appealing validation task for our algorithm because there should be a set of features (i.e. the profiled markers) that have strong discriminative ability in separating communities in the network. Note that in this context, communities in the network are also closely linked to inferred cell phenotype.
The first test we performed on CyTOF nearest neighbor network was to examine how each marker feature related to the community partition, , identified with the Louvain algorithm. To understand the interplay between the nearest neighbor network structure and the measured immune features, we performed 51 separate analyses. Each analysis considered the correlation of each immune feature individually with community structure. To produce a partition of the network, , corresponding to a single marker, , we simply clustered the 1000 nodes into 1 of 11 clusters, based on the value of marker .
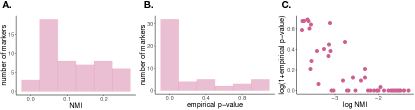
Before applying our LP test to this network, we used normalized mutual information (NMI) (Danon et al., 2005) to quantify the similarity between and . A high NMI (i.e. close to 1), indicates that the single attribute, , used to create creates a similar partition to the partition , obtained from the Louvain algorithm on just the network structure (i.e. connectivity information only). Conversely, an NMI near 0 indicates that when nodes (cells) are clustered based on the particular feature, their partition is very different to that obtained using connectivity information (A).
In Figure 5A. we show the distribution of NMIs computed between and for each of the 51 markers. We observe a fairly broad range of marker qualities represented. Similarly, we applied our LP task for trials and a sample of 500 labeled nodes in each trial. Figure 5B. shows the distribution of empirical -values from our LP method. In this experiment we did not correct for multiple testing since significantly scoring features had very low empirical -values (i.e. 0 or close to 0, implying no overlap between and ). We noticed that there are approximately 30 markers with a low -value (between 0 and 0.2), according to our LP test. Finally, in Figure 5C. we examined the relationship between the NMI between and and the empirical -value, across each of the 51 markers. As expected, these quantities are highly related, with high values of NMI corresponding to lower, more significant -values.
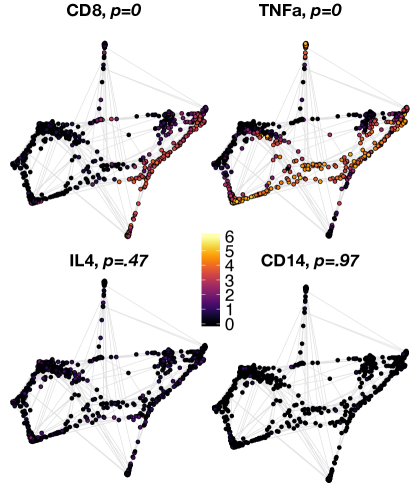
To visualize how particular markers correlated with communities in the network, through their induced partition, , we closely examined four different markers. Again, we used each attribute in isolation to perform an attribute-based partition of the nodes, into 1 of 11 clusters. Two of these markers (CD8 and TNFa), had a -value of 0 with our label propagation task. The other two markers (IL4 and CD14) had non-significant -values of 0.47 and 0.97, respectively. In Figure 6, we show the nearest neighbor networks of single cells with nodes colored by the expression for each of these four markers. Note that lighter colors indicate high expression and darker colors indicate lower expression. In the top row, we show the networks corresponding to CD8 and TNFa. We observe that expression patterns are indeed localized in the network. That is, dense clusters in the network tend to have similar marker expression. Further, this marker expression varies across communities in the network. Alternatively in the bottom row where we visualization IL4 and CD14, we observe that there is not much variability in marker expression across the network. In other words, using these markers to classify nodes would not be effective. This analysis further suggests that our empirical -value can successfully identify markers with discriminative power because they are well-correlated with particular communities.
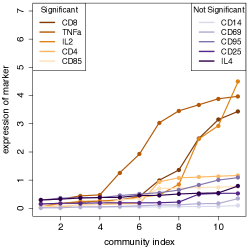
As an final experiment, we sought to see if the markers with significant empirical -values (implying that they are effective in distinguishing cellular phenotypes) did indeed vary across communities in the network, through their induced partition, . To do this, we selected 10 markers from the 51 measured features of the CyTOF data. In particular, we looked at the 5 of the most and least significant markers, in terms of the computed empirical -value. For each of these 10 markers, we computed the mean marker expression across each of the 11 communities identified by applying the Louvain algorithm applied to the network’s adjacency matrix, . in Figure 7, we then plotted the mean marker expression across communities for the 5 most and least significant markers. The least significant markers are shown in the family of blue lines and are relatively static across each of the 10 communities. In contrast, the orange family of lines corresponds to the markers for the more significant features and do vary across communities. Since a marker with a significant low empirical -value should correlate well with communities, this is the pattern we expected. The 5 poorly ranked markers clearly do not correlate with communities because their expression is constant across all communities.
5. Conclusion
In this paper, we introduced a label propagation based approach to determine how closely attributes align with network connectivity. Over trials, the label propagation task uses a subset of nodes labeled according to attribute information to predict the labels for a set of unlabeled nodes. The label propagation task we adopt returns a probability distribution for each of the unlabeled nodes over the possible communities. The empirical -value of our test is computed by comparing the empirical entropy distributions across the trials from our label propagation task, and a permuted label propagation task, denoted by and , respectively. The intuition is that if attributes are well aligned with network connectivity patterns, then the label propagation task should produce results that are more certain, and hence have lower entropy. Our results indicate that the computed entropy and empirical -value are behaving as expected on synthetic examples, where we designed the experiments in a way that we knew how well the attributes and connectivity correlated. We also show that our test is useful in the identification of important marker features for distinguishing communities in the single cell mass cytometry nearest neighbor network. Here, features (markers) with low empirical -value are features that vary across communities and hence give insight into immune features that distinguish communities or cell subsets.
As future work, one might examine how the entropy and empirical -value relate to different communities identified using different algorithms or approaches. Future work could also benefit from the analysis of the number of trials () and the optimal number of nodes in each of the labeled and unlabeled node sets that lead to the most statistically stable and meaningful results. Finally, similar to how we detected particular marker features that were aligned with the identified communities, perhaps we can use our tool as a feature selection method that can can be used to create meaningful network representations of data.
Acknowledgments
This work was supported by the National Science Foundation under award #1610762.
References
- (1)
- Bendall et al. (2012) Sean C Bendall, Garry P Nolan, Mario Roederer, and Pratip K Chattopadhyay. 2012. A deep profiler’s guide to cytometry. Trends in immunology 33, 7 (2012), 323–332.
- Benson et al. (2016) Austin R Benson, David F Gleich, and Jure Leskovec. 2016. Higher-order organization of complex networks. Science 353, 6295 (2016), 163–166.
- Blondel et al. (2008) Vincent D Blondel, Jean-Loup Guillaume, Renaud Lambiotte, and Etienne Lefebvre. 2008. Fast unfolding of communities in large networks. Journal of statistical mechanics: theory and experiment 2008, 10 (2008), P10008.
- Chen et al. (2016) Hao Chen, Mai Chan Lau, Michael Thomas Wong, Evan W Newell, Michael Poidinger, and Jinmiao Chen. 2016. Cytofkit: a bioconductor package for an integrated mass cytometry data analysis pipeline. PLoS computational biology 12, 9 (2016), e1005112.
- Combe et al. (2015) David Combe, Christine Largeron, Mathias Géry, and Előd Egyed-Zsigmond. 2015. I-Louvain: An Attributed Graph Clustering Method. In Advances in Intelligent Data Analysis XIV. Springer, 181–192.
- Danon et al. (2005) Leon Danon, Albert Diaz-Guilera, Jordi Duch, and Alex Arenas. 2005. Comparing community structure identification. Journal of Statistical Mechanics: Theory and Experiment 2005, 09 (2005), P09008.
- Fortunato and Hric (2016) Santo Fortunato and Darko Hric. 2016. Community detection in networks: A user guide. Physics Reports 659 (2016), 1–44.
- Hric et al. (2016) Darko Hric, Tiago P Peixoto, and Santo Fortunato. 2016. Network structure, metadata, and the prediction of missing nodes and annotations. Physical Review X 6, 3 (2016), 031038.
- Levine et al. (2015) Jacob H Levine, Erin F Simonds, Sean C Bendall, Kara L Davis, D Amir El-ad, Michelle D Tadmor, Oren Litvin, Harris G Fienberg, Astraea Jager, Eli R Zunder, et al. 2015. Data-driven phenotypic dissection of AML reveals progenitor-like cells that correlate with prognosis. Cell 162, 1 (2015), 184–197.
- Maaten and Hinton (2008) Laurens van der Maaten and Geoffrey Hinton. 2008. Visualizing data using t-SNE. Journal of machine learning research 9, Nov (2008), 2579–2605.
- Mucha et al. (2010) Peter J Mucha, Thomas Richardson, Kevin Macon, Mason A Porter, and Jukka-Pekka Onnela. 2010. Community structure in time-dependent, multiscale, and multiplex networks. science 328, 5980 (2010), 876–878.
- Newman (2006) Mark EJ Newman. 2006. Modularity and community structure in networks. Proceedings of the National Academy of Sciences 103, 23 (2006), 8577–8582.
- Newman and Clauset (2016) Mark EJ Newman and Aaron Clauset. 2016. Structure and inference in annotated networks. Nature Communications 7 (2016), 11863.
- Peel et al. (2017) Leto Peel, Daniel B Larremore, and Aaron Clauset. 2017. The ground truth about metadata and community detection in networks. Science Advances 3, 5 (2017), e1602548.
- Perozzi and Akoglu (2018) Bryan Perozzi and Leman Akoglu. 2018. Discovering Communities and Anomalies in Attributed Graphs: Interactive Visual Exploration and Summarization. ACM Trans. Knowl. Discov. Data 12, 2, Article 24 (Jan. 2018), 40 pages. https://doi.org/10.1145/3139241
- Shai et al. (2017) Saray Shai, Natalie Stanley, Clara Granell, Dane Taylor, and Peter J Mucha. 2017. Case studies in network community detection. arXiv preprint arXiv:1705.02305 (2017).
- Snijders and Nowicki (1997) Tom AB Snijders and Krzysztof Nowicki. 1997. Estimation and prediction for stochastic blockmodels for graphs with latent block structure. Journal of classification 14, 1 (1997), 75–100.
- Stanley et al. (2018) Natalie Stanley, Thomas Bonacci, Roland Kwitt, Marc Niethammer, and Peter J Mucha. 2018. Stochastic Block Models with Multiple Continuous Attributes. arXiv preprint arXiv:1803.02726 (2018).
- Wong et al. (2015) Michael T Wong, Jinmiao Chen, Sriram Narayanan, Wenyu Lin, Rosslyn Anicete, Henry Tan Kun Kiaang, Maria Alicia Curotto De Lafaille, Michael Poidinger, and Evan W Newell. 2015. Mapping the diversity of follicular helper T cells in human blood and tonsils using high-dimensional mass cytometry analysis. Cell reports 11, 11 (2015), 1822–1833.
- Xie and Szymanski (2011) Jierui Xie and Boleslaw K Szymanski. 2011. Community detection using a neighborhood strength driven label propagation algorithm. In Network Science Workshop (NSW), 2011 IEEE. IEEE, 188–195.
- Yang and Leskovec (2013) Jaewon Yang and Jure Leskovec. 2013. Overlapping community detection at scale: a nonnegative matrix factorization approach. In Proceedings of the sixth ACM international conference on Web search and data mining. ACM, 587–596.
- Yang et al. (2013) Jaewon Yang, Julian McAuley, and Jure Leskovec. 2013. Community detection in networks with node attributes. In Data mining (ICDM), 2013 ieee 13th international conference on. IEEE, 1151–1156.
- Zhu and Ghahramani (2002) Xiaojin Zhu and Zoubin Ghahramani. 2002. Learning from labeled and unlabeled data with label propagation. (2002).