Deep and rapid observations of strong-lensing galaxy clusters within the sky localization of GW170814
Abstract
We present observations of two strong-lensing galaxy clusters located within the per cent credible sky localization maps released following LIGO-Virgo’s discovery of the binary black hole (BH-BH) gravitational wave (GW) source GW170814. Our objectives were (1) to search for candidate electromagnetic (EM) counterparts to GW170814 under the hypothesis that it was strongly-lensed, and thus more distant and less massive than inferred by LIGO-Virgo, and (2) to demonstrate the feasibility of rapid target of opportunity observations to search for faint lensed transient point sources in crowded cluster cores located within GW sky localizations. Commencing hours after discovery, and continuing over nights, we observed Abell 3084 () and SMACS J0304.34401 () with GMOS on the Gemini-South telescope, and Abell 3084 with MUSE on ESO’s Very Large Telescope. We detect no candidate EM counterparts in these data. Calibration of our photometric analysis methods using simulations yield detection limits for transients in difference images of the cores of these clusters of . This is the most sensitive photometric search to date for counterparts to GW sources, and rules out the possibility that GW170814 was lensed by these clusters with a kilonova-like EM counterpart. Based on the detector frame masses of the compact objects, and assuming that at least one Neutron Star (NS) is required in the merging system to produce a kilonova-like counterpart, implies that GW170814 was neither a NS-NS nor NS-BH merger at lensed by either of these clusters. Also, in the first ever emission line search for counterparts to GW sources, we detected no lines down to a detection limit of .
keywords:
galaxies: clusters: individual Abell 3084, SMACS J0304.34401 — gravitational lensing: strong — gravitational waves1 Introduction
Observational astronomy gained a new tool with the first direct detection of GWs (Abbott et al. 2016d). GWs have already provided new insights in to the properties of compact binaries and the nature of gravity (e.g., Abbott et al. 2016a, g, 2017, 2018a) that complement those accessible to EM observations. In the case of GW170817 (Abbott et al. 2017e), the first GW signal from a binary neutron star (NS-NS) coalescence was followed by observations of a counterpart across the electromagnetic (EM) spectrum (Abbott et al. 2017f). These multi-messenger observations permitted new tests of general relativity (Abbott et al. 2017b), measurement of the Hubble constant (Abbott et al. 2017a, 2018c), and yielded information on neutron star physics (e.g., Abbott et al. 2017g; Levan et al. 2017; Margalit & Metzger 2017; Bauswein et al. 2017).
Optical follow-up observations of stellar-mass compact binary coalescence (CBC) sources of GWs are challenging because of the large sky localization uncertainties inherent in the LIGO-Virgo data analysis. With only two GW detectors, sky localizations can be (Singer et al. 2014; Berry et al. 2015); adding additional detectors to the network improves sky localization (Veitch et al. 2012; Abbott et al. 2016f; Pankow et al. 2018) and enhances three-dimensional localization (Singer et al. 2016; Del Pozzo et al. 2018). Towards the end of LIGO-Virgo’s second observing run (O2) in 2017, when all three detectors were operational, the sky localizations from LIGO and Virgo for their triple-detector observations were (Abbott et al. 2017d, e, 2018b). The largest cameras on 4-m and 8-m class optical telescopes have fields of view of up to a few square degrees. It is therefore time consuming to search thoroughly the error regions of even the best localized GW sources, especially in the case of binary black hole (BH-BH) mergers, for which any EM counterparts are expected to be faint or non-existent. Despite these challenges, early observations of BH-BH merger sky localization error regions have been invaluable testing grounds for optical follow-up (e.g., Abbott et al. 2016c; Soares-Santos et al. 2016; Cowperthwaite et al. 2016; Yoshida et al. 2017; Utsumi et al. 2018; Doctor et al. 2018). Strategies that aim to overcome the challenges include optimizing the tiling and scheduling of wide-field searches (Coughlin et al. 2018), and targeting the follow-up observations on stellar mass selected galaxies located within the three-dimensional GW localizations (Nissanke, Kasliwal & Georgieva 2013; Hanna, Mandel & Vousden 2014; Fan, Messenger & Heng 2014; Gehrels et al. 2016). The latter approach was deployed to great success in the earliest identification of the optical counterpart to the NS-NS signal GW170817 (Coulter et al. 2017).
The luminosity distance to CBC sources is measured to per cent precision from LIGO-Virgo data (Berry et al. 2015; Abbott et al. 2016e, 2018b). Gravitational lensing, and in particular strong lensing (i.e. multiple imaging), is a possible source of systematic bias in these inferred luminosity distances, because the amplitude of the strain signal depends on both lens magnification , and luminosity distance : (hereafter we use to denote ). Therefore lens magnification allows sources from greater distances to be observed, and also means that the luminosity distance to a lensed source inferred assuming is under-estimated by a factor (Wang, Stebbins & Turner 1996). The redshift distribution of the known galaxy and cluster strong lenses peaks close to (e.g., Smith et al. 2018b), which corresponds to a luminosity distance of . For a GW source that is initially interpreted as being located at to be reinterpreted as being strongly-lensed implies that it must be magnified by a factor of . The systematic bias in the inferred distance also means that the masses of the source, which are calculated using the inferred source redshift (Krolak & Schutz 1987), are over-estimated by a factor , where is the redshift inferred assuming , and is the true redshift of the lensed source. Therefore, while lensing does complicate the measurement of distance, identification of a lensed source with LIGO-Virgo would provide a glimpse of the CBC population at , well in advance of third-generation GW detectors.
A strongly-lensed GW would travel to Earth along multiple paths through the foreground mass concentration, and thus in principle could be detected on more than one occasion by LIGO-Virgo, as would any EM counterpart. These paths differ in length, leading to a time delay between detections of consecutive signals up to several years (Smith et al. 2018b). Multiple detections of a single GW source, will create unique scientific opportunities with important advantages over previous work and important new challenges to overcome. The transient nature of GW events/detections mean that EM follow-up observations will not require expensive long-term monitoring programmes that are typical of time delay cosmography with lensed quasars. Moreover, the sub-millisecond precision to which the arrival time of GW signals are measured by LIGO-Virgo (Abbott et al. 2016e, b, 2017) will lead to a measured precision on the time delay between the arrival of lensed GW signals that is orders of magnitude superior to that achievable with supernovae or quasars (e.g., Fohlmeister et al. 2007; Rodney et al. 2016). Therefore, in principle, strongly-lensed GWs will yield unprecedented constraints on the distribution of dark and luminous matter in the gravitational lens, and a new and highly accurate measurement of the Hubble parameter (Liao et al. 2017). However, lens substructure and micro-lensing may reduce the precision of such measurements (Suyu et al. 2018 and references therein; Chen et al. 2018; Tie & Kochanek 2018), and therefore work to address such issues will be required. Comparing the time delay between EM and GW images will also enable the propagation speed of light and gravity to be compared (Collett & Bacon 2017; Fan et al. 2017). Multiple detections of the same GW source will also enable new constraints on GW polarizations, because the number of detectors that observe the same GW signal would grow with the number of the detections of the strongly-lensed event (cf. Chatziioannou, Yunes & Cornish 2012).
The probability that a GW source detected to date by LIGO-Virgo is strongly-lensed is small, because a tiny fraction of the sky is magnified sufficiently (, as discussed above) to reinterpret the detected strain signal as originating from a source beyond the lens population. For example, Hilbert et al. (2008) estimate that the source plane optical depth to for sources at is . Therefore, whilst estimates for the rate of detection of lensed GW sources vary, there is a broad consensus that the expected rate during O1 and O2 is , and will rise to when LIGO-Virgo reach design sensitivity in the early 2020s (Li et al. 2018; Ng et al. 2018; Smith et al. 2018b, a).
It will be difficult to identify that a GW source is strongly-lensed from the LIGO-Virgo signal alone (Hannuksela et al. 2019). This is because the over-estimated mass of the compact objects may not appear anomalous, and the GW sky localization uncertainties dwarf the solid angle subtended by the strong-lensing regions of galaxies, groups, and clusters by many orders of magnitude. Therefore, strong evidence beyond that available from the strain signal measured by LIGO-Virgo will be needed to outweigh the low prior expectation that a given GW signal was strongly-lensed. Identification of an EM counterpart to a GW source adjacent to the critical curve of a strong lens, and detection of a subsequent image of the same source would provide such evidence, and thus establish that a GW had been strongly-lensed. This would allow the correct source parameters to be inferred, and enable the science outlined above.
Current observations and theoretical predictions point to galaxy clusters dominating the optical depth to gravitationally magnifying point sources by . On the observational side, all strongly lensed images of quasars found by the Sloan Digital Sky Survey (SDSS) that are magnified by are lensed by galaxy clusters (Inada et al. 2003; Sharon et al. 2005; Oguri 2010; Oguri et al. 2013; Sharon et al. 2017). In contrast, individual galaxy lenses have thus far been shown to produce only low magnification strongly lensed qusar images i.e. (Agnello et al. 2018; Inada et al. 2005, 2006, 2007, 2008, 2009, 2014; Kayo et al. 2007, 2010; McGreer et al. 2010; More et al. 2016; Morokuma et al. 2007; Ofek et al. 2007; Oguri et al. 2004, 2005, 2008; Rusu et al. 2011, 2013). This picture is supported by theoretical work, notably that of Hilbert et al. (2008), whose optical depth to strong-lensing is dominated by halos of mass , i.e. galaxy groups and clusters. However, the number of highly magnified quasars seen by SDSS is small, and Hilbert et al.’s predictions pre-date modern cosmological hydrodynamical simulations. Therefore, more theoretical and observational work is needed to clarify the relative contribution of galaxy- and cluster-scale halos to high magnification lensing of point sources like CBCs. In Robertson et al. (in prep.), we will consider the optical depth to strong-lensing as a function of halo mass based on cosmological hydrodynamical simulations, and in this article we concentrate on optical observations that explore the strong lensing interpretation of BH-BH mergers detected by LIGO-Virgo.
We introduce a new observing strategy for identifying optical counterparts to GW sources – observations of strong-lensing galaxy cluster cores located within LIGO-Virgo GW sky localization maps. We describe our first implementation of this strategy via rapid target of opportunity (ToO) observations with the Gemini-South telescope111Based on observations obtained at the Gemini Observatory, which is operated by the Association of Universities for Research in Astronomy, Inc., under a cooperative agreement with the NSF on behalf of the Gemini partnership: the National Science Foundation (United States), the National Research Council (Canada), CONICYT (Chile), Ministerio de Ciencia, Tecnología e Innovación Productiva (Argentina), and Ministério da Ciência, Tecnologia e Inovação (Brazil). and ESO’s Very Large Telescope222Based on observations made with ESO Telescopes at the La Silla Paranal Observatory under programme ID 299.A-5028. (VLT) in the nights immediately following the discovery of the BH-BH source GW170814 (Abbott et al. 2017d). Our observations targeted known strong-lensing galaxy clusters, selected from the list compiled by Smith et al. (2018b). The main goals of our observations were to test the feasibility of searching for optical transients in rapid follow-up observations with small field-of-view instruments (that are well matched to cluster cores, and not routinely used for discovery of transient objects) on 8-m class telescopes, and to search in earnest for candidate EM counterparts to putative strongly-lensed GW sources. The large aperture of Gemini-South and VLT, and the absence of any requirement for us to explore the wider sky localization, enabled us to conduct deep observations that are sensitive to strongly-lensed EM counterparts down to independent of the actual source redshift. Our strategy therefore benefits from greater sensitivity than conventional searches, at the expense of a much smaller survey volume.
We describe the details of our observing strategy, observations, and data reduction in Section 2, explain how we generate difference images, and search for candidate optical counterparts, and state our results in Section 3, discuss our results in Section 4, and summarize in Section 5. We assume a flat cosmology with , (Ade et al. 2016). All celestial coordinates are stated at the J2000 epoch, and all magnitudes are stated in the AB system.
2 Observations
2.1 Observing strategy
We aim to conduct the most sensitive search to date for optical emission from CBC sources of GWs, under the hypothesis that the objects that we target have been strongly-lensed by a massive foreground galaxy cluster. We therefore select known, spectroscopically-confirmed strong-lensing clusters located close to the peak probability of the sky localizations of LIGO Scientific-Virgo Collaboration (LVC) CBC alerts. The strong-lensing regions of these clusters span on the sky, and are thus perfectly matched to instruments on ground-based -m class telescopes, including the GMOS instruments on the Gemini-North and South telescopes, and MUSE on VLT.
The most common GW sources are the coalescence of BH-BHs. Optical emission from BH-BHs is expected to be faint or non-existent (Abbott et al. 2016f, and references therein). Searches for optical emission from BH-BH mergers have typically reached sensitivity limits in the observer-frame -bands of with telescopes up to 4-m in diameter and with the Subaru 8-m telescope (e.g., Soares-Santos et al. 2016; Cowperthwaite et al. 2016; Yoshida et al. 2017; Arcavi et al. 2017; Utsumi et al. 2018; Doctor et al. 2018). In general, these observations reached a sensitivity compatible with detecting a kilonova-like counterpart to the respective BH-BH mergers and, as discussed in Section 1, their main aim was to implement and test a new type of observing campaign. We therefore adopted a nominal goal of reaching a spectral flux density limit with GMOS and MUSE corresponding to , in order to push the sensitivity of EM follow-up observations in to a new regime, independent of any lens magnification. In particular, we note that Doctor et al. (2018) observed the sky localization of GW170814 to a depth of with the Dark Energy Camera. Moreover, after taking account of lens magnification of (say) , the depth to which we observe corresponds to a search for optical emission from BH-BHs down to .
Our observations are guided by the best localizations provided by the LVC at the time. Localizations are refined as improved analyses become available (Abbott et al. 2016f), but since we expect a kilonova-like optical counterpart to fade rapidly, it is not possible to delay follow-up observations until final localizations are communicated. We identify the clusters for potential observations by comparing the celestial coordinates of strong-lensing clusters selected by Smith et al. (2018b) with the LVC sky localization. We use the two-dimensional sky localization to prioritize the most promising observing targets. Typically, we pick the strong-lensing cluster closest to the peak of the probability distribution as the most promising to observe.
Our ToO observing programmes at the Gemini Observatory and European Southern Observatory (hereafter ESO) commenced in early August 2017 under programme IDs GN-2017A-DD-9, GS-2017A-DD-6, 299.A-5028 respectively. These programmes allowed for up to epochs of imaging observations with the GMOS instruments on the Gemini-North and Gemini-South telescopes, and up to epochs of integral field spectroscopy with MUSE on VLT. The observations commence as soon as possible after receipt of the LVC alert via a rapid ToO, and were planned to extend over a period of one week following the alert via regular ToO observations.
2.2 Identification of strong-lensing clusters in the GW170814 sky localization
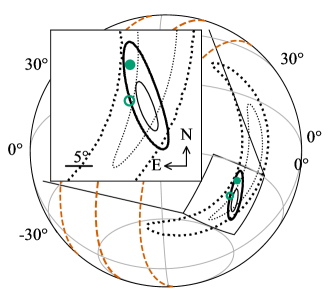
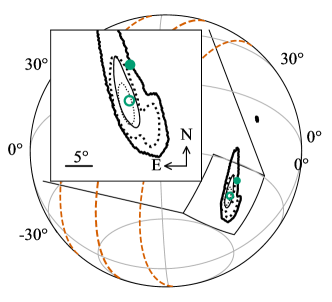
GW170814 was detected by LIGO and Virgo on August 14, 2017 at UTC, and first announced via GCN circular on August 14, 2017 at UTC (LIGO Scientific Collaboration and Virgo Collaboration 2017a) with an initial false alarm rate of in years. The per cent credible region in the initial bayestar (Singer & Price 2016) sky localization spanned , centered at celestial coordinates of . We identified one strong-lensing cluster, Abell 3084 (Table 1), within the per cent credible region of the bayestar map. Abell 3084 lies on the contour encircling a region within which the sky localization probability is , and which subtends (Figure 1).
As the LVC analyses were refined, the localization region evolved (Figure 1). On August 16, 2017 at UTC, the sky localization was updated based on the results of LALInference (Veitch et al. 2015), with a revised peak close to celestial coordinates of and a per cent credible region spanning (LIGO Scientific Collaboration and Virgo Collaboration 2017b). We identified two strong-lensing clusters within the per cent credible region of the LALInference map. Abell 3084 lay on the contour encircling per cent of the localization probability density, corresponding to a region subtending – i.e. this cluster is further from the peak of the probability distribution following the update. SMACS J0304.34401 (Table 1) was closer to the peak of the probability distribution, on the contour which encloses of the sky localization probability and subtends .
When GW170814 was first announced outside of the LVC and EM follow-up partners in October 2017 (Abbott et al. 2017d), the best sky localization peaked close to , with a per cent credible region spanning , and a luminosity distance of . With this, Abell 3084 lay on the contour that subtends , and SMACS J0304.34401 lay on the contour that subtends . Subsequently, the LIGO-Virgo data were recalibrated and cleaned for the O2 Catalogue results (Abbott et al. 2018b). Analysis of these improved data gave a localization peaking close to with a per cent credible region spanning , and a luminosity distance of . With this, Abell 3084 lay on the contour that subtends , and SMACS J0304.34401 lay on the contour that subtends .
2.3 Abell 3084 and SMACS J0304.34401
Abell 3084 and SMACS J0304.34401 are X-ray luminous galaxy clusters at intermediate redshift (Table 1). Virial mass estimates of both clusters are not published to date, however their X-ray luminosities are consistent with them both having a mass of . Both are spectroscopically confirmed strong lenses, each with one multiple-image system confirmed to date. Detailed models of the mass distribution in the cluster cores (May 2013, Christensen et al. 2012) are vital to interpreting the sensitivity of our observations and any flux that we detect from a candidate EM counterpart. The models are most accurate for sources at redshifts similar to the known multiple-image system redshifts; we therefore concentrate on these redshifts when considering the efficiency of our search for candidate EM counterparts in Section 3. Hubble Space Telescope (HST) snapshot observations with the Advanced Camera for Surveys (ACS) are available for both clusters, through the F606W filter (PID: 10881 and 12166). We use these data to calibrate our GMOS and MUSE observations (Sections 2.5 & 2.6) and in our difference image analysis (Section 3.1).
2.4 Gemini and VLT observations
We observed Abell 3084 with GMOS on Gemini-S on five occasions, commencing hours after the first LVC alert pertaining to GW170814, on August 15, 2017 UTC. This was the first Chilean night following the detection of GW170814. The GMOS observations of Abell 3084 continued after the revised sky map became available, in order to obtain a comprehensive dataset on one cluster. We also observed SMACS J0304.34401 with GMOS on Gemini-S on two occasions – August 18 and 21. The overall aim was to observe for minutes on each night, with the exposure times and number of exposures adjusted to suit the Moon phase and overhead conditions. The individual exposures were offset from each other randomly within a square region of full width . Observations were performed in the -band in order to minimize the impact of the Moon on the sensitivity of the observations, and to probe rest-frame -band emission from putative lensed GWs at .
We triggered a rapid ToO on VLT with MUSE within hours after LVC announced the detection of GW170814. This observation was executed at the telescope on August 17, 2017 UTC, and repeated on August 20, 2017 UTC. The delay between our trigger and the first MUSE observation was due to a combination of visitor mode time and engineering time on the intervening nights. Each observation comprised three exposures of duration and spanned the wavelength range .
All of the GMOS and MUSE data were obtained at high elevation and with excellent seeing of . Details of the GMOS and MUSE observations are listed in Table 2, and the reduction of GMOS and MUSE data are described in Sections 2.5 & 2.6, respectively.
| Visit | Start of observation (UTC) | Airmassa | Integration | Seeingb | Sensitivityc |
| time (ks) | (arcsec) | ||||
| GMOS Observations of Abell 3084 | |||||
| 1 | August 15, 2017, | ||||
| 2 | August 17, 2017, | ||||
| 3 | August 18, 2017, | ||||
| 4 | August 21, 2017, | ||||
| 5 | August 28, 2017, | ||||
| GMOS Observations of SMACS J0304.34401 | |||||
| 1 | August 18, 2017, | ||||
| 2 | August 21, 2017, | ||||
| 3 | August 27, 2017, | ||||
| MUSE Observations of Abell 3084 | |||||
| 1 | August 17, 2017, | ||||
| 2 | August 19, 2017, | ||||
-
a
The airmass at the mid-point of the observation.
-
b
Mean full width at half maximum of point sources in the reduced data, with a typical error on the mean of .
-
c
point source sensitivity within a photometric aperture of diameter , estimated from the magnitude at which the median photometric uncertainty is . The sensitivity of the MUSE observations is stated in the F606W-band.
2.5 GMOS data reduction
Individual GMOS exposures were de-biased, dark-subtracted, flat-fielded, and sky-subtracted in the standard manner using the gemini package in iraf, to produce both a single science frame comprising the mosaiced individual chips, and a bad-pixel map, for each exposure. The bad-pixel maps were applied to the science frames and the individual masked science frames were then combined in to a single stacked frame per visit using the imcombine task in iraf. The full width at half maximum of point sources in the reduced frames is consistently sub-arcsecond (Table 2). The reduced and stacked frames were aligned with the first visit for that target to a typical root-mean-square residual accuracy of using the iraf tasks geomap and geotran.
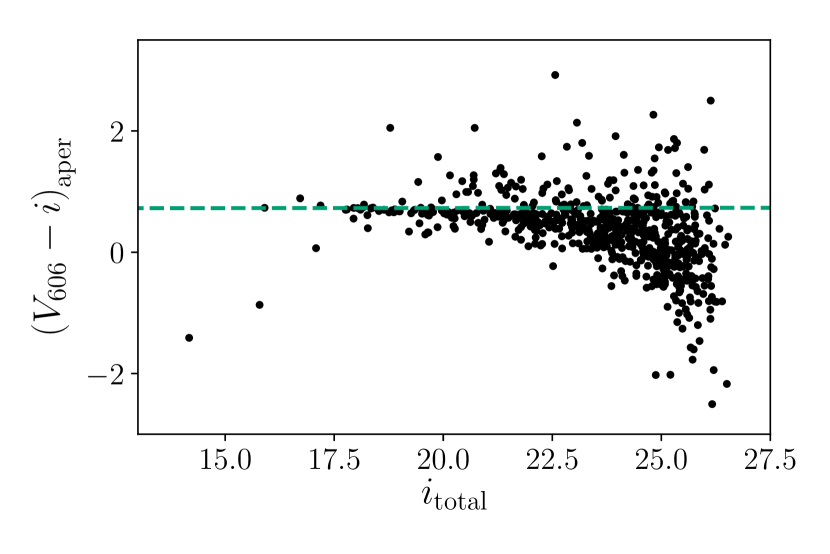
We searched the available USNO and GSC catalogues for sources of well calibrated -band magnitude within the field of view of our GMOS data. The size and depth of the GMOS imaging even in short exposures meant that there was no overlap between unsaturated bright stars as seen by Gemini and faint stars measured in all-sky surveys. We therefore calibrated the GMOS frames by measuring the colours of sources detected in both the archival HST/ACS data and our GMOS data, and selecting the photometric zero point that yields the correct colours for massive early-type galaxies in Abell 3084 and SMACS J0304.34401 respectively. These colours were computed using the EzGal code,333www.baryons.org/ezgal/ using a single stellar population that formed at high redshift and evolved passively to the relevant cluster redshifts based on the Bruzual & Charlot (2003) population-synthesis code. The predicted colours are insensitive to the fine details of how we choose the formation redshift and the metallicity. We show an example colour-magnitude diagram for one of the observations of Abell 3084 in Figure 2.
2.6 MUSE data reduction
The MUSE observations were reduced using version 2.0 of the data reduction software (Weilbacher et al. 2014). The process includes basic calibration (bias removal, flat-fielding, wavelength and geometrical calibration) and the production of datacubes for each exposure following sky subtraction, flux calibration and telluric correction. These datacubes were matched in astrometry to the relevant HST observation discussed in Section 2.3. In all cases, only a constant offset in right ascension and declination was applied, as no significant rotation was found. The measured offsets and rotation were applied back to the original list of pixels (the pixel table) so that the datacubes can be produced in a single interpolation step to limit the effect on the noise properties. Each exposure datacube was treated for sky subtraction residuals using the PCA method implemented in the ZAP v2.0 software (Soto et al. 2016). We then combined all zapped exposures taken during each of the two observations.
We assessed the image quality of the MUSE observations by performing a Moffat spatial fit of the bright unsaturated stars in each exposure. The seeing was stable in each night with average values provided in Table 2. We also estimated the cloud extinction to be just a few per cent and thus negligible, based on a comparison between MUSE pseudo-F606W frames (see Section 3.1) and relevant HST frames.
3 Analysis and results
3.1 Difference images
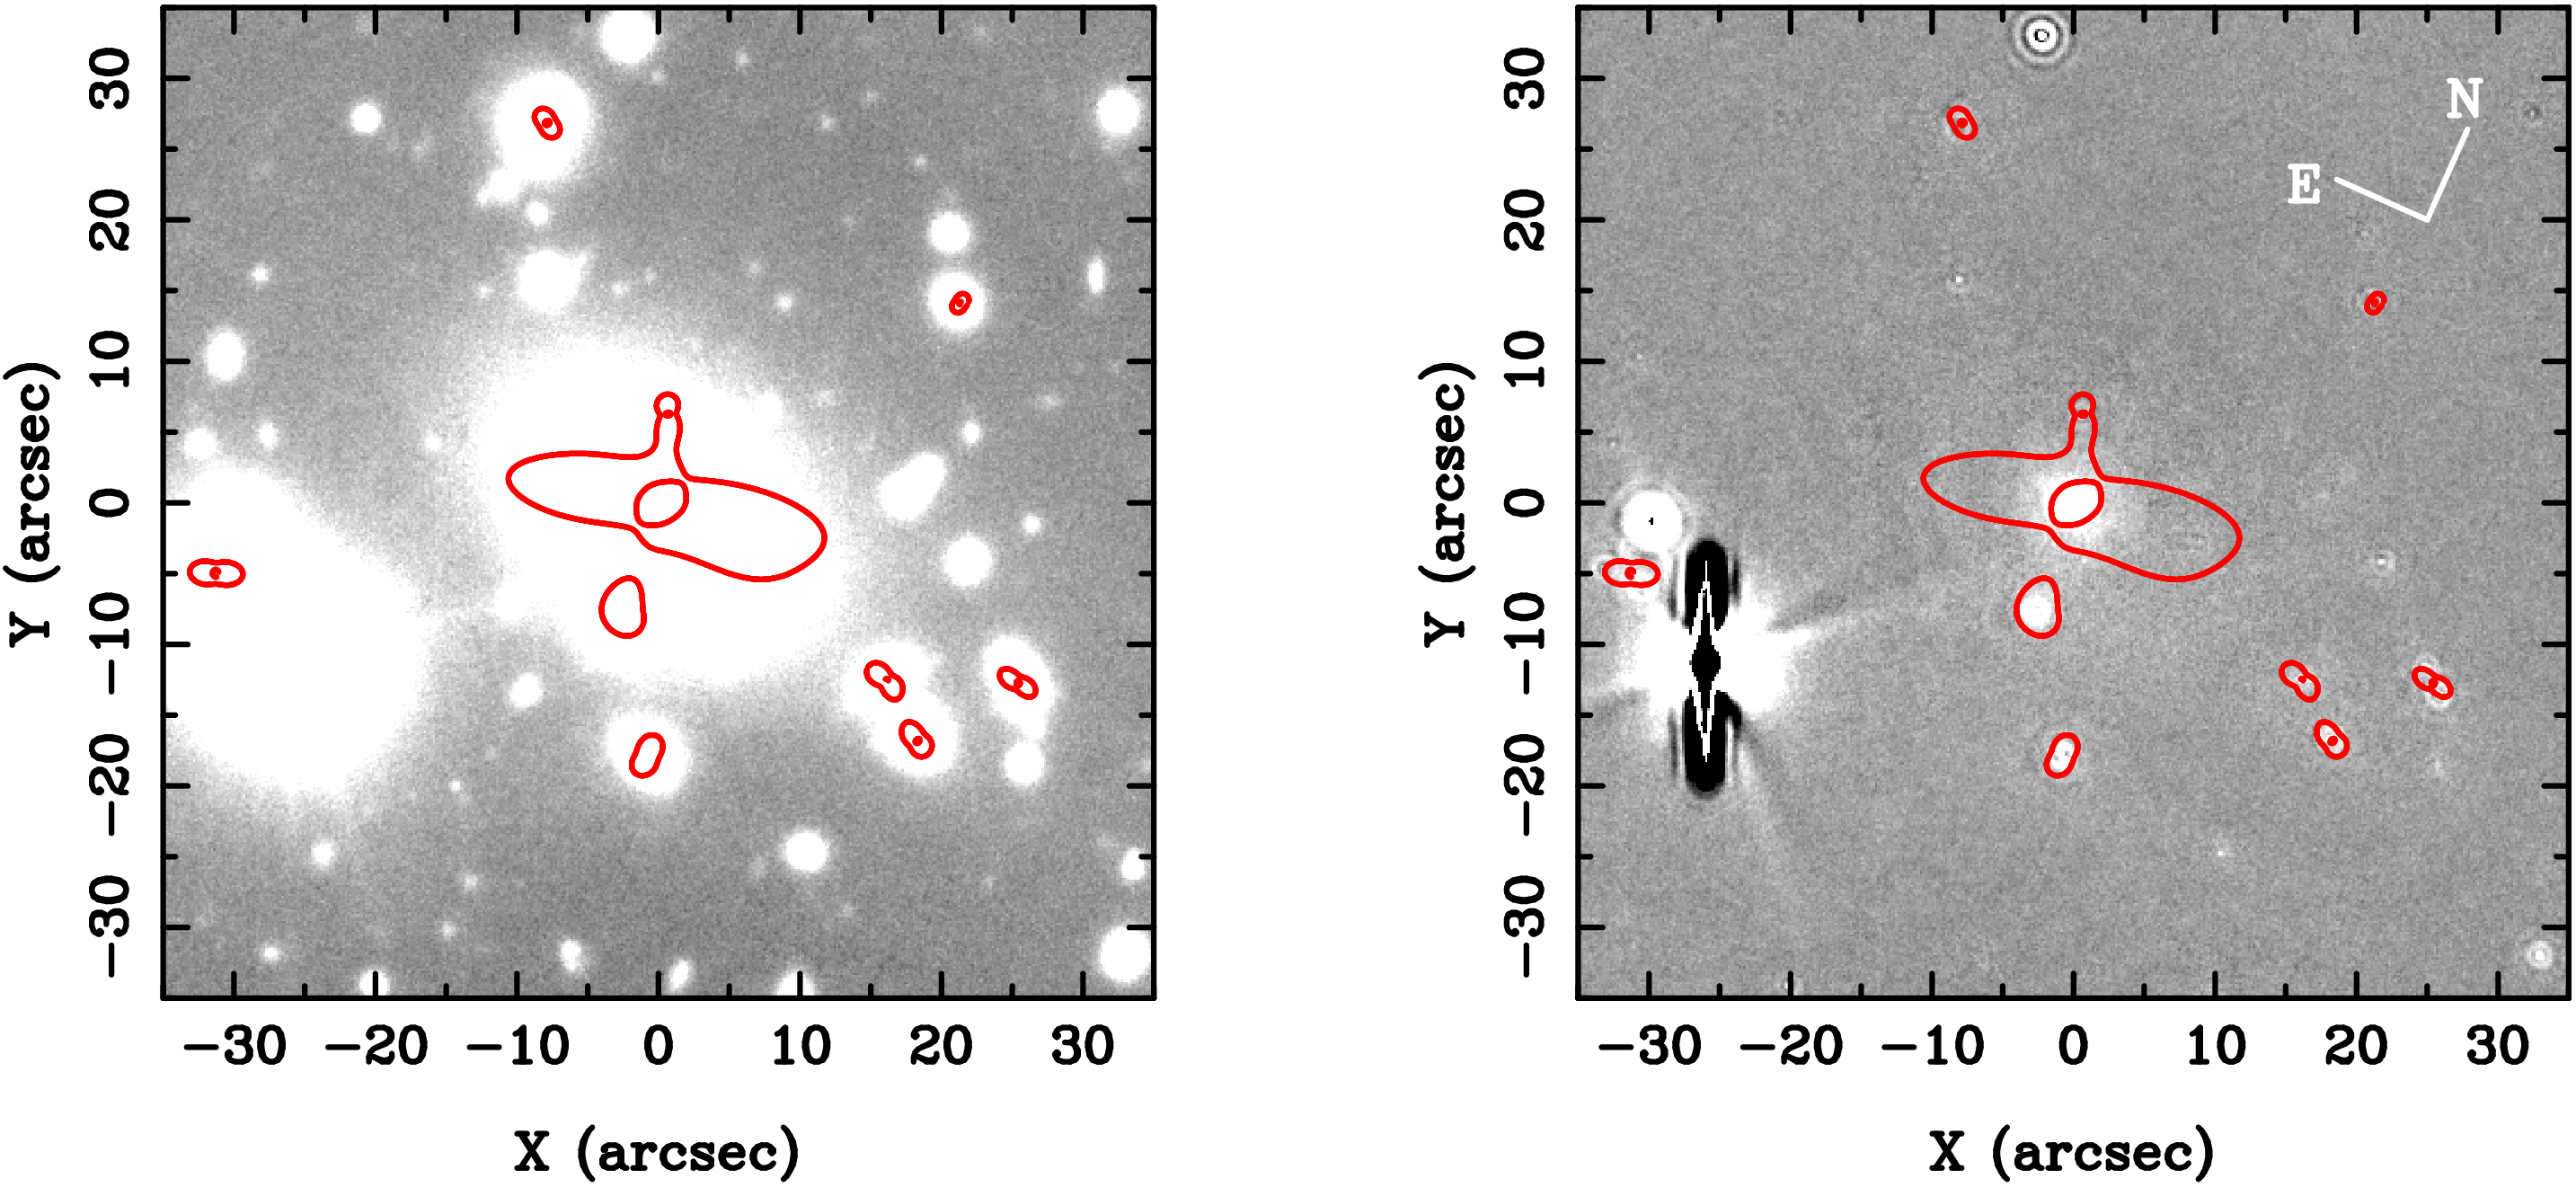
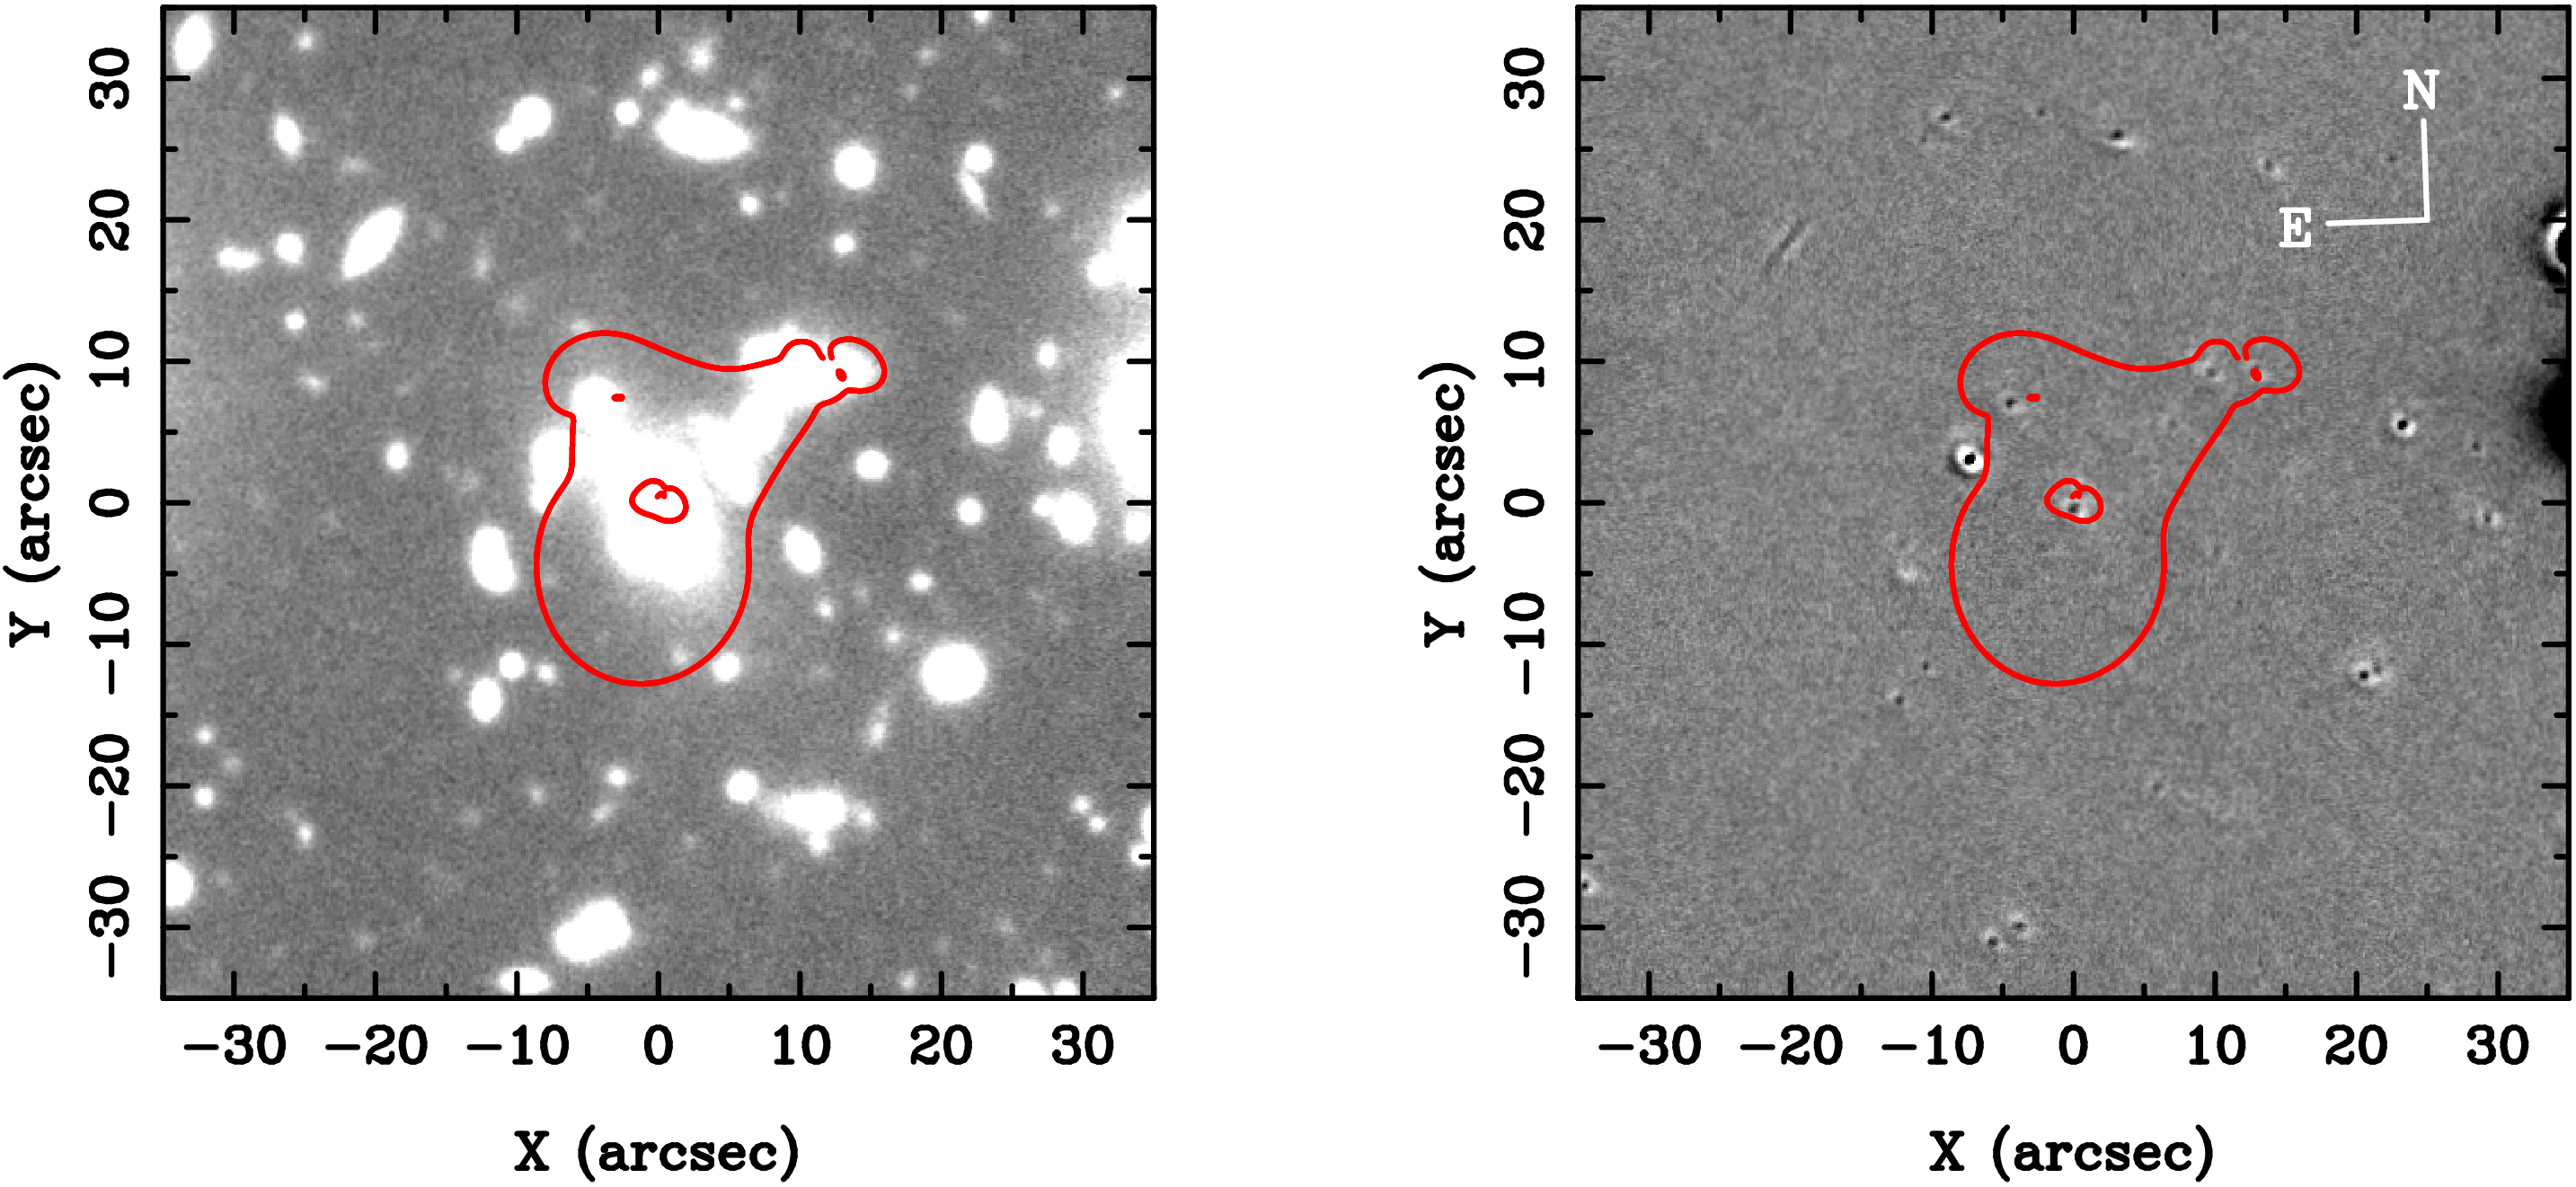
We normalised each reduced and stacked GMOS frame to an exposure time of one second, and then matched the image quality between visits using the psfmatch task in iraf. The point spread function (PSF) model was empirical and based on isolated, unsaturated, high signal-to-noise ratio stars in the vicinity of the strong-lensing region of each frame. These matched frames were then subtracted from each other in pairs to produce difference images, examples of which are shown in Figures 3 & 4.
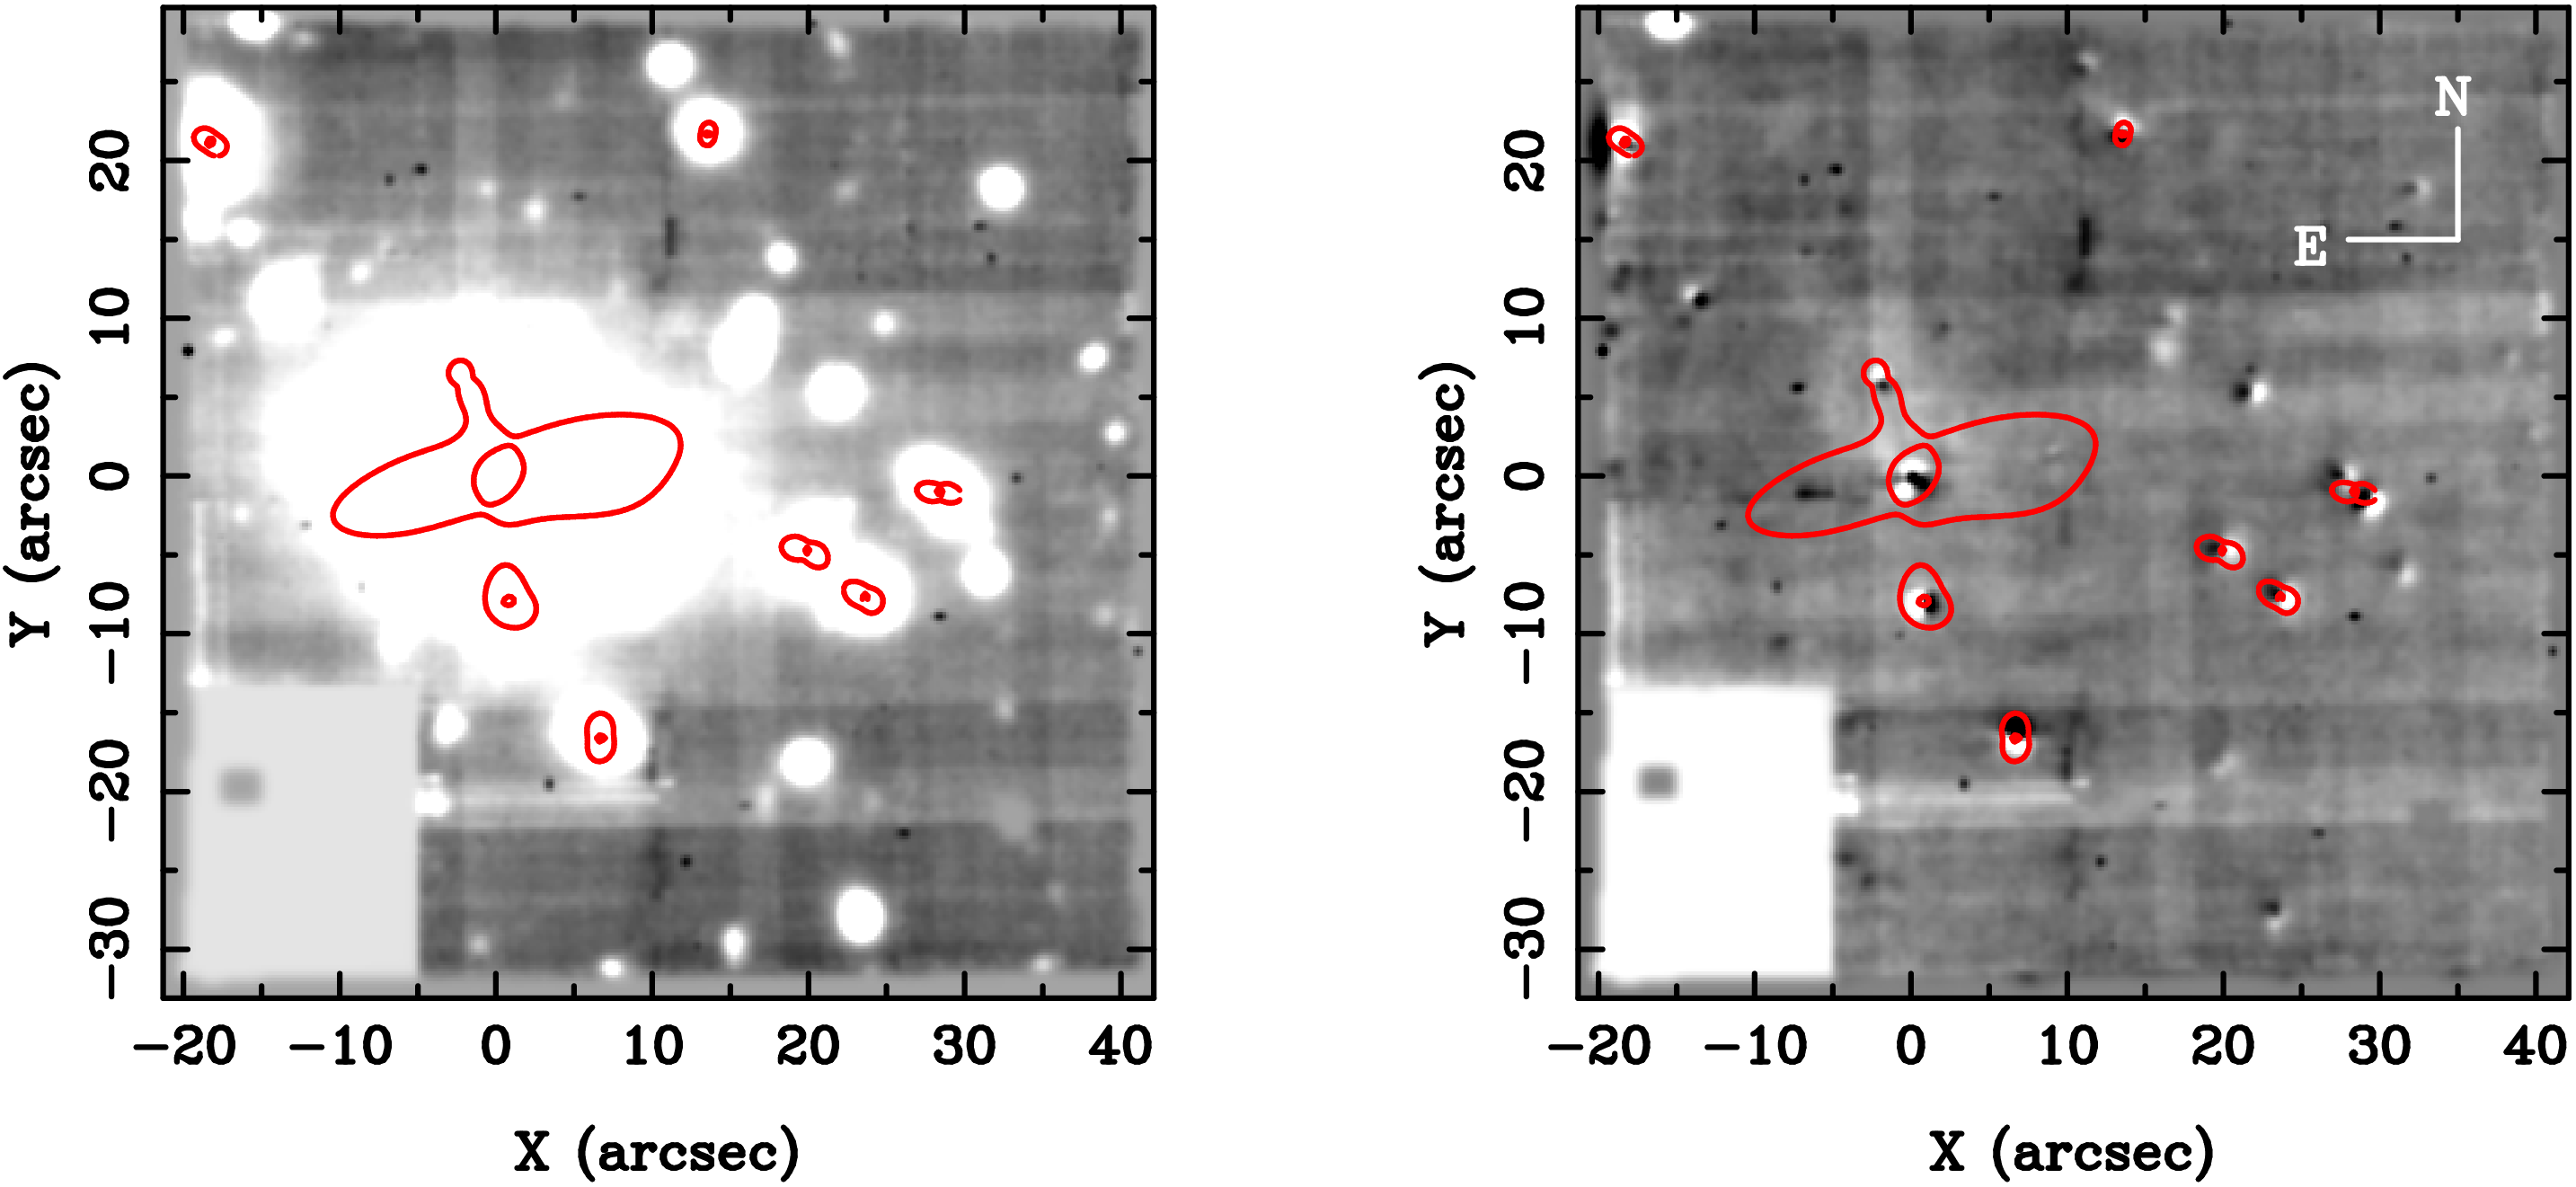
The wavelength range of the MUSE datacube () obtained from our observations of Abell 3084 enables great freedom in the choice of reference image when constructing a difference image. We selected the HST/ACS observation through the F606W filter (Section 2.3) as the reference image. We therefore created a F606W pseudo-image from the MUSE datacube for each night upon which we observed Abell 3084, by multiplying the datacubes with the transmission curve of the F606W filter, and integrating under the transmission curve. The difference images were then produced by minimizing residuals in all detected sources, following a similar procedure described by Bacon et al. (2017) in the MUSE observations of the Ultra Deep Field. This optimization is performed over: the Moffat model of the MUSE PSF, a possible astrometric shift between the two images, and the sky background level and average sky transmission. An example difference image is shown in Figure 3.
3.2 Searching for transients in imaging data
We searched the difference images for transient sources both manually and automatically. The manual search was performed by three authors (GPS, MB, AR), and identified no sources consistent with being a point source in the difference images. The only sources found were either residuals from the PSF matching close to the centres of bright galaxies, artefacts related to saturated stars, or a small number of residual bad pixels and cosmic rays. The automated search was performed with SExtractor (Bertin & Arnouts 1996), and found no sources other than PSF matching residuals and artefacts relating to saturated stars.
To calibrate the sensitivity of our GMOS search for candidate transients, we injected fake transients in to the data in the following manner, and attempted to recover them both manually and automatically. We cut out stamps from the GMOS data around the same, unsaturated, high signal-to-noise, stars used for the image quality matching. Each injected source was randomly chosen to be one of these bright star stamps, with the flux scaled accordingly, and shot noise added. To test the efficacy of manual recovery, we generated synthetic data sets, each containing (randomly and unknown to those searching) between zero and ten injected sources, with -band magnitudes drawn uniformly from the range . All injected sources with were identified by at least two searchers, while no sources with were identified by anyone. These results were independent of whether sources were injected randomly within of the brightest cluster galaxy (BCG), or into faint background galaxies (including the spectroscopically confirmed multiply-imaged galaxies) following the methods described by Sharon et al. (2010).
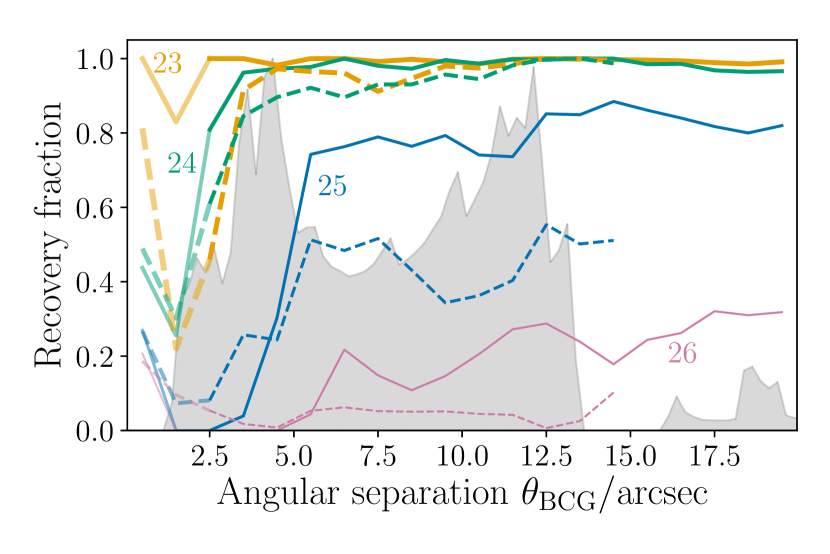
To test the automated search, we generated synthetic datasets comprising sources injected at each integer magnitude in the range . SExtractor was then run on these synthetic data sets, with the source being detected if SExtractor finds a source within of the injected source location. At small angular separations from the BCG () the probability of sources being detected is low due to the residuals in the difference images (Figure 6). The source recovery rate at the very centre (within of the BCG) is artificially boosted because SExtractor detects the residuals at the centre of the BCG (in the absence of an injected source) as a source. However, these scales are generally smaller than the high magnification region close to the radial critical curve, and therefore the residuals at the centre of the BCG are not a major limiting factor in our analysis.
Sources at the typical point source sensitivity of our GMOS data () are detected with the expected per cent completeness at , and sources at are detectable right down to angular separations of a few arcseconds. We put this in to context by plotting in grey in Figure 6 the solid angle that is magnified by the amount required to reinterpret the strain signal from GW170814 as coming from , which is the redshift at which the lens model of Abell 3084 is most robust (Section 2.3), also taking in to account the uncertainty on the luminosity distance to GW170814. Use of is by way of example only, and motivated by not wishing to extrapolate the lens model to redshifts at which it is not constrained. The peaks at and correspond to the radial and tangential critical curves respectively (see the inner and outer red curves in Figure 3). Our search is therefore sensitive at per cent completeness to point sources at that are adjacent to either critical curve and to point sources at that are adjacent to the tangential critical curve.
We performed similar manual and automated tests with MUSE images, injecting sources into the inner of the Abell 3084 MUSE/HST difference image, obtaining similar results to the GMOS tests described above. As a consequence of the smaller field of view of MUSE compared to GMOS, we did not have a large number of bright stars to use as templates for point sources, but instead used the best-fit Moffat profile discussed in Sec. 2.6. We interpret the slight shortfall in the fraction of fake sources that are recovered from the MUSE/HST difference images relative to the GMOS images as being caused by the flux sensitivity of the short HST observation being inferior to that of the MUSE observations, after smoothing the HST data to match the ground-based seeing.
3.3 Searching for transients in MUSE data cubes
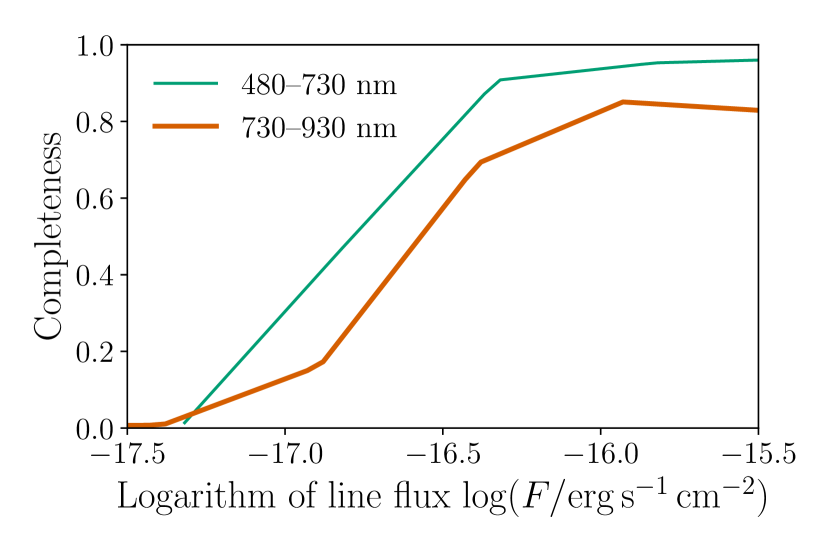
In addition to the search for continuum sources based on pseudo-images created from the MUSE datacubes, we have performed an automatic search for emission lines across all wavelengths. This is done using the muselet detection software, which has been used in the past to automatically search for line emitters in MUSE blank fields (Drake et al. 2017b, a) as well as lensing cluster fields (Mahler et al. 2018; Lagattuta et al. 2017). muselet is publicly available as part of the MUSE Python Data Analysis Framework (MPDAF, Conseil et al. 2016) software suite. It is a SExtractor-based detection tool based on a continuum-subtracted datacube where each wavelength plane is replaced by its corresponding narrow-band image, optimised for the detection of typical line width line sources. The sensitivity of muselet in recovering point-source line emitters has been extensively tested by Drake et al. (2017a) in the MUSE Ultra Deep Field (Bacon et al. 2017), and we rescale their results to the exposure times of individual datacubes in each night. The values show that our search is complete for line fluxes brighter than (Figure 7).
Removing obvious false detections (sharper than the spatial and/or spectral PSF) through visual inspection, we compare the detection of line emitters found in each datacube as well as the combination of both nights with the reference HST image. The only sources appearing as line emitters in MUSE and absent from HST are clear Lyman-alpha emitters with strong equivalent width identified from the shape of their spectral lines and/or as multiple images.
4 Discussion
We now discuss the empirical sensitivity of our observations of strong-lensing cluster cores in the context of the plausible EM counterparts to CBC GW sources. We first discuss the cancellation of the inverse square law by lens magnification for strongly-lensed point source EM counterparts to GWs (Section 4.1), and then apply this to kilonova-like EM counterparts (Section 4.2), and EM counterparts that might resemble emission from known low mass X-ray binaries within the Milky Way during outburst (Section 4.3).
4.1 The inverse square law and lens magnification
Consider a hypothetical GW source that is inferred to be at a luminosity distance assuming , and that has an EM counterpart of absolute magnitude in an arbitrary pass-band. If this is actually a distant source at that is gravitationally magnified by , then its apparent magnitude in a pass-band that probes the same rest-frame wavelength range as the pass-band relevant to (or, equivalently, assuming -corrections are negligible), is given by:
| (1) |
with expressed in units of parsecs. As discussed in Section 1, the lens magnification that appears in Equation (1) is given by:
| (2) |
The apparent magnitude of the EM counterpart of a lensed GW therefore depends only on the absolute magnitude of the counterpart and the luminosity distance at which the source is placed when (incorrectly) assuming :
| (3) |
The apparent magnitude of a lensed EM counterpart is therefore set by the initial analysis of the signal detected by LIGO-Virgo assuming . Therefore observations capable of detecting a given EM counterpart located at are also able to detect the same type of counterpart if it is lensed, independent of the true redshift.
4.2 Kilonovae
Optical follow-up observations of BH-BH sources have so far generally aimed to achieve the sensitivity required to detect a kilonova at (e.g., Soares-Santos et al. 2016; Cowperthwaite et al. 2016; Yoshida et al. 2017; Arcavi et al. 2017; Utsumi et al. 2018; Doctor et al. 2018). We therefore consider how bright a kilonova-like counterpart to GW170814 would have been if it had been lensed. The kilonova counterpart to GW170817 had an absolute magnitude in optical bands of in the few days after discovery (e.g., Villar et al. 2017; Arcavi 2018). We therefore adopt in the rest-frame -bands as a template for our calculations. If GW170814 was strongly-lensed, and had a kilonova-like EM counterpart, then based on its inferred luminosity distance, (Section 2.2), it would have an apparent magnitude of in the rest-frame -bands independent of its luminosity distance. Our observations reach a depth of (Table 2), with a sensitivity to transient sources in our difference image analysis of at completeness. These sensitivities are in the observer-frame and -bands, and can thus be compared with the rest-frame bands quoted above for sources at . It should therefore have been possible to detect a kilonova-like EM counterpart if GW170814 was strongly-lensed by one of the clusters that we observed.
A kilonova-like EM counterpart to GW170814 is more plausible if GW170814 actually comprised one or more NS in a NS-NS or NS-BH system. The primary means of identifying a GW source as a NS-NS, NS-BH or BH-BH is from the inferred component masses, as NSs have a maximum mass of (Rhoades & Ruffini 1974; Kalogera & Baym 1996; Margalit & Metzger 2017).444Neutron stars could also be disambiguated from the imprint of tidal effects on the signal. These are difficult to measure, and could not be conclusively identified for GW170817 despite its high signal-to-noise ratio, without assuming that the source comprised neutron stars (Abbott et al. 2017e, 2018c). For a particular GW signal, the inferred rest-frame mass of the compact objects is inversely proportional to where is the redshift of the GW source. Therefore, the rest-frame mass of GW sources would be revised downwards from the initial estimate by LIGO-Virgo, if they are subsequently identified as being strongly-lensed. The source frame masses of the individual BHs that comprise GW170814 are and (Abbott et al. 2018b), which correspond to and in the detector frame, i.e. times larger than the maximum NS mass. Therefore, if GW170814 were strongly-lensed, then it would have to be at for one or both of the two BHs to be reinterpreted as a NS. This implies a lens magnification of , which is possible for point sources located behind galaxy cluster lenses (Miralda-Escude 1991; Diego et al. 2018; Kelly et al. 2018; Rodney et al. 2018). Our observations and difference image analysis yielded no transient sources in the strong-lensing regions of Abell 3084 and SMACS J0304.34401 down to . Therefore, if we assume that the rest-frame ultraviolet luminosity of a kilonova-like EM counterpart is similar to the rest-frame optical luminosity of GW170817, we can exclude the interpretation of GW170817 as a NS-NS or NS-BH merger at that has been strongly lensed by either of these clusters.
More generally, our analysis shows that the cancellation of the inverse square law by the degeneracy between luminosity distance and lens magnification has important implications for the EM follow up of GW sources. Specifically, that the detection of EM counterparts to lensed NS-NS and NS-BH sources are within the reach of deep ground-based optical observations with -m class telescopes. Our difference image analysis is sensitive to transients as faint as and are thus sensitive to kilonova-like counterparts to lensed sources that are initially identified at , independent of their true distance.
In the future, it may be more fruitful to search for lensed optical kilonova-like counterparts to GW sources initially identified as low-mass BH-BH systems, with individual BH masses of , because such lower masses imply a less extreme lens magnification. For example, GW170608 (Abbott et al. 2017c) would have been an ideal target for our observing programme, if we had commenced our observing programmes at VLT and Gemini just a few months earlier. GW170608 comprised (assuming ) two BHs of masses and respectively, at , which corresponds to Abbott et al. (2018b). Following the reasoning outlined above, it is possible that this is a lensed NS-NS source at , that is magnified by . This level of magnification is similar to that suffered by the strongly-lensed individual blue giant star dubbed “Icarus” (Kelly et al. 2018). A kilonova-like counterpart to GW170608 would have an apparent magnitude of if it is strongly-lensed, independent of its redshift. This is brighter than discussed above for GW170814, but still sufficiently faint to be beyond the reach of most of the current generation of wide-field searches for EM counterparts (Section 2.1).
4.3 Low mass X-ray binaries
We also consider the possibility of detecting an EM counterpart that is much fainter than a kilonova. A BH-BH merger in vacuum is not expected to emit any EM radiation; however, numerous theoretical ideas for EM counterparts to BH-BH mergers not in vacuum have been proposed following the detection of GW150914 (e.g., Li et al. 2016; Loeb 2016; Lyutikov 2016; Murase et al. 2016; Morsony, Workman & Ryan 2016; Perna, Lazzati & Giacomazzo 2016; Woosley 2016; Yamazaki, Asano & Ohira 2016; Bartos et al. 2017; Dai, McKinney & Miller 2017; de Mink & King 2017; Janiuk et al. 2017; Ryan & MacFadyen 2017; Stone, Metzger & Haiman 2017). By way of illustration, we adopt a simple model of an EM counterpart, apply Equation (3), and compare with the sensitivity of our search.
We speculate that low mass BH X-ray Binaries (LMXRB) during outburst in the Milky Way could provide an illustrative upper limit on the brightness of the EM counterparts to BH-BH merger. The brightest LMXRB seen to date is V404 Cyg, with a BH mass of and peak extinction corrected absolute -band magnitude during outburst of (e.g., van Paradijs & McClintock 1994; Bernardini et al. 2016). We further assume that the luminosity of the accretion disc is proportional to the mass of the BH, and the accretion rate as a fraction of the Eddington limit. Therefore, combining these assumptions with the dependence of BH mass on redshift (discussed in Section 1), gives the following expression for the estimated absolute magnitude of the EM counterpart to a lensed BH-BH merger:
| (4) |
where is the true redshift of the lensed BH-BH, is the final BH mass of a BH-BH merger inferred assuming , denotes accretion rate as a fraction of the Eddington limit, and we adopt , and for V404 Cyg. Substituting Equation (4) in to Equation (3), and adopting , for GW170814 (Abbott et al. 2018b), a nominal source redshift of , and , gives . This is a factor fainter than the transient point sources that we are able to recover in our difference imaging (Section 3), which is unsurprising given that we did not set out to detect such faint EM counterparts. Moreover, to underline how challenging any possible detection of an EM counterpart to a BH-BH would be, would be required to bring the apparent magnitude of a source within reach of an observation of depth comparable with the Hubble Ultra Deep Field, i.e. . Alternatively, follow-up observations of a GW170814-like source initially placed at and with would also be detectable at , based on this speculative V404 Cyg-like scenario. Finally, in all of this discussion, we have assumed that -corrections are negligible, as the absolute magnitudes are in the (effectively) rest-frame -band of sources at that we observe in the -band.
5 Summary
In the nights immediately following the announcement of the detection of GW170814, we observed two strong-lensing cluster cores – Abell 3084 and SMACS J0304.34401 – identified using the sky localization available from the LVC. Our observations were conducted with the GMOS and MUSE instruments on the Gemini-South and Very Large Telescope, respectively. The data reach a sensitivity to point sources of , and our search for transient sources is sensitive down to in the continuum and line fluxes of . We detect no credible candidate transient sources in the data down to these limits. This is the most sensitive search to date for EM counterparts to GW sources, independent of considerations of possible lens amplification.
The lens magnification suffered by a lensed GW source cancels out the inverse square law, and therefore the apparent magnitude of a point source EM counterpart of given luminosity is set by the luminosity distance inferred from the GW data assuming no lens magnification. The apparent magnitude of EM counterparts to lensed GW sources is independent of the true redshift of the source. We therefore show, as a proof of concept, that we can exclude the idea that GW170814 is a NS-BH or NS-NS source at that is lensed by either of these clusters. We also show that observations with 30-m class and/or space-based telescopes will be required to conduct meaningful searches for lensed EM counterparts to BH-BH sources. We will consider the details of such observing strategies, and those required for lensed NS-NS and NS-BH sources in a future article.
In summary, we have confirmed the feasibility of searching for EM counterparts to candidate lensed GW sources with ground-based -m class telescopes, and described some important considerations for future development of this new observing strategy within the rapidly growing field of GW astronomy.
Acknowledgments
GPS dedicates this article to the memory of Robert Smith, and thanks Olivia Mueller for her support during August 2017. GPS also thanks Gary Mamon and colleagues at the Institut d’Astrophysique de Paris for their warm welcome during the latter stages of writing this article, and Alberto Vecchio for his advice and support. We thank Iair Arcavi and Leo Singer for assistance with Figure 1, Alyssa Drake for providing us with the results of completeness tests to blindly detect line emitters within MUSE datacubes using muselet, and Chris Done and Sylvain Chaty for helpful discussions about low mass X-ray binaries. We thank the staff and Directors of the Gemini and La Silla Paranal Observatories for their superb support of our observing programmes and awards of Director’s Discretionary time respectively. We acknowledge support from the Science and Technology Facilities Council through the following grants: ST/N000633/1 (GPS, MB, CPLB, WMF); ST/L00075X/1, ST/P000451/1 (MJ); and ST/K005014/1 (JV). JR acknowledges support from the ERC starting grant 336736-CALENDS. RJM acknowledges support from the Royal Society.
References
- Abbott et al. (2016a) Abbott B. P. et al., 2016a, ApJ, 818, L22
- Abbott et al. (2016b) Abbott B. P. et al., 2016b, Physical Review X, 6, 041015
- Abbott et al. (2016c) Abbott B. P. et al., 2016c, ApJ, 826, L13
- Abbott et al. (2016d) Abbott B. P. et al., 2016d, Physical Review Letters, 116, 061102
- Abbott et al. (2016e) Abbott B. P. et al., 2016e, Physical Review Letters, 116, 241102
- Abbott et al. (2016f) Abbott B. P. et al., 2016f, Living Reviews in Relativity, 19, 1
- Abbott et al. (2016g) Abbott B. P. et al., 2016g, Physical Review Letters, 116, 221101
- Abbott et al. (2018a) Abbott B. P. et al., 2018a, arXiv e-prints
- Abbott et al. (2018b) Abbott B. P. et al., 2018b, arXiv e-prints
- Abbott et al. (2017a) Abbott B. P. et al., 2017a, Nature, 551, 85
- Abbott et al. (2017b) Abbott B. P. et al., 2017b, ApJ, 848, L13
- Abbott et al. (2017c) Abbott B. P. et al., 2017c, ApJ, 851, L35
- Abbott et al. (2017d) Abbott B. P. et al., 2017d, Physical Review Letters, 119, 141101
- Abbott et al. (2017e) Abbott B. P. et al., 2017e, Physical Review Letters, 119, 161101
- Abbott et al. (2017f) Abbott B. P. et al., 2017f, ApJ, 848, L12
- Abbott et al. (2017g) Abbott B. P. et al., 2017g, ApJ, 850, L40
- Abbott et al. (2017) Abbott B. P. et al., 2017, Phys. Rev. Lett., 118, 221101
- Abbott et al. (2018c) Abbott B. P. et al., 2018c, ArXiv e-prints
- Ade et al. (2016) Ade P. A. R. et al., 2016, A&A, 594, A13
- Agnello et al. (2018) Agnello A., Grillo C., Jones T., Treu T., Bonamigo M., Suyu S. H., 2018, MNRAS, 474, 3391
- Arcavi (2018) Arcavi I., 2018, ApJ, 855, L23
- Arcavi et al. (2017) Arcavi I. et al., 2017, ApJ, 848, L33
- Bacon et al. (2017) Bacon R. et al., 2017, A&A, 608, A1
- Bartos et al. (2017) Bartos I., Kocsis B., Haiman Z., Márka S., 2017, ApJ, 835, 165
- Bauswein et al. (2017) Bauswein A., Just O., Janka H.-T., Stergioulas N., 2017, ApJ, 850, L34
- Bernardini et al. (2016) Bernardini F., Russell D. M., Kolojonen K. I. I., Stella L., Hynes R. I., Corbel S., 2016, ApJ, 826, 149
- Berry et al. (2015) Berry C. P. L. et al., 2015, ApJ, 804, 114
- Bertin & Arnouts (1996) Bertin E., Arnouts S., 1996, A&AS, 117, 393
- Böhringer et al. (2004) Böhringer H. et al., 2004, A&A, 425, 367
- Bruzual & Charlot (2003) Bruzual G., Charlot S., 2003, MNRAS, 344, 1000
- Chatziioannou, Yunes & Cornish (2012) Chatziioannou K., Yunes N., Cornish N., 2012, Phys. Rev. D, 86, 022004
- Chen et al. (2018) Chen G. C.-F. et al., 2018, MNRAS, 481, 1115
- Christensen et al. (2012) Christensen L. et al., 2012, MNRAS, 427, 1973
- Collett & Bacon (2017) Collett T. E., Bacon D., 2017, Physical Review Letters, 118, 091101
- Conseil et al. (2016) Conseil S., Bacon R., Piqueras L., Shepherd M., 2016, ArXiv e-prints
- Coughlin et al. (2018) Coughlin M. W. et al., 2018, ArXiv e-prints
- Coulter et al. (2017) Coulter D. A. et al., 2017, Science, 358, 1556
- Cowperthwaite et al. (2016) Cowperthwaite P. S. et al., 2016, ApJ, 826, L29
- Dai, McKinney & Miller (2017) Dai L., McKinney J. C., Miller M. C., 2017, MNRAS, 470, L92
- de Mink & King (2017) de Mink S. E., King A., 2017, ApJ, 839, L7
- Del Pozzo et al. (2018) Del Pozzo W., Berry C. P. L., Ghosh A., Haines T. S. F., Singer L. P., Vecchio A., 2018, MNRAS, 479, 601
- Diego et al. (2018) Diego J. M. et al., 2018, ApJ, 857, 25
- Doctor et al. (2018) Doctor Z. et al., 2018, arXiv e-prints
- Drake et al. (2017a) Drake A. B. et al., 2017a, A&A, 608, A6
- Drake et al. (2017b) Drake A. B. et al., 2017b, MNRAS, 471, 267
- Fan, Messenger & Heng (2014) Fan X., Messenger C., Heng I. S., 2014, ApJ, 795, 43
- Fan et al. (2017) Fan X.-L., Liao K., Biesiada M., Piórkowska-Kurpas A., Zhu Z.-H., 2017, Physical Review Letters, 118, 091102
- Fohlmeister et al. (2007) Fohlmeister J. et al., 2007, ApJ, 662, 62
- Gehrels et al. (2016) Gehrels N., Cannizzo J. K., Kanner J., Kasliwal M. M., Nissanke S., Singer L. P., 2016, ApJ, 820, 136
- Hanna, Mandel & Vousden (2014) Hanna C., Mandel I., Vousden W., 2014, ApJ, 784, 8
- Hannuksela et al. (2019) Hannuksela O. A., Haris K., Ng K. K. Y., Kumar S., Mehta A. K., Keitel D., Li T. G. F., Ajith P., 2019, arXiv e-prints
- Hilbert et al. (2008) Hilbert S., White S. D. M., Hartlap J., Schneider P., 2008, MNRAS, 386, 1845
- Inada et al. (2005) Inada N. et al., 2005, AJ, 130, 1967
- Inada et al. (2008) Inada N. et al., 2008, AJ, 135, 496
- Inada et al. (2006) Inada N. et al., 2006, AJ, 131, 1934
- Inada et al. (2007) Inada N. et al., 2007, AJ, 133, 206
- Inada et al. (2003) Inada N. et al., 2003, Nature, 426, 810
- Inada et al. (2014) Inada N., Oguri M., Rusu C. E., et al., 2014, AJ, 147, 153
- Inada et al. (2009) Inada N. et al., 2009, AJ, 137, 4118
- Janiuk et al. (2017) Janiuk A., Bejger M., Charzyński S., Sukova P., 2017, New A, 51, 7
- Kalogera & Baym (1996) Kalogera V., Baym G., 1996, ApJ, 470, L61
- Kayo et al. (2007) Kayo I. et al., 2007, AJ, 134, 1515
- Kayo et al. (2010) Kayo I., Inada N., Oguri M., Morokuma T., Hall P. B., Kochanek C. S., Schneider D. P., 2010, AJ, 139, 1614
- Kelly et al. (2018) Kelly P. L. et al., 2018, Nature Astronomy, 2, 334
- Krolak & Schutz (1987) Krolak A., Schutz B. F., 1987, General Relativity and Gravitation, 19, 1163
- Lagattuta et al. (2017) Lagattuta D. J. et al., 2017, MNRAS, 469, 3946
- Levan et al. (2017) Levan A. J. et al., 2017, ApJ, 848, L28
- Li et al. (2018) Li S.-S., Mao S., Zhao Y., Lu Y., 2018, MNRAS, 476, 2220
- Li et al. (2016) Li X., Zhang F.-W., Yuan Q., Jin Z.-P., Fan Y.-Z., Liu S.-M., Wei D.-M., 2016, ApJ, 827, L16
- Liao et al. (2017) Liao K., Fan X.-L., Ding X., Biesiada M., Zhu Z.-H., 2017, Nature Communications, 8, 1148
- LIGO Scientific Collaboration and Virgo Collaboration (2017a) LIGO Scientific Collaboration and Virgo Collaboration, 2017a, GRB Coordinates Network, Circular Service, No. 21474, (2017), 21474
- LIGO Scientific Collaboration and Virgo Collaboration (2017b) LIGO Scientific Collaboration and Virgo Collaboration, 2017b, GRB Coordinates Network, Circular Service, No. 21474, (2017), 21493
- Loeb (2016) Loeb A., 2016, ApJ, 819, L21
- Lyutikov (2016) Lyutikov M., 2016, ArXiv e-prints
- Mahler et al. (2018) Mahler G. et al., 2018, MNRAS, 473, 663
- Margalit & Metzger (2017) Margalit B., Metzger B. D., 2017, ApJ, 850, L19
- McGreer et al. (2010) McGreer I. D. et al., 2010, AJ, 140, 370
- Miralda-Escude (1991) Miralda-Escude J., 1991, ApJ, 379, 94
- More et al. (2016) More A. et al., 2016, MNRAS, 456, 1595
- Morokuma et al. (2007) Morokuma T. et al., 2007, AJ, 133, 214
- Morsony, Workman & Ryan (2016) Morsony B. J., Workman J. C., Ryan D. M., 2016, ApJ, 825, L24
- Murase et al. (2016) Murase K., Kashiyama K., Mészáros P., Shoemaker I., Senno N., 2016, ApJ, 822, L9
- Ng et al. (2018) Ng K. K. Y., Wong K. W. K., Broadhurst T., Li T. G. F., 2018, Phys. Rev. D, 97, 023012
- Nissanke, Kasliwal & Georgieva (2013) Nissanke S., Kasliwal M., Georgieva A., 2013, ApJ, 767, 124
- Ofek et al. (2007) Ofek E. O., Oguri M., Jackson N., Inada N., Kayo I., 2007, MNRAS, 382, 412
- Oguri (2010) Oguri M., 2010, PASJ, 62, 1017
- Oguri et al. (2004) Oguri M. et al., 2004, PASJ, 56, 399
- Oguri et al. (2008) Oguri M. et al., 2008, AJ, 135, 520
- Oguri et al. (2005) Oguri M. et al., 2005, ApJ, 622, 106
- Oguri et al. (2013) Oguri M., Schrabback T., Jullo E., et al., 2013, MNRAS, 429, 482
- Pankow et al. (2018) Pankow C., Chase E. A., Coughlin S., Zevin M., Kalogera V., 2018, ApJ, 854, L25
- Perna, Lazzati & Giacomazzo (2016) Perna R., Lazzati D., Giacomazzo B., 2016, ApJ, 821, L18
- Repp & Ebeling (2018) Repp A., Ebeling H., 2018, MNRAS, 479, 844
- Rhoades & Ruffini (1974) Rhoades C. E., Ruffini R., 1974, Physical Review Letters, 32, 324
- Rodney et al. (2018) Rodney S. A. et al., 2018, Nature Astronomy, 2, 324
- Rodney et al. (2016) Rodney S. A. et al., 2016, ApJ, 820, 50
- Rusu et al. (2011) Rusu C. E. et al., 2011, ApJ, 738, 30
- Rusu et al. (2013) Rusu C. E., Oguri M., Iye M., Inada N., Kayo I., Shin M.-S., Sluse D., Strauss M. A., 2013, ApJ, 765, 139
- Ryan & MacFadyen (2017) Ryan G., MacFadyen A., 2017, ApJ, 835, 199
- Sharon et al. (2017) Sharon K., Bayliss M. B., Dahle H., et al., 2017, ApJ, 835, 5
- Sharon et al. (2010) Sharon K. et al., 2010, ApJ, 718, 876
- Sharon et al. (2005) Sharon K. et al., 2005, ApJ, 629, L73
- Singer et al. (2016) Singer L. P. et al., 2016, ApJ, 829, L15
- Singer & Price (2016) Singer L. P., Price L. R., 2016, Phys. Rev. D, 93, 024013
- Singer et al. (2014) Singer L. P. et al., 2014, ApJ, 795, 105
- Smith et al. (2018a) Smith G. P. et al., 2018a, ArXiv e-prints
- Smith et al. (2018b) Smith G. P., Jauzac M., Veitch J., Farr W. M., Massey R., Richard J., 2018b, MNRAS, 475, 3823
- Soares-Santos et al. (2016) Soares-Santos M. et al., 2016, ApJ, 823, L33
- Soto et al. (2016) Soto K. T., Lilly S. J., Bacon R., Richard J., Conseil S., 2016, MNRAS, 458, 3210
- Stone, Metzger & Haiman (2017) Stone N. C., Metzger B. D., Haiman Z., 2017, MNRAS, 464, 946
- Suyu et al. (2018) Suyu S. H., Chang T.-C., Courbin F., Okumura T., 2018, Space Sci. Rev., 214, 91
- Tie & Kochanek (2018) Tie S. S., Kochanek C. S., 2018, MNRAS, 473, 80
- Utsumi et al. (2018) Utsumi Y. et al., 2018, PASJ, 70, 1
- van Paradijs & McClintock (1994) van Paradijs J., McClintock J. E., 1994, A&A, 290, 133
- Veitch et al. (2012) Veitch J. et al., 2012, Phys. Rev. D, 85, 104045
- Veitch et al. (2015) Veitch J. et al., 2015, Phys. Rev. D, 91, 042003
- Villar et al. (2017) Villar V. A. et al., 2017, ApJ, 851, L21
- Wang, Stebbins & Turner (1996) Wang Y., Stebbins A., Turner E. L., 1996, Physical Review Letters, 77, 2875
- Weilbacher et al. (2014) Weilbacher P. M., Streicher O., Urrutia T., Pécontal-Rousset A., Jarno A., Bacon R., 2014, in Astronomical Society of the Pacific Conference Series, Vol. 485, Astronomical Data Analysis Software and Systems XXIII, Manset N., Forshay P., eds., p. 451
- Woosley (2016) Woosley S. E., 2016, ApJ, 824, L10
- Yamazaki, Asano & Ohira (2016) Yamazaki R., Asano K., Ohira Y., 2016, Progress of Theoretical and Experimental Physics, 2016, 051E01
- Yoshida et al. (2017) Yoshida M. et al., 2017, PASJ, 69, 9