Dust density waves in a dc flowing complex plasma with discharge polarity reversal
Abstract
We report on the observation of the self-excited dust density waves in the dc discharge complex plasma. The experiments were performed under microgravity conditions in the Plasmakristall-4 facility on board the International Space Station. In the experiment, the microparticle cloud was first trapped in an inductively coupled plasma, then released to drift for some seconds in a dc discharge with constant current. After that the discharge polarity was reversed. DC plasma containing a drifting microparticle cloud was found to be strongly non-uniform in terms of microparticle drift velocity and plasma emission in accord with [Zobnin et.al., Phys. Plasmas 25, 033702 (2018)]. In addition to that, non-uniformity in the self-excited wave pattern was observed: In the front edge of the microparticle cloud (defined as head), the waves had larger phase velocity than in the rear edge (defined as tail). Also, after the polarity reversal, the wave pattern exhibited several bifurcations: Between each of the two old wave crests, a new wave crest has formed. These bifurcations, however, occurred only in the head of the microparticle cloud. We show that spatial variations of electric field inside the drifting cloud play an important role in the formation of the wave pattern. Comparison of the theoretical estimations and measurements demonstrate the significant impact of the electric field on the phase velocity of the wave. The same theoretical approach applied to the instability growth rate, showed agreement between estimated and measured values.
I Introduction
Dust density waves (or dust acoustic waves) predicted theoretically by Rao, Shukla and Yu (RSY)dawrsy and observed experimentally for the first time barkan_merlino quite long ago remain a significant research topic in dusty plasma physics also in the present timemerlino25 . The reason for that is that self-excitation of these waves is observed in all types of discharges, – dckhrapakag_waves ; ethomas_waves , inductively coupled rfusachev_waves , capacitively coupled rfpkenefedov_waves ; piel_waves , – under laboratoryschwabe_highlyreswaves and microgravitypiel_clustering conditions, with micrometer-nosenko_qmachwaves and nanometer-sizedkortshagen_waves dust particles.
Ion-streaming instability associated with sheath or bulk electric field is usually identified as a self-excitation mechanism of the dust density waves rosenberg_sewaves ; khrapakag_waves . Although, so far, there seem to be no experimental observations that contradict to this hypothesis, on the other hand, to the best of our knowledge, there were no experiments conducted that would directly target the dependence of the self-excited wave patterns on the fundamental parameter which controls the self-excitation mechanism, namely, on the electric field.
Self-excitation of dust density waves is one of the aspects of dust-plasma interactions. It is, therefore, of interest, for technological plasma processing: it has been, e.g., shown that dust density waves enhance agglomeration of particles in plasmasdu_wagglomeration . From the point of view of complex plasma research, which uses suspensions of microparticles to model classical phenomena of condensed matter physicscprmp , self-excited density waves represent an unwanted plasma effect, which becomes an obstacle in creating calm 3D suspensions at low neutral gas pressure. In addition to that, dispersion relations for the dust density waves are already used as diagnostic tools to reconstruct the information on the local plasma parameters from the self-excited wave pattern benjamin_daw_pop ; benjamin_daw_pre . Therefore, deeper experimental investigation of the self-excitation of the dust density waves is required.
Plasmakristall-4 (PK-4) facility on board the International Space Stationpk4rsi is the best-suited setup for studying self-excited density waves in complex plasmas. Its versatile power supply controlling the dc discharge allows to vary the average electric field experienced by the microparticles, while keeping other parameters practically constant. In this paper, we present the first observations of the effect of electric field manipulation (namely, of the discharge polarity reversal), on the self-excited wave pattern.
II Experimental setup and procedure
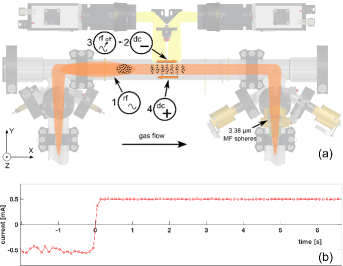
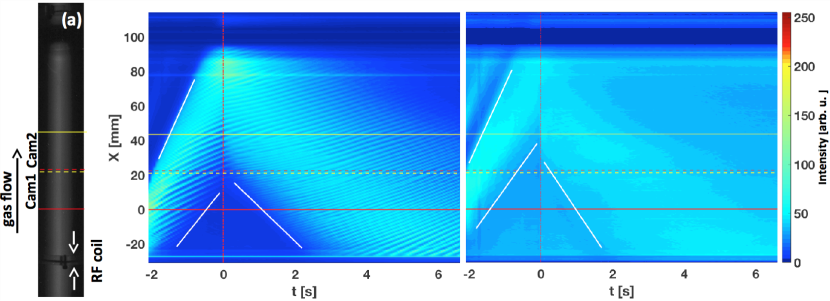
In the PK-4 facility pk4rsi , the plasma is created in a cylindrical (3 cm inner diameter and 20 cm working area length) glass chamber by means of a dc discharge (Fig. 1(a)). Neon at 40 Pa pressure was used as a working gas. The pressure was controlled by a pressure controller. The valve of the flow controller was kept closed during the experiment to minimize the gas flow through the plasma chamber, however, a small gas leak of about 0.1 sccm was still observed. Monodisperse plastic (melamine formaldehyde) microspheres with a diameter of m and a mass of g from a shaker dispenser were used. Inductively-coupled plasma with W forward power produced by a movable rf coil (location shown in Fig. 2(a)) was used to trap them. The microparticles were illuminated by a sheet of a green laser. The three-channel kaleidoscopic plasma glow observation (PGO) systempk4rsi was used to monitor the microparticle (neutral density channel) as well as plasma ( nm, Ne I spectral line channel) dynamics in the entire working area at fps frame rate and ms exposure time and a resolution of m/pixel. Two particle observation (PO) videocameras (recording at 70 fps) positioned as shown in Fig. 2(a) were registering the dynamics of microparticles only. The total size of the FoV of both PO cameras was approximately mm2 with the resolution of about m/pix. Experiments were conducted in the flight model of PK-4 under microgravity conditions on board the International Space Station.
Before starting the experiment, the microparticles have to be injected into the plasma, transported into the working area and then trapped there. Microparticle transport and trapping techniques are in detail described in Ref. pk4rsi, . In case of this particular experiment, a combined transport and trapping technique was used, in which transport was performed with the help of a dc discharge and trapping with the help of an inductively coupled rf discharge.
The experimental procedure is sketched in Fig. 1. After trapping the microparticles by the rf plasma, the dc discharge was switched on and rf power was simultaneously switched off. A constant current of -0.5 mA was kept for 2 s and then the polarity of the discharge was reversed. The constant current of 0.5 mA was kept during 8 s. The evolution of the discharge current during the experiment is shown in Fig. 1(b).
Figs. 2(b) and 2(c) represent the spatiotemporal patterns of the light intensity in the neutral density and nm channels of the PGO system, respectively. The patterns were obtained by averaging the intensities of 10 central pixels over the direction of axis for every frame in the respective channels. As follows from those two figures, switching on the dc current leads to the drift of the microparticle cloud and generation of the self-excited density waves inside it. Plasma emission follows the dynamics of microparticles.
Plasma parameters in the absence of microparticles were calculated using empirical formulae given in Ref. pk4rsi, . For a specific discharge condition (discharge current mA, and pressure Pa), the electron density, electron temperature, and axial electric field strength were estimated to be: cm-3, eV and V/cm, respectively. The number density of the microparticles () was estimated to be cm-3.
III Results and discussion
III.1 Drift of the microparticle cloud
| Edge | |||
|---|---|---|---|
| mA | mA | ||
| Microparticles (Fig. 2(b)) | head | ||
| tail | |||
| Plasma glow (Fig. 2(c)) | head | ||
| tail |
As it was already mentioned, the microparticle cloud starts drifting in a dc discharge. The direction of the drift is determined by the direction of the electrostatic force acting on the negatively-charged microparticles. We define the front edge of a drifting cloud as its head, and the rear edge of the cloud as its tail.
Fig. 2(b) clearly shows, that the microparticle cloud does not exhibit a rigid drift: Its head moved significantly faster compared to its tail. The cloud, therefore, stretches along the discharge axis. The velocities of the head and tail are with a good accuracy constant in time. Their values are summarized in Table 1.
III.2 Wave pattern
The generation of self-excited dust density waves can be seen in a PGO space-time diagram (Fig. 2(b)). From this figure, it is already obvious that the waves do not change the propagation direction after the polarity reversal. However, this figure does not allow to observe the details of the wave propagation due to the limited resolution of the PGO system.
Significantly higher resolution is provided by the PO cameras. Images in Figs. 3(a)-(c) show the dynamics of wave crests before, around and after the polarity reversal, respectively. Sequences of eight consecutive raw images from PO camera 1 were superimposed to obtain each of the three images. Color-coding in Figs. 3(a)-(c) reflects time. Wave crests propagating in the same direction are observed before and after the polarity reversal. Around the polarity reversal, the microparticles loose their drift velocity, but preserve the spatial oscillatory structure of their number density. In Fig. 3(d), a combination of the images from PO camera 1 and PO camera 2 is shown. Such images were used to produce a spatiotemporal pattern (Fig. 3(e)) by averaging the pixel intensities over the direction across narrow stripes (shown in Fig. 3(d)).
After the polarity reversal, the wave pattern exhibits several bifurcations. The wave crests arriving at the polarity reversal continue their propagation further. However, in the head of the microparticle cloud, new crests are formed between each of the two old ones (Fig. 3(f)). A similar phenomenon was observed in Ref. chengran_epl, at the interface separating the two parts of a microparticle cloud consisting of microparticles of two different sizes. The new crests propagate for about s and then merge with the old ones. Along a wave crest crossing the polarity reversal line at mm, three newborn crests are observed, which, however, merge with the old crest within a fraction of a second. Further (at mm) inner wave crests do not exhibit any bifurcations at all.
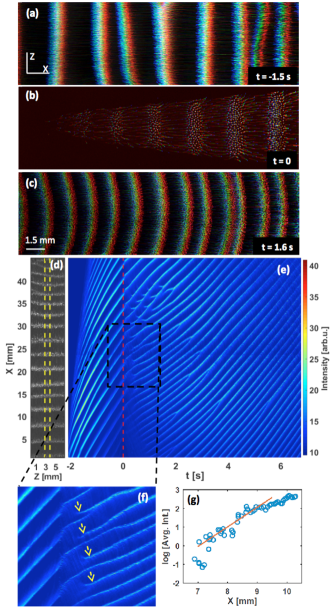
Fig. 3(g) presents the evolution of the amplitude of a wave crest born as a consequence of polarity reversal. After birth, its intensity grows exponentially with a typical rate of mm-1 and then continues increasing at a slower rate.
To investigate the local characteristics of the observed wave pattern, the space-time diagram in Fig. 3(e) was processed using the Hilbert transformation. This technique has already been applied to study waves in complex plasmas menzel_hilbert_pre ; jeremiah1_pre . For that, a complex function was constructed out of the image intensity (which is proportional to the local microparticle density ):
| (1) | ||||
where is the Hilbert transform of , and are the local values of the wave amplitude and phase, respectively. Local values of frequency and wave number can be obtained by differentiating phase over time and space, respectively: and . The resulting plots are shown in Figs. 4(a) and (b). Stripes stretching along the wave crests mean variation of and within the wave period, which suggests non-linearity of the waves (indicated also by large amplitude of the waves seen in Fig. 3). Regions where the values undergo rapid changes correspond to bifurcations – either to the birth of wave crests or to their merging.
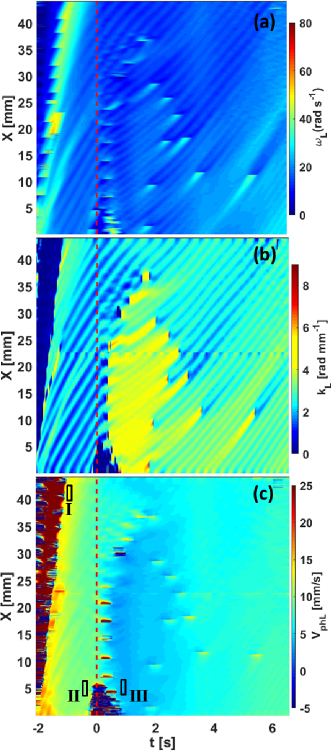
Local phase velocity of the wave can be defined as . The respective plot is shown in Figs. 4(c). Spatiotemporal pattern exhibits much less stripes than and and small outstanding islands correspond to bifurcations. Note that all the three values , and are measured in the reference frame of PK-4 cameras, which are at rest, whereas the medium in which the wave propagates is moving. , therefore, cannot be directly related to the plasma parameters.
| Reference frame | Velocity (mm/s) | ||
|---|---|---|---|
| Region I | Region II | Region III | |
| Cameras | |||
| Drifting medium |
III.3 Plasma non-uniformity
As already mentioned above, the head of the microparticle cloud drifting in a dc discharge moves faster than its tail (see Fig. 2(b) and Table 1). Plasma emission follows the motion of the micropaticles to some extent, as can be seen in Fig. 2(c). Before the polarity reversal, emission of the plasma is stronger in the head of the microparticle cloud (in accord with Ref. Zobnin2018, , also the striation ahead of the drifting cloud is visible). At the moment of polarity reversal, a sudden increase of the emission intensity at the edge of the cloud (which was a tail before polarity reversal and becomes a head after) is observed. Plasma non-uniformity reveals itself also in the wave pattern. Namely, the bifurcations leading to the birth of the new wave crests tend to appear in the head of the drifting cloud after the polarity reversal.
Therefore, in our experiment, a dc plasma containing a drifting microparticle cloud was found to be non-uniform in three observed parameters, namely drift velocity of the microparticles, plasma emission and pattern of the self-excited density waves.
III.4 Force balance
Although the microparticle cloud does not move rigidly in a dc discharge, their motion can be described by means of average drift velocities, obtained by tracing the peak of plasma emission in Fig. 2(c). This brings us to the following two equations:
| (2) | |||||
| (3) |
Here, and are the average drift velocities for negative and positive discharge polarities, respectively, s-1 under our experimental conditions, is the momentum transfer rate in dust-neutral collisions, and
| (4) |
where is the gas flow velocity. We have neglected the ion drag force for simplicity. Since the temperature sensors at the edges of the working area of the plasma chamber exhibit no measurable temperature difference, we have neglected also the thermophoretic force. We have measured mm/s and mm/s. Solving Eqs. 2 and 3, results in mm/s, which is in good agreement with the gas flow velocity estimated from the measured gas flow rate of sccm. Therefore, it is the gas flow which makes the waves propagate in the same direction (with respect to the cameras) irrespective of the polarity of the dc discharge. Using the microparticle-free value of the axial electric field, we can estimate .
III.5 Wave phase velocities
The phase velocities presented in Fig. 4(c) are measured with respect to PK-4 cameras. To be able to treat the phase velocities as local properties of the medium, one needs to transfer the entire Fig. 4(c) into the reference frame associated with the drifting microparticle cloud. This requires knowledge of average drift velocity at every time-space point. Due to high velocities of the microparticles and long tracks they leave in the camera images, it was impossible to trace particles and measure the drift velocities everywhere inside the cloud directly.
However, the flow velocities are reliably determined at the edges of the cloud (Table 1). The “true” phase velocities in the three regions marked in Fig. 4(c) are defined as
| (5) |
where is the local drift velocity of the microparticle cloud. can be taken equal to the drift velocity of the respective edge, whereas is determined by averaging over the respective region in Fig. 4(c). The results are summarized in Table 2. Obviously, the values of the phase velocity are quite (up to factor of ) different in the head and in the tail of a drifting cloud.
III.6 Acoustic velocity of dust density waves in the presence of the electric field
As mentioned above, the physical mechanism of dust density waves self-excitation is the streaming instability due to the ion flow, i.e. it essentially involves the electric field. Very often LADAW ; fink_autowaves_epl , an estimation of the dust acoustic velocity using RSY approach dawrsy for the uniform and isotropic plasma without an electric field already gives a reasonable agreement with the observed phase velocities. In principle, this is also true for the waves that we observe in PK-4. For a dense microparticle cloud where most of the negative charge sits on microparticles (since in our case, is larger than the unperturbed ion density, we assume ) dust acoustic velocity fink_autowaves_epl
| (6) |
where and are dust plasma frequency and ion Debye radius, respectively, and is the ion temperature. Taking eV and , yields mm/s, which is already of the order of the values in Table 2.
According to Eq. 6, is (explicitly) independent of the microparticle number density, and the only parameter, which may be responsible for the variation of the phase velocity is the microparticle charge (we do not expect variation of either or within the space-time domain of our experiment). However, according to the simulations in Ref. Zobnin2018, , in the head and in the tail are very close to each other since they approach the charge of a single particle in a dc discharge. Even taking into account the entire amplitude of the variation of inside a drifting cloud, it will be difficult to explain the observed variation of the phase velocity. Eq. 6, therefore, seems to be appropriate for the order of magnitude estimation of the phase velocity of the dust density waves, however, it turns out to be insufficient to qualitatively explain the observed spatiotemporal trends.
The physical reason for that is not only the formal presence of electric field. RSY-waves, if excited in our plasma, would be damped within the time of the order of , and would therefore never reach the observed high amplitudes. The pattern, we observe, is essentially a dissipative structure, which is fed with energy by the ion streaming instability and dissipates energy due to neutral drag. Therefore, we adopted a different approach to the velocity of the dust density waves in complex plasmas with electric field. In a dispersion relation from Ref. usachev_waves, we limited the Taylor expansion on and to quadratic terms. This leads to the following expression for the acoustic velocity:
| (7) |
where
| (8) |
was defined in Ref. fink_autowaves_epl, as a critical electric field required for the onset of self-excited wave generation.
According to Eq. 7, acoustic speed of dust density waves is proportional to the local electric field . Simulations Zobnin2018 , however, show that can vary about a factor of over the microparticle cloud drifting in a dc discharge. Therefore, the latter approach seems to be more promising to provide physical explanation for the observed variation of the phase velocity of the self-excited waves. Estimations using the microparticle-free values of the plasma parameters (see Sec. II), cm-3 and lead to the following numbers: V/cm, mm/s. To estimate , we took the value of the electric field for the microparticle-free positive column, i.e. V/cm. Assuming the doubled value of in the head of the cloud as suggested by Ref. Zobnin2018, , we obtain the range of between and mm/s, which is not too far from the experimentally observed range to mm/s (see Table 2). Since simplified models are used for the determination of (Eqs. 2 and 3) and , the agreement with the experiment could be considered as fairly well established.
It is notable, that the same approach applied to the growth rate of the dust density waves also gives reasonable estimation. Growth rate can be expressed as follows:
| (9) |
Assuming with taken for region III (see Table 2 and Fig. 4(c)) and rad/mm, we obtain ranging from mm-1 at V/cm till mm-1 at V/cm with the peak value of mm-1, reached at V/cm. The experimentally measured value of mm-1 (Sec. III.2) is within the estimated interval.
IV Conclusion
We presented the results of a microgravity experiment on board the International Space Station performed in the PK-4 complex plasma facility, in which the effect of dc discharge polarity reversal on the self-excited dust density waves were studied. A microparticle cloud was first trapped in a rf discharge and then allowed to drift in a dc discharge with subsequent reversal of the polarity. At both polarities of the dc discharge, the self-excited dust density waves were observed in a drifting cloud.
DC plasma, perturbed by a drifting microparticle cloud, exhibited significant non-uniformity, which revealed itself in the plasma emission, microparticle drift velocities (in accord with Ref. Zobnin2018, ) and also in the self-excited wave pattern. The phase velocity of the waves in the head of a drifting cloud appeared to be factor of two larger than that in its tail. Our theoretical estimations (using the acoustic limit of a dispersion relation from Ref. usachev_waves, ) have shown, that spatial variation of the axial electric field inside a drifting cloud be responsible for the observed variation of the phase velocity.
In spite of the change of the microparticle flow direction after the polarity reversal, the wave continued propagating in the same direction with respect to the camera. From the force balance, we found that the gas flow which is responsible for this asymmetry.
After the polarity reversal, the wave pattern exhibited bifurcations. New wave crests were born in the head of the cloud. They, however, merged with old crests after s of propagation. We could not explain their appearance, however, the observed growth rate of the newborn crests matched our theoretical estimations.
The dust density waves are supposed to be excited as a consequence of the ion-streaming instability, associated with the electric field. We have shown, that the local value of the electric field affects the wave pattern. However, further investigations (both theoretical and experimental) are obviously necessary to understand the nonlinear physics underlying the bifurcations and better justify the role of the electric field. PK-4 facility offers a unique opportunity to vary the average electric field experienced by the microparticles. This can be achieved by changing the duty-cycle of polarity switching pk4rsi . This opportunity will be used in a dedicated microgravity experiment, which should give a deeper insight into the problem.
V acknowledgement
All authors greatly acknowledge the joint ESA-Roscosmos “Experiment Plasmakristall-4” on board the International Space Station. We would like to thank Dr. J. Williams and Dr. A. Zobnin for valuable discussions and suggestions. We also thank Dr. I. Laut for the careful reading of our manuscript. S. Jaiswal acknowledges the financial support of DLR-DAAD Research Fellowship. This work was also partially supported by DLR Grants 50WM1441 and 50WM1742.
References
References
- (1) N.N. Rao, P.K. Shukla, M.Y. Yu, Planet Space Sci. 38, 543 (1990).
- (2) A. Barkan, R.L. Merlino, N. D’Angelo, Phys. Plasmas 2, 3563 (1995).
- (3) R.L. Merlino, J. Plasma Phys. 80, 773 (2014).
- (4) V.I. Molotkov, A.P. Nefedov, V.M. Torchinskii, V.E. Fortov, A.G. Khrapak, JETP 89, 477 (1999).
- (5) E. Thomas, Phys. Plasmas 13, 042107 (2006).
- (6) V.E. Fortov, A.D. Usachev, A.V. Zobnin, V.I. Molotkov, O.F. Petrov, Phys. Plasmas 10, 1199 (2003).
- (7) A. Piel, O. Arp, M. Klindworth, A. Melzer, Phys. Rev. E 77, 026407 (2008).
- (8) S.A. Khrapak, D. Samsonov, G. Morfill, H. Thomas, V. Yaroshenko, H. Rothermel, T. Hagl, V. Fortov, A. Nefedov, V. Molotkov, O. Petrov, A. Lipaev, A. Ivanov, Y. Baturin, Phys. Plasmas 10, 1 (2003).
- (9) M. Schwabe, M. Rubin-Zuzic, S. Zhdanov, H.M. Thomas, G.E. Morfill, Phys. Rev. Lett. 99, 095002 (2007).
- (10) K.O. Menzel, O. Arp, A. Piel, Phys. Rev. Lett. 104, 235002 (2010).
- (11) V. Nosenko, S.K. Zhdanov, S.-H. Kim, J. Heinrich, R.L. Merlino, G.E. Morfill, Eur. Phys. Lett. 88, 65001 (2009).
- (12) U. Kortshagen, Appl. Phys. Lett. 71, 208 (1997).
- (13) M. Rosenberg, Planet. Space Sci. 41, 229 (1993).
- (14) C. Du, H.M. Thomas, A.V. Ivlev, U. Konopka, G.E. Morfill, Phys. Plasmas 17, 113710 (2010).
- (15) G.E. Morfill, A.V. Ivlev, Rev. Mod. Phys. 81, 1353 (2009).
- (16) B. Tadsen, F. Greiner, S. Groth, A. Piel, Phys. Plasmas, 22, 113701 (2015).
- (17) B. Tadsen, F. Greiner, A. Piel, Phys. Rev. E 97, 033203 (2018).
- (18) M. Y. Pustylnik, M. A. Fink, V. Nosenko, T. Antonova, T. Hagl, H. M. Thomas, A. V. Zobnin, A. M. Lipaev, A.D. Usachev, V. I. Molotkov, O. F. Petrov, V. E. Fortov, C. Rau, C. Deysenroth, S. Albrecht, M. Kretschmer, M. H. Thoma, G. E. Morfill, R. Seurig, A. Stettner, V. A. Alyamovskaya, A. Orr, E. Kufner, E. G. Lavrenko, G.I. Padalka, E. O. Serova, A. M. Samokutyayev, and S. Christoforetti, Rev. Sci. Instrum., 87, 093505 (2016).
- (19) L. Yang, M. Schwabe, S. Zhdanov, H.M. Thomas, A.M. Lipaev, V.I. Molotkov, V.E. Fortov, J. Zhang, C. Du, Eur. Phys. Lett., 117, 25001 (2017).
- (20) J. D. Williams, Phys. Rev. E, 89, 023105 (2014).
- (21) K. O. Menzel, O. Arp, and A. Piel, Phys. Rev. E, 83, 016402 (2011).
- (22) A.V. Zobnin, A.D. Usachev, O.F. Petrov, V.E. Fortov, M.H. Thoma, M.A. Fink, Phys. Plasmas 25, 033702 (2018).
- (23) M. A. Fink, S. K. Zhdanov, M. Schwabe, M. H. Thoma, H. H öfner, H. M. Thomas and G. E. Morfill, Eur. Phys. Lett., 102, 45001 (2013).
- (24) V.E. Fortov, O.F. Petrov, V.I. Molotkov, M.Y. Poustylnik, V.M. Torchinsky, A.G. Khrapak, A.V. Chernyshev, Phys. Rev. E 69, 016402 (2004).