,
Lattice distortions and/or intercalation as ways to induce magnetism in α-FeSi2: a theoretical study.
Abstract
The possibilities to induce magnetism in the non-magnetic bulk by means of lattice distortions or intercalation with metal or non-metal ions of light elements is investigated theoretically by combined ab initio and model methods. We find that the distortions indeed can induce the formation of magnetic moment on iron atoms in certain local environments; however, the required strength of the distortions often is too large to be achieved in experiments. For this reason we suggest using “chemical pressure” that is, intercalating the films by light elements. We find that some of such variants have promising characteristic.
I Introduction.
The modern semiconductor industry is mainly based on the silicon key-1 . The spintronics development demands for new magnetic materials compatible with silicon. These facts motivate for a search of the transition metal silicides which are either magnetic or close to the magnetic instability. The ability of iron to form a vast variety of magnetic compounds with silicon both in the bulk and in the epitaxially stabilized forms makes them especially attractive. These compounds are already used in micro- and optoelectronics, an also in photovoltaics key-2 -key-6 . Iron disilicide is unstable and non-magnetic in the bulk form. For these reasons it was not in the first lines on the list of candidates for applications. The situation has changed after publications key-7 ; key-8 ; key-9 where it was shown that the film and nanoparticles of can be epitaxially stabilized. Moreover, it becomes magnetic. These experimental achievements have good perspective for the integration of the FeSi-based magnetic devices into silicon technology. However, a sensible choice of the optimal technology has to be based on a detailed understanding of the physics of the magnetic moment formation in these compounds, which is not achieved yet. One of the factors leading to the appearance of magnetism in these compounds can be lattice distortions. Particularly, for the experimental data key-7 ; key-8 ; key-9 and theoretical analysis key-10 show that they are essential ingredients for the formation of magnetism both in films key-7 and nano-particles key-8 ; key-9 .
The reason why certain lattice distortions can favor the magnetism formation is seen from the second order of perturbation theory. Itinerant magnetism arises due to peaks in the density of electron states. These peaks originate either from the presence of narrow bands, or from flat areas on the Fermi surface. If a band has a large bandwidth and does not contain narrow enough peaks in DOS in the vicinity of Fermi energy, a Stoner-like criterium for magnetism is not fulfilled and magnetic moment (MM) is not formed. Therefore, any mechanism which favors a decrease of width of an effective d-band, will favor also magnetism formation. If a d-electron may hop to a neighboring atom (nAt), and the atomic levels and are separated, then its band is renormalized roughly as follows:
Then an increase of the distance between Fe atom and nAt decreases the hopping matrix element and, therefore, the effective width of the d-band decreases too and makes the fulfillment of the Stoner’s criterium easier.
Earlier discussions were focussed on the effect of in-plane distortions caused by the misfit strains key-10 . However, according to recent experimental data key-11 besides the in-plane distortions, out-of-plane distortions also can arise in nanoparticles. The observed magnetic moments are quite small key-11 ; key-7 . Theoretical analysis of the magnetism formation in iron silicides key-10 shows that the small lattice distortions which arise during the film fabrication may cause small moments. One can expect that the increase of these distortions may lead to an increase of the magnetic moments. Since the crystal structure of iron disilicide has a cavity formed by Si planes, one way to increase these distortions is intercalation of with light atoms.
The present work is devoted to further theoretical analysis of the mechanisms of magnetism formation in the disilicide of iron . We inspect the possibilities to induce magnetism by means of “chemical pressure” via intercalation the by different light elements. We use ab initio (VASP, DFT-GGA, see Sec. II) approach along with a hybrid approach that combines ab initio and model calculations, developed in Refs. key-10 ; key-12 . Then we map the DFT-GGA results onto the multiorbital model, suggested in Ref. key-12 . The mapping is based on the idea to exploit the Hohenberg-Kohn theorem, equalizing the charge densities, one generated by the Kohn-Sham equations and obtained from the Hartree-Fock equations for a model Hamiltonian. Due to success of the Kohn-Sham approach in description of real materials we treat the corresponding charge density as a “genuine” one and find the parameters of the model Hamiltonian from minimization of difference beween the Kohn-Sham and the model Hartree-Fock charge densities.
The analysis of the model allows for detailed understanding of the role played by different parameters of the model in the physics of magnetism formation.
The paper organised as follows. In Sec. II, we provide the details of the ab initio and the model calculations. The effect of the lattice distortions in on magnetic moment formation in both approaches is described in Sec. III A. The Sec. III B presents the results of the calculations for with intercalated atoms. Section IV contains the conclusions.
II Calculation details.
II.1 Ab initio part
All presented here ab initio calculations have been performed using the Vienna ab initio simulation package (VASP) key-13 with projector augmented wave (PAW) pseudopotentials key-14 . The valence electron configuration is taken for the Fe atoms and the one for the Si atoms. The calculations are based on density functional theory (DFT) in the generalized gradient approximation (GGA), where the exchange-correlation functional is chosen within the Perdew-Burke-Ernzerhoff (PBE) parametrization key-15 . Throughout all calculations, the plane-wave cutoff energy was 500 eV, and the Gauss broadening with a smearing of 0.05 eV was used. The Brillouin-zone integration was performed on a Monkhorst-Pack grid key-16 of special points. The optimized lattice parameters and atomic coordinates were obtained by minimizing the total energy.
II.2 Model part
In key-12 we suggested to combine the ab initio and model calculations by means of the following scheme. First, we perform ab initio calculations of electronic and magnetic properties within the framework of DFT-GGA. Then we map the DFT-GGA results onto the multiorbital model suggested in Ref. key-12 . The details of model calculations are described in Ref. key-12 . Here we give only the Hamiltonian and the general parameters of the model. We use the set of the Kanamori interactions key-17 between the -electrons of Fe (five -orbitals per spin). The crystal structure contains neighboring Fe ions, for this reason the direct interatomic -exchange and -hopping have to be included. The Si -electrons (three -orbitals per spin) are modeled by atomic levels and interatomic hoppings. Both subsystems are connected via -hoppings. Thus, the Hamiltonian of the model is:
| (1) |
where
The Kanamori’s part of the Hamiltonian is
| (2) |
The Hamiltonian of the interatomic exchange and hopping parts is
| (3) |
where
| (4) |
Here () are the creation (annihilation) operators of -electrons of Si and and stand for -electrons of Fe ions; is the complex lattice index (site, basis); labels the orbitals; the indices are spin projections; are Pauli matrices; and are the intra-atomic Kanamori parameters; is the parameter of the intersite exchange between the nearest Fe atoms. At last, are hopping integrals between Si - Si, Fe -Fe and Fe - Si atomic pairs, correspondingly.
The dependencies of hopping integrals on were obtained from the Slater and Koster atomic orbital scheme key-18 in the two-center approximation using a basis set consisting of five orbitals for each spin on each Fe atom and three orbital for each spin on each Si atom. Then, within the two-center approximation, the hopping integrals are expressed in terms of the Slater – Koster parameters , and for Fe - Fe hopping and , for Fe - Si and Si - Si hoppings. In calculations of the model phase diagrams (maps) for magnetic moments we neglected the weak bonds for Fe - Fe hopping and kept fixed the relations for the nearest neighbors (NN) Fe -Si () and for the next nearest neighbors (NNN) Fe - Fe () and Si - Si () and . We assume that hopping integrals depend on the distance between the ions exponentially,
| (5) |
where and . We have found the parameters for , ) for key-10 and for . The on-site parameters during all model calculations were the following: , . In the rest of the paper all hopping parameters are given in eV.
III Results and discussion
III.1 The effect of lattice distortions on magnetism formation
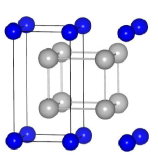
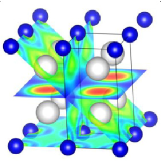
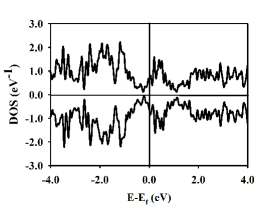
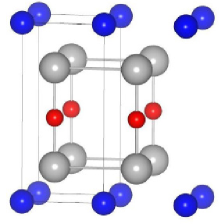
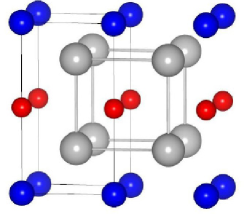
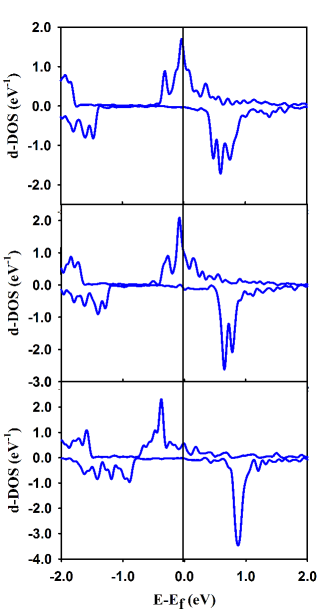
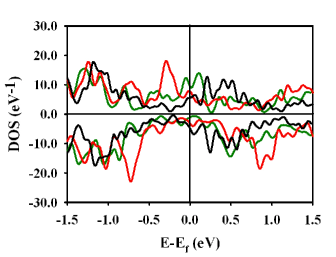
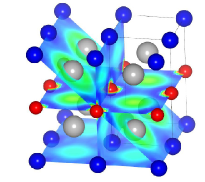
The compound has a tetragonal unit cell with the lattice parameters and Its structure is shown in Fig.1a. The iron atoms are located at , the Si atoms are located at the points and . As seen from Fig.1a there is a cavity between Si atoms in the structure due to the large distance between Si atoms along the tetragonal axis (). The calculated equilibrium distance between Fe -Si atoms . Our DFT-GGA calculations confirm that the ground state of is non-magnetic metal key-19 . The full density of electron states (DOS) of is shown in Fig. 2a. The peak in the DOS in the vicinity of the Fermi energy is mainly due to the electrons (fig.2b, black line). The other interesting peculiarity of the structure is the presence of a network of quasi-one-dimensional channels, which is easily seen on the map of electron localization function key-20 (Fig.1b).
 |
 |
| (a) | (b) |
While in the bulk form is non-magnetic, there are several experimental studies where ferromagnetism is found in thin films key-7 and nano-particles key-8 ; key-9 . Recently key-11 nano-sized grains - faceted have been synthesized on a silicon substrate. The magnetic measurements indicated the existence of small magnetic moment (MM), per Fe atom. According to experimental data key-11 the spacing between Fe layers along the tetragonal axis in the obtained nano-grains is changed compared to that in the bulk: being larger between the layers which are close to the substrate surface, it decreases with distance away from the substrate and then again increases. Simultaneously, the stresses of arise in the plane perpendicular to the axis due to the misfit with the silicon substrate. These stresses induce an increase of the distance between the iron atoms in this plane.
In our earlier work key-10 we have shown that the ferromagnetism can be induced by external stresses as well as by insertion into the structure of additional atoms of iron or silicon. Contrary to the suggestion key-8 ; key-9 which explains the appearance of the magnetism in nanoparticles of by formation of Fe clusters, the results of our theoretical analysis, together with experimental results key-11 , indicate that the stresses alone may switch on the mechanisms of the MM formation in . In the present work we will investigate the influence of other types of lattice distortions, on the ferromagnetism formation in . Particularly, we expect that the MMs in have to be sensitive to the changes of the distance between the layers of irons and/or silicon.
 |
| (a) |
 |
| (b) |
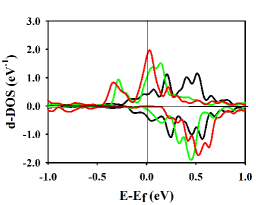
In order to understand how the Fe interlayer distances observed in key-11 influence the magnetic properties of we performed ab initio calculations of the model supercell with the different (ranging from 5.13 to 5.4) between Fe planes along tetragonal axis. The stress coming from the substrate are modeled by a increase of the distance between in-plane iron atoms ) compared to the one in the bulk . The optimization of the supercell with respect to the atomic coordinates results in the changing of the interlayer distances between Fe and Si planes (on average by about 3%) compared to the bulk ones. These changes induce MMs about on the Fe atoms in accordance with experimental data. The partial contribution to DOS from the -electrons of Fe for this model supercell is shown by the green (on-line) curve in Fig.2b. The lattice distortion of the parent shifts the -electron peaks in the spin-up and spin-down DOS relative to each other and increases the spin polarization by about in the model supercell. The latter is one of the most important characteristics for the spintronic applications. An increase of the lattice parameter up to leads to further amplification of these peaks in the DOS and to the strong increase of the spin polarization (Fig.2b, red line). Thus, the ab intio calculations indicate that increase of merely the distance between in-plane Fe atoms results in the appearance of small magnetic moments. In order to obtain moments of at least , the lattice parameter of has to be increased by ( ), while an increase of the moment till requires the increase of the iron-iron distance up to , i.e., approximately, by ! Although the distortions always arises when film is experimentally synthesized on the Si substrate, it never reaches such a large value. The experiment key-11 , however, shows that the MM arises in the nanoparticles of at a smaller misfit strain, . This fact prompts that, possibly, some other mechanisms of the moment formation can be switched on by/during synthesis of the films. The simplest ones are just other, different types of distortions. There are several types of the bulk--lattice distortions which may cause the magnetism appearance in our model supercells. It can be either an increase of the distance between Fe atoms in the plane, or a change of the distance between silicon atoms, or even the distance between iron and silicon atoms. Below we examine these possibilities in details.
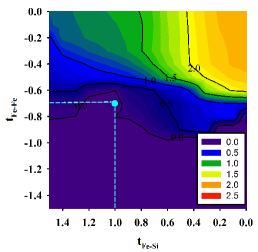
A convenient tool for that is the mapping of the results, obtained by the first-principle calculations, to the multiple-orbital model, described in key-12 and shortly outlined in Sec. 2.2. According to the results key-10 , the main parameter which controls the MM formation is the hopping integral between the in-plane Fe atoms ( Fig. 3). Blue point on Fig.3 shows the values of hopping integrals (, , ) which provide the best fit to the ab initio charge density for bulk .
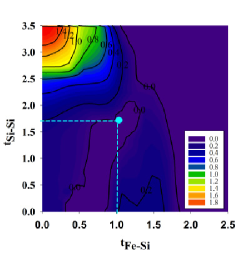
The parameters for Fe - Si hopping and Si - Si hopping intuitively seem to be non-relevant to MM formation. As will be seen below, this expectation is not supported by calculations. Via the self-consistent solution of the model equations for the population numbers of orbitals and the magnetization within the Hartree-Fock approximation we obtained the MM map in the coordinates vs at the fixed value of (Fig.4a). The latter value corresponds to the equilibrium Fe - Fe distance for bulk . Notice that a decrease of the distance between silicon atoms, , increases the distance between Fe and Si atoms, and vice versa (Fig.1a). As seen from the map in Fig.4a, there is no magnetism at the equilibrium distance in undistorted . However, a decrease of the hopping integral with simultaneous increase of leads to the arising of the magnetism at the same distance . As seen from the upper left corner of the map Fig.(4a), a large MM can be achieved by decrease of the distance between Si atoms which causes the changes of the hopping integral magnitudes. So, hoppings integrals and correspond to distances and . And vice versa an increase of the distance (decrease of and increase of ) leading to decrease of the MM to .
 |
| (a) |
 |
| (b) |
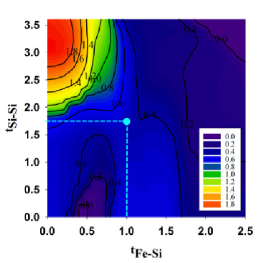
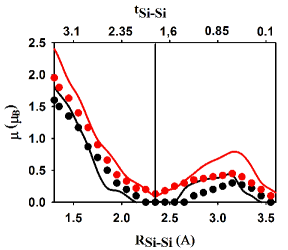
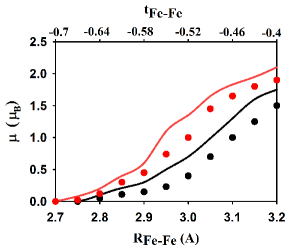
Thus, the analysis of the model within the Hartree-Fock approximation shows that the ferromagnetic state in may be induced by: (a) the increase of the distance between iron atoms (Fig.3), and (b) the change of the distance between NN silicon and iron atoms and between silicon atoms (Fig.4a). An application of both types of changes expands the area of existence of the ferromagnetic solutions. This is illustrated by Fig.4b, which displays the map of MMs evaluated at . This corresponds to , according to Eq.(5), i.e., to the misfit strain At this distance the magnitudes of the MM arise at the smaller hoppings (Fig.4b) () and (). In order to confirm the model findings we performed ab initio calculations of the moment dependence on the distances between silicon atoms in . Fig.5 displays the comparison of the results of model and ab initio calculations for the dependence of the MM at iron atoms on silicon-silicon distance at equilibrium and expanded distances between in-plane iron atoms. Similar to the model result, a decrease of causes a sharp increase of the MM. Notice that a slight increase of also may induce MM, but in this case the moment is small. An increase of the distance between iron atoms leads to appearance of a large moment at the same distance . Fig. 5 confirms that the results of the model and the ab initio calculations are in quite good agreement with each other.
The analysis performed in this part can be summarized as follows. Both the model and ab initio calculations indicate that the ferromagnetism in can be induced by different types of the lattice distortions: not only by an increase of the in-plane distance between iron atoms, but also by a change of the distance between layers along the tetragonal axis. The latter alters iron-silicon and silicon-silicon interatomic distances (see Fig.5 ). The decisive parameter for MM formation is the iron-iron distance in the plane perpendicular to the tetragonal axis c (Fig.3, 4). However, in order to obtain the moments large enough for practical applications, the required misfit strain has to be made quite large, Such big magnitudes can hardly be achieved experimentally. At the experimentally feasible range of the misfit strain the MM remains to be small. The other solution would consists of simultaneous decrease of the Si - Si distance () and increase of the Fe - Si and Fe - Fe distances. Indeed, as seen from Fig.6, where the dependence of the on-iron-MM on the distance at and is displayed; the decrease of gives rise to a larger MM at the same Fe - Fe distance.
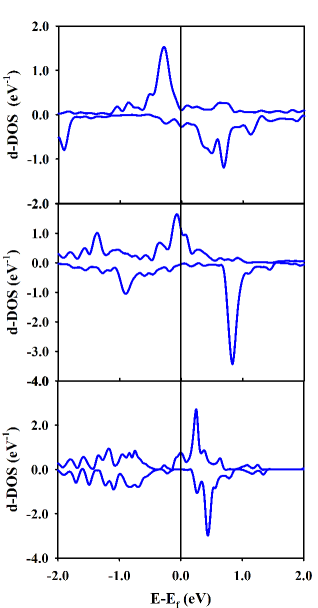
Another way to understand why some of the lattice distortions favor to the magnetism appearance is to analyze the evolution of the partial density of -electron states (-DOS) with these distortions. As shown at Fig.7 the decrease of the distance between silicones () shifts the peaks of the states, which move towards the Fermi level. This, in turn, gives rise to spin polarization. However, an increase of or the distance between the iron atoms shifts not the -, but the -peaks. In this case the -states appear near the Fermi level, providing a non-zero spin polarization.

The analysis given above highlights the main difficulty which is expected to arise in experiment on inducing a magnetism in with reasonably large MM via the lattice distortions. Particularly, the MM should arise at , or ( ). Such distances between atoms are hardly possible to implement in films with any type of substrate. The distortions which arise when the is grown on the silicon substrate are much smaller: in the experiments key-11 on nanoparticles the magnitudes of the distortions between in-plane iron atoms are about , while for interlayer distances this is about . Such small distortions induce, correspondingly, small MM. The question arises, would it be possible to overcome this difficulty with a “chemical pressure”?
III.2 The effect of intercalation on the magnetism formation
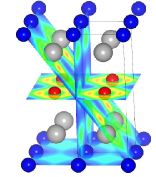
As was mentioned above, there is a cavity between Si atoms in the structure (Fig.1a). An intercalation of other atoms into this cavity will distort the lattice. Here we investigate if intercalated atoms can introduce the change of the distances and sufficient for magnetism appearance. In order to check this hypothesis we performed ab initio calculations of with embedded atoms of different elements. The results suggest that there are two positions for guest atoms which are the most energetically favorable. The types of positions for embedding the guest atoms are shown at Fig.8. Notice that all considered structures have been fully optimized.
 |
 |
| a | b |
The non-metal atoms are found to prefer the positions on the bonds between the silicon atoms (Fig.8a), whereas the position inside of the tetragonal cavity formed by the silicon atoms is more energetically favorable for the atoms of metals (Fig.8b). The intercalated atoms create a negative chemical pressure which results in an increase of the distance between host atoms compared to pure . The results of calculations are summarized in the Table 1, where the parameters of the lattice cell, the values of the MMs at the iron atoms and the spin polarization in some of the considered structures are shown.
| Atom X | Lattice parameters () | ||||||
| Position 1 (Fig.8а) | |||||||
| H | 2.72 | 6.28 | 0.20 | 2.37 | 1.76 | 0 | 0.52 |
| O | 2.76 | 5.91 | 0.45 | 2.36 | 1.63 | 61 | 1.76 |
| P | 2.71 | 7.27 | 0.47 | 2.28 | 2.35 | 75 | 1.63 |
| As | 2.76 | 7.58 | 0.53 | 2.36 | 2.46 | 38 | 1.73 |
| Sb | 2.89 | 7.80 | 0.90 | 2.40 | 2.64 | 38 | 2.12 |
| N | 2.74 | 6.05 | 0.00 | 2.39 | 1.63 | 0 | 1.96 |
| Position 2 (Fig.8b) | |||||||
| Li | 2.93 | 5.34 | 0.90 | 2.43 | 2.50 | 11 | 0.84 |
| Na | 2.90 | 6.80 | 0.65 | 2.41 | 2.94 | 71 | 1.19 |
| K | 2.87 | 8.07 | 0.14 | 2.44 | 3.36 | 68 | 2.68 |
| Ca | 3.00 | 6.85 | 1.00 | 2.46 | 3.04 | 11 | 1.03 |
| Sr | 3.09 | 7.02 | 1.05 | 2.50 | 3.16 | 11 | 1.09 |
| Cu | 2.95 | 5.38 | 0.90 | 2.24 | 2.52 | 24 | 1.06 |
| 2.70 | 5.13 | 0.00 | 2.36 | - | 0 | 0.87 | |
As seen from Table I, an intercalation not always leads to magnetic state formation. E.g., the structures with the intercalated nitrogen atoms are not magnetic (see Tab.1). Nevertheless, the general tendency of the MM increase with the increase of lattice distortions, studied in the previous Section, is reproduced by the direct calculation. As expected, the magnitude of the MM at iron atoms grows with an increase of the Fe - Fe distance, but an increase of only does not provide the magnitudes of MM listed in the Tab.1. For example, an increase of in-plane distance up to in pure leads to MM at Fe atom only (Fig.6) whereas intercalation by some atoms increases MM times at the same . The latter occurs due to additional structure distortions and corresponding restructuring of DOS due to intercalated atoms.
 |
 |
| (a) | (b) |
The calculations show that the distortions caused by intercalation change the -DOS only slightly, the main changes occur in the -DOS. Similar to pure it is namely the -DOS that forms the peaks in the vicinity of the Fermi level. This is illustrated in Fig.9 for several intercalates: similar to pure the increase of the distances and causes shifts of the - and - peaks. In the case on non-metallic intercalates (P, As, Sb) this shift grows with an increase of the distances and (Fig.9a). For the metallic intercalates Li, Na, K the tendency is opposite (Fig.9b). As seen from Fig.9 and Table 1, the intercalation by and is expected to provide high spin polarization due to crossing the Fermi energy by the - peaks of DOS. The quite strong spin polarization (7-th column in Table 1) may occur not only in the cases of intercalation by mentioned above P and Na , but also by O and K. Small increase of the in-plane lattice parameter which arisen when the is intercalated by H, As, O or P allows for use of the silicon substrate. The intercalation by Li, Na, K and Sb atoms results in the 7% increase of the in-plane lattice parameter compared to pure , but the compressive strain from the substrate can decreases this distortion. This, however, does not kill MM completely, but decreases it by 30-40%. Therefore, one can expect that the choice of a substrate with a larger lattice parameter than that of silicon (e.g., Ge) would allow to decrease this misfit strain and increase the magnitude of MM.
Since it is hardly possible to achieve 100% concentration of intercalated atoms in the experiment, we estimate the value of MM arising at the Fe atoms for the lower concentration of intercalated atoms, namely for % and % concentrations of intercalated atoms. In order to consider a possible ordering of intercalated atoms with these concentrations we constructed a supercell of . Further calculations depend on the way how the sample is made. An annealing of a sample may switch on the thermodynamic equilibration processes, possibly, ion migration, etc.. This may exclude the contribution of the less energetically favorable configurations. An estimation of the barriers for migration of ions and the contribution of phonons is needed for a quantitative description of these processes. This requires special consideration. In the case when a sample is made by quenching the situation is simpler: due to fast cooling of the sample the energy hierarchy of different possible configurations is much less important and their contributions to an averaged physical quantity may be calculated either with the help of simple statistical weights, or by means of some of realization of the coherent potential approximation. The latter, however, also involves additional assumption about the distribution function and the way, how the effective medium is introduced, but has the advantage that it does not require supercell calculations and can be used for arbitrary (but not too small) concentration. Here we consider the first case.
Let us denote the statistical weights of the configurations as , where is the concentration of intercalated atoms, and is number of equivalent configurations of the type , and is value of the physical quantity in the configurations . Then the total number of configurations is and
| (6) |
For the concentration of intercalating atoms we have arrangements. Five of them are different. Considering all possible configurations we find that for the the statistical weight for tree of them, and for two of them. For concentration of intercalated atoms there are possible ways to distribute atoms. Nine of them are different: for three configurations , for two it is , , , and (). We find that the perspective candidates are Li metal and the O non-metal intercalates. As seen from Table 1, the intercalation by these atoms results in the relatively large MMs for comparatively small lattice distortions. We performed the full optimization for all ordered structures. In Tab.2 we give the difference between maximal and minimal energies of the structures for each of cases. The total energy values of different ordered structures are within eV range per unit cell of . The average lattice parameters , and Fe MMs and spin polarization, calculated according to Eq. 6 are given in Table 2.
| O | Li | |||
| 25% | 50% | 25% | 50% | |
| (eV) | 0.23 | 0.5 | 0.05 | 0.42 |
| 0.14 | 0.28 | 0.31 | 0.67 | |
| 61 | 63 | 57 | 35 | |
| 2.72 | 2.74 | 2.77 | 2.82 | |
| 5.43 | 5.66 | 5.14 | 5.19 | |
Although at % concentration of lithium atoms the lattice parameters have only little change as compared with (Tab.2), the average MM on Fe atoms is equal to ; the increase of concentration up to 50% results in the increase of MM up to . Notice that at the equilibrium lattice parameters of pure but without structure optimization by the atom coordinates the MM on Fe atoms does not arise even at 100% concentration of Li atom. This proves that emergence of the magnetism in intercalated primarly associated with the lattice distortions.
Notice that in order to obtain a sample with large spin polarization, the optimal concentration of Li intercalate has to be found. Indeed, since a move along Li concentration from towards induces magnetism, the corresponding -peak in the DOS moves from the region above the Fermi level at to the region below it at , while - peak remains above . In a certain range of the concentration the -peak passes through (see Fig.10). In our case such concentration is in the vicinity of The latter provides large spin polarization. This conclusion is obtained for fully optimized structures.
When we intercalate by non-metal oxygen atoms the value of magnetic moment decreases with decrease of oxygen concentration. However the spin polarization practically does not change with concentration. Fig. 9 shows that the positions of the -electron peaks in DOS are much more sensitive to the intercalation by the heavier atoms (such as antimony), than by atoms of a metal. The intercalation by light oxygen or phosphorus atoms shifts the same -electron peak with increase of concentration much less: at 100% concentration the peak is shifted by eV reaching the Fermi level.
Since there are preferable positions for the metal and non-metal intercalates, one may expect that the intercalation may cause an anisotropy of the compound properties. One of ways would be to inspect the tensor of static electroconductivity , which in the VASP package is calculated by means of the Drude formula . Here is the plasma frequency and is the relaxation time. However, is the parameter which depends on many factors (like, e.g., the way of preparation of the sample) and may differ for different samples even with the same concentration of the intercalates, not to speak of compounds with different intercalates. For this reason we prefer to estimate the degree of anisotropy of a compound just from the ratio (notice that The results of calculations are shown in Table 1, in 8-th column. A question arises if the different preferable positions for the metal and non-metal atoms in lattice of can be associated with the anisotropy? We inspected the maps of electronic localization function (ELF) at the intercalation by Li and P atoms (Fig. 11). For the non-metal atoms, which prefer to locate on the Si - Si bond, the conductive channels in plane are retained. In turn, the metal intercalated atoms prefer the position on the bond between out-plane Fe - Fe atoms. This leads to overlap of conductive channels. The latter leads to more uniform distribution of delocalized electrons by volume of crystal (Fig. 11). Although this difference seems to exist for all metal and non-metal intercalated compounds, its contribution to anisotropy is not monotonic and a general rule does not exist.
 |
 |
| a | b |
IV Conclusion
The fact that the large, if not the decisive, role in the mechanism of the magnetic structure formation in different compounds is played by the local environment of the magnetic species is well-known from the physics of surface and interfaces. In earlier works key-10 ; key-12 in the framework of suggested by us approach (hybrid self-consistent mapping approach (HSCMA)) we have shown that the distortions of crystal lattice have a significant impact on the magnetic moment formation along with types of atoms in the local environment. According to the latest experimental data, is predisposed to the appearance of ferromagnetism in it. In Ref. key-10 we studied the possible reasons for this. As it follows from the analysis of the map of the magnetic moment dependencies on the hopping integrals, the hopping integral, which is responsible for the distortion of the crystal lattice in the plane, plays a crucial role in the appearance of ferromagnetism. The distinctive feature of all the calculated maps is the presence of sharp boundaries between region with magnetic states and non-magnetic ones. Therefore, the system is in the vicinity of magnetic instability and it is reasonable to assume that some other type of crystal-lattice distortions can cause the formation of magnetic state in
In the present work we consider the conditions which can lead to the appearance of magnetic state in . As it follows from our analysis within a model, the magnetic state can arise not only when the distance between in-plane Fe - Fe atoms is changed, but also, for example, when the distance between out-of-plane Si - Si atoms is changed. Unfortunately, pronounced magnetic moment can arise only at quite large distortions of the crystal lattice, even if a comlex set of distortions is applied. We suggest that intercalation of could be a way to solve this problem. Actually, our calculations show that the intercalation of results in the appearance of significant magnetic moment on Fe atoms (0.5 - 1) at the relatively small lattice distortions (Table 1). Notice, that it is hardly possible to reproduce the complex set of lattice distortions caused by the intercalated atoms by selecting different substrates for the film or nanoparticle fabrication. Besides, we expect the appearance of a large spin polarization (60-80%) in intercalated by some atoms, such as Li, P, Na, O, which cause a reconstruction of the electronic structure. Such high value of spin polarization makes intercalated a promising candidate for the application in spintronics. Although it is hardly possible to achieve 100% concentration of intercalated atoms in practice, the high spin polarization remains large even at smaller concentrations. Moreover, maintaining a magnetic state at the smaller concentration of intercalated atoms, the small distortions of lattice allow experimental fabrication of films on the silicon substrate, which is extremely important for the modern silicon technology.
Acknowledgements.
This work was supported by the Russian Fund for Basic Research, Government of Krasnoyarsk Territory and Krasnoyarsk Region Science and Technology Support Fund to the research Projects No 17-42-240212 and No 18-42-243019.References
- (1) . A. Wolf, D. D. Awschalom, R. A. Buhrman, J. M. Daughton, S. von Molnar, M. L. Roukes, A. Y. Chtchelkanova, and D. M. Treger, Science 294, 1488 (2001)
- (2) N. Jedrecy, A. Waldhauer, M. Sauvage-Simkin, R. Pinchaux, and Y. Zheng, S, Phys. Rev. B 49, 4725 (1994).
- (3) M. Seibt, R. Khalil, V. Kveder, and W. Schr?ter, Appl. Phys. A 96, 235 (2009).
- (4) K. Yamaguchi, K. Mizushima Physical Review Letters 86, 6006 (2001)
- (5) Y. Makita, Y. Nakayama, Y. Fukuzawa, S.N. Wang, N. Otogawa, Y. Suzuki, Z.X. Liu, M. Osamura, T. Ootsuka, T. Mise, H. Tanoue Thin Solid Films 461, 202 (2004)
- (6) J. Yuan, H. Shen, L. Lu Physica B 406, 1733 (2011)
- (7) Guixin Cao, D. J. Singh, X.-G. Zhang, German Samolyuk et al, Phys. Rev. Lett. 114, 147202 (2015)
- (8) J K Tripathi, M Garbrecht, W D Kaplan, G Markovich and I Goldfarb, Nanotechnology 23, 495603 (2012)
- (9) J K Tripathi, G Markovich and I Goldfarb, App. Phys. Letters 102, 251604 (2013)
- (10) V.S. Zhandun, N.G. Zamkova, S.G. Ovchinnikov, and I.S. Sandalov, Phys.Rev. B95, 054429 (2017)
- (11) I.A. Tarasov, M.V. Rautskii, A.A. Dubrovsky, I.A. Yakovlev, L.A. Solovyov, T.E. Smolyarova, S.I. Popkov, M.N. Volochaev, S.N. Varnakov, S.G. Ovchinnikov, ACS Applied Materials and Interfaces (To be published)
- (12) N.G. Zamkova , V.S. Zhandun, S.G. Ovchinnikov, I.S. Sandalov, Journal of Alloys and Compounds 695, 1213 (2017)
- (13) G.Kresse and J. Furthmuller Comput. Mat. Sci. 6, 15 (1996); G.Kresse and J. Furthmuller Phys. Rev.B 54, 11169 (1996)
- (14) P.E.Blochl Phys. Rev.B 50, 17953 (1994); G.Kresse and D.Joubert Phys. Rev. B 59, 1758 (1999)
- (15) J.P.Perdew, K.Burke and M.Ernzerhof Phys.Rev.Lett. 77, 3865 (1996); J.P.Perdew, K.Burke and M.Ernzerhof Phys.Rev.Lett. 78, 1396 (1997)
- (16) H.J.Monkhorst and J.D.Pack Phys.Rev.B13, 5188 (1976)
- (17) J. Kanamori Prog. Theor. Phys. 30, 275 (1963)
- (18) J.C. Slater, G.F.Koster, Phys.Rev. 94,1498 (1954)
- (19) C. Kloc, E. Arushanov, M. Wendl, H. Hohl, U. Malang and E. Bucher, J. Alloys Compd. 219, 93 (1995).
- (20) A. D. Becke and K. E. Edgecombe, J. Chem. Phys. 92, 5397–5403 (1990)