Precision imaging of 4.4 MeV gamma rays using a 3-D position sensitive Compton camera
Abstract
Imaging of nuclear gamma-ray lines in the 1-10 MeV range is far from being established in both medical and physical applications. In proton therapy, 4.4 MeV gamma rays are emitted from the excited nucleus of either 12C∗ or 11B∗ and are considered good indicators of dose delivery and/or range verification. Further, in gamma-ray astronomy, 4.4 MeV gamma rays are produced by cosmic ray interactions in the interstellar medium, and can thus be used to probe nucleothynthesis in the universe. In this paper, we present a high-precision image of 4.4 MeV gamma rays taken by newly developed 3-D position sensitive Compton camera (3D-PSCC). To mimic the situation in proton therapy, we first irradiated water, PMMA and Ca(OH)2 with a 70 MeV proton beam, then we identified various nuclear lines with the HPGe detector. The 4.4 MeV gamma rays constitute a broad peak, including single and double escape peaks. Thus, by setting an energy window of 3D-PSCC from 3 to 5 MeV, we show that a gamma ray image sharply concentrates near the Bragg peak, as expected from the minimum energy threshold and sharp peak profile in the cross section of 12C(p,p)12C∗.
Introduction
Gamma ray imaging techniques are widely used in various fields of nuclear medicine, industries, nuclear and elementary particle physics, and also in high energy astrophysics. For example, single photon emission computed tomography (SPECT) is a tomographic gamma ray imaging technique in which a flow tracer is tagged with a radionuclide. A popular tracer is 99mTc, which emits 140 keV photons. But other tracers, such as 111mIn (171 keV, 245 keV) and 57Co (122 keV), are also used to visualize concentrations in different organs[1]. The SPECT imaging is, however, limited to use with photon energies below 300 keV because high resolution images cannot be obtained as higher energy gamma rays penetrate the collimator[2]. Positron emission tomography (PET) allows visualization of FDG (fluoro-deoxy-glucose) tagged with positron emitters, most often 18F[3]. Owing to the use of pair annihilation of 511 keV gamma rays, a PET scanner does not need a collimator and is widely used to find tumors and diagnose Alzheimer’ disease[4]. In both imaging techniques, photo-absorption is the dominant process within a detector, thus a dense high speed scintillator is generally used. In contrast, very high energy gamma rays (greater than 10 MeV) are often an active research target in modern astronomy and elementary particle physics. At such energies, the dominant interaction between photons in the material is pair production, therefore particle tracking systems like silicon strip detectors (SSD[5]) or scintillation fibers are commonly used to determine the incident direction of gamma rays[6, 7]. For example, large area telescopes (LAT) in the Fermi gamma ray space telescope launched in 2008, carried 10,000 SSDs[8]. Fermi-LAT successfully provided a sky map between 100 MeV and more than 10 GeV with a typical angular resolution of 0.6∘ as measured at 1 GeV[9].
In this context, gamma ray imaging in the 110 MeV energy range has lagged by a few decades owing to difficulties in the optimum detector configuration. In fact, gamma rays with energy greater than 1 MeV are difficult to collimate like in the SPECT scanner, whereas the energy is too low to expect a sufficient cascade of for tracking detectors like the SSD. Now the dominant interaction is Compton scattering, thus the kinematics of both electrons and photons must be considered in order to the determine incident direction of photons[10]. Despite such difficulties, however, imaging of 110 MeV gamma rays may provide fruitful scientific/technical outputs because most nuclear gamma ray lines are narrowly concentrated in this particular energy band. For example, in proton therapy, incident protons interact with atoms in the patient’s body, and then promptly emit nuclear gamma rays, such as 4.4 MeV lines from 12C∗ and 11B∗, and the 6.2 MeV line from 15O∗[11, 12, 13, 14, 15]. These gamma rays are supposed to be a new tool for online monitoring of dose delivery and/or proton range verification[16, 17, 18]. The online monitoring technique may replace the current offline monitor based on PET scanners, or even online PET scanners that visualize 511 keV gamma rays[19, 20, 21]. Even in high energy astrophysics, various gamma ray lines are anticipated in solar flares, planetary atmospheres including the Earth[22], radioactive elements on the lunar surface[23], and even through the nuclear interaction between cosmic rays and the interstellar medium. Actually, various gamma lines have been frequently observed in solar flares[24]. Further, 1.156 MeV nuclear gamma rays from 44Ti were detected from nearby young supernova remnants of Cassiopeia A, where the half-life of 44Ti is 48.20.9 yrs[25]. Also, 1.809 MeV gamma rays from 26Al, which is a radioactive isotope whose half-time is Myr, was already detected from the Galactic plane over 30 years ago, showing direct evidence that nucleosynthesis is ongoing in the star-forming region in our Galaxy[26]. Similarly, various emission lines, including 4.4 MeV and 6.2 MeV lines, are expected from the Galactic center region[27], but none of them have been detected so far.
A Compton camera utilizes Compton kinematics to visualize gamma rays ranging from sub-MeV to more than 10 MeV[10]. Unlike a traditional pinhole camera[28] or an imager using a coded mask aperture[29], a Compton camera does not need a heavy collimator or shield. In general, this achieves high sensitivity and wide field of view. Although variety exists in the choice of detector materials[30, 31, 32, 33, 34], a Compton camera generally consists of a scatterer, wherein the incident gamma rays first deposit a fraction of energy, and an absorber in which the remaining energy carried by scattered photons is absorbed. Obviously, the energy of incident gamma rays are the sum of those deposited in the scatterer and absorber. The arrival direction can be determined (or at least, constrained) by measuring both the scattering and absorbing positions and energies within the detector[35]. The concept of a Compton camera was first proposed over 40 years ago and targeted both the medical and astrophysical applications[10, 36], but vast progress has been made only recently. This was triggered by a nuclear accident in the Fukushima Daiichi Nuclear Plant in 2011. While the radioactive material distributed in the accident was mainly 137Cs, which emits 662 keV gamma rays, various attempts were made to visualize sub-MeV to MeV gamma-rays quickly and accurately with the most recent detector technologies[33, 37, 38, 39, 40, 41, 42].
In this paper, we developed a novel 3-D position sensitive Compton camera (3D-PSCC) that enables gamma ray imaging of the 110 MeV range. As a first step toward future applications, we started with measurements assuming the online proton therapy monitoring. We irradiated various phantoms with a pencil beam of 70 MeV protons, and we obtained the energy spectra of prompt gamma rays below 5 MeV as measured with a high-purity Germanium (HPGe) detector. Among the various nuclear emission lines identified, we suggest that broad 4.4 MeV lines associated with 12C∗ and 11B∗ are most suitable for proton range verification in terms of minimum energy threshold and sharp nuclear cross section structure. Subsequently, the idea is supported by detailed 1-D profile simulations of various prompt gamma rays. By using multiple PMMA slab phantoms to effectively extend the proton range, we demonstrate, for the first time in experiment, that 4.4 MeV gamma rays sharply concentrate near the Bragg peak.
| Energy [keV] | nuclear reaction | water | PMMA | Ca(OH)2 |
|---|---|---|---|---|
| 511 | 12C(p,x)11C, 16O(p,x)15O, 16O(p,x)13N, 16O(p,x)11C | ✓ | ✓ | ✓ |
| 718 | 12C(p,x)10B∗, 16O(p,x)10B∗,12C(p,x)10C 10B∗ | ✓ | ✓ | ✓ |
| 1022 | 12C(p,x)10B∗, 12C(p,x)10C 10B∗, 16O(p,x)10B∗ | ✓ | ||
| 1635 | 16O(p,x)14N∗ | ✓ | ||
| 2000 | 12C(p,x)11C∗, 16O(p,x)11C∗ | ✓ | ||
| 2225 | neutron capture | ✓ | ✓ | ✓ |
| 2313 | 16O(p,x)14N∗ | ✓ | ✓ | ✓ |
| 3736 | 40Ca(p,p)40Ca∗ | ✓ | ||
| 4438/4444 | 12C(p,p)12C∗, 12C(p,x)11B∗, 16O(p,x)12C∗ | ✓ | ✓ | ✓ |
Results
Prompt Gamma-ray Spectra
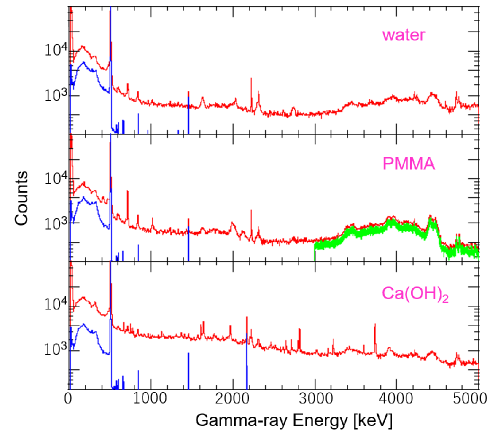
To investigate various prompt gamma rays that could be emitted from the patient’s body during proton therapy, we irradiated water, PMMA, and Ca(OH)2 phantoms with 70 MeV protons and measured the gamma ray spectra with an HPGe detector in both the on-beam and off-beam conditions. Fig.1 shows the resulting spectra for these three phantoms during proton irradiation (on-beam; ) as compared with the background spectra, taken soon after the beam is turned off (off-beam; ). All the presented spectra are corrected for efficiency of HPGe detector, which decreases as the incident gamma ray energy increases. In all cases, various emission lines from nuclear reactions and a broad continuum due to inelastic scattering of protons are clearly visible up to a maximum energy end of 5 MeV. Table.1 summarizes the identification of most strong lines seen in the online spectra, based on a detailed comparison with PHITS simulations[43] (ver.2.93). Note that the very broad structures most clearly seen in the PMMA spectra between 3 MeV and 5 MeV (shown as a ), is the combination of prompt gamma rays emitted from 12C∗ (4438 keV) and 11B∗ (4444 keV) and their single or double escape peaks. In contrast, the only prominent line in the off-beam spectrum is the 511 keV annihilation line from a positron emitter like 15O. As noted above, these 511 keV gamma rays are being widely used for offline monitoring in proton therapy.
Precision imaging of 4.4 MeV Gamma rays
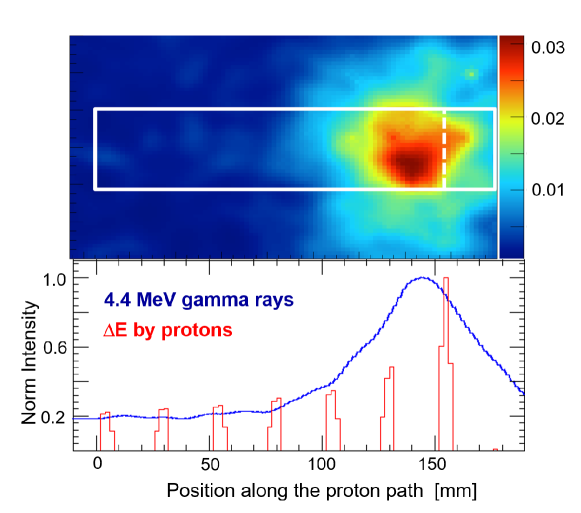
Among the various emission lines listed above, we targeted 4.4 MeV gamma rays for future on-line monitoring in proton therapy. Note that the 1-D profile of 4.4 MeV gamma rays along the proton beam is reported by several other groups mainly by using a slit collimator[16, 11, 14], but no experimental results on 2-D images have been reported so far, particularly using a Compton camera. For precision measurement of a 4.4 MeV gamma ray image and its detailed comparison with the energy deposited by protons, we developed 3-D PSCC that features the 110 MeV range. The expected angular resolution is 6.4∘ (FWHM) as measured at 4.4 MeV. Fig.2 () shows the 4.4 MeV gamma ray image, and Fig.2 () shows a comparison between the 1-D projection along the beam and the energy deposited by incident protons. Clearly, the peak position of the 4.4 MeV gamma rays image agrees well but is slightly shifted by a few mm, which is again consistent with the PHITS simulation.
Discussion
Nuclear cross sections
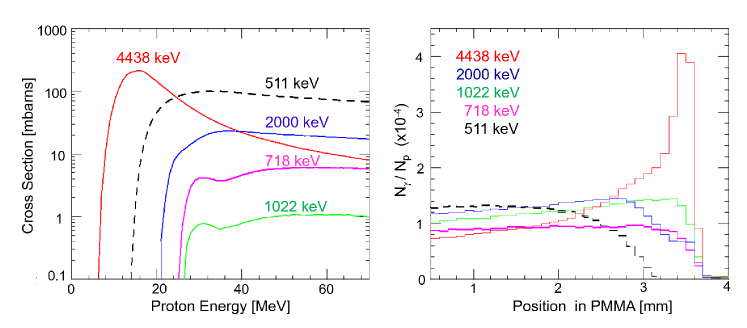
Although various nuclear emission lines were observed in the prompt gamma ray spectra shown in Fig.1 and Table 1, it is still controversial which line or energy band is most suitable for online proton therapy monitoring. Ideally, the spatial distributions of prompt gamma rays should resemble with the proton dose distribution, but the physical processes that produce gamma rays via nuclear reactions are completely different from the energy loss process of protons through the electromagnetic interaction. Obviously, each nuclear reaction has different energy threshold and energy dependence of the cross section. Fig.3 () compares the nuclear cross sections corresponding to various emission lines, namely the 511 keV, 718 keV, 1022 keV and 4438 keV lines as a function of energy as estimated with the PHITS simulation. As noted above, the 4.4 MeV gamma ray line consists of 4438 keV from 12C∗ and 4444 keV from 11B∗, but the former cross section is two orders of magnitude larger, hence only that of 4438 keV is plotted in the figure. Also note that the 511 keV gamma rays can be emitted from various positron emitters, such as 15O, 13N, and 11C, but emission from 15O is dominant during proton irradiation[44]. Clearly, the energy threshold for a major nuclear reaction that emit 4.4 MeV lines, 12C(p,p)12C∗, is much lower than other nuclear reaction channels; approximately 6 MeV as compared to 14 MeV for 16O(p,x)15O that emit 511 keV, and 25 MeV for 12C(p,x)10B∗ that emit 718 keV gamma rays. Moreover, its cross section sharply peaks at around 1015 MeV. Note that, the range for such low energy protons is only 1.22.6 mm in water equivalent pathlength (WEL). This suggests that the 4.4 MeV gamma rays are most effectively emitted just before protons completely stop in the target, and thus may constitute a narrow peak at a position that is very close to the Bragg peak.
Anticipated distribution of prompt gamma rays
Fig.3 () shows results from a PHITS (ver.2.93[43]), the 1-D profiles of 511 keV, 718 keV, 1022 keV, and 4.4 MeV lines are obtained by projecting the spatial distributions along the beam axis and are then compared with the proton dose distribution. These simulations clearly support above idea that 4.4 MeV gamma rays are most suitable for proton range verification and dose delivery monitoring. In the experiments using a slit collimator, the peak intensity of the 4.4 MeV gamma rays is approximately coincident with the position of the Bragg peak. However, a slight amount of offset, typically 14 mm, has been observed even for the same 12C∗ peak, depending on chemical composition of the phantom[14]. Our group successfully obtained similar 1-D profiles using a Pb-slit collimator[15], but the results regarding Compton imaging of 4.4 MeV gamma rays were not conclusive. The reasons were: (1) the range of 70 MeV protons in PMMA (35 mm) is too short to be resolved with a Compton camera; (2) there is a limited number of 4.4 MeV events that can be used for image reconstruction; (3) multiple Compton, escape, and back-scattering events were misidentified with the preliminary detector configuration. All of these issues have been resolved in this paper.
In the meantime, the proton beam intensity was reduced to approximately 310 pA and the measurement time was 5 hr. In this experiment, the intensity was severely limited by the maximum data acquisition rate of the PMT head amplifies, which is a few kHz when all triggered events in a list-mode were accumulated. The coincidence between the scatterer and absorber is only considered in the offline analysis. To overcome such difficulties, we are developing a new data acquisition system taking hardware coincidence so as to improve the rate tolerance by two orders of magnitude. In that case, we expect that images with the same quality will be obtained within a few minutes for a beam intensity of sub-nA to nA, which is close to the clinical beam. Thus, in the next step, we will use a 200 MeV clinical beam for further image confirmation, and we will also try to image 6.2 MeV gamma rays in real time.
Methods
3D-PSCC for prompt gamma-ray imaging
We have developed various two-plane Compton cameras consisting of scintillating materials (e.g., Ce;GAGG[45]) coupled with multi-pixel photon counters[33]. The great advantage of using a scintillator rather than semiconductor devices like Si-CdTe[32, 46], CZT[47, 38, 42], or Ge[34] detectors is that scintillators are cost effective and have high sensitivity at energies greater than MeV owing to thick and heavy scintillation materials. In the meantime, the scintillator thickness makes the position of the gamma ray interaction uncertain, especially in the depth of interaction (DOI) directions. We therefore implemented 3-D position sensitive scintillators consisting of 2 mm cubic Ce:GAGG scintillators that can measure the gamma ray interaction position within a scintillator in 3-D[33, 37, 48]. In short, the reflector walls (BaSO4 of 100m thickness) divide side-by side crystals in the 2-D () direction, while a thin layer of air divides crystals in the DOI () direction. Note that conventional dual-sided DOI detectors often use a crystal block consisting of uniform strip scintillators with no divisions in the DOI direction. In contrast, we constructed a crystal block with a polished surface consisting of multiple discrete scintillators to form a substantial gradient of output signals that depend on the DOI positions of the crystals[37].
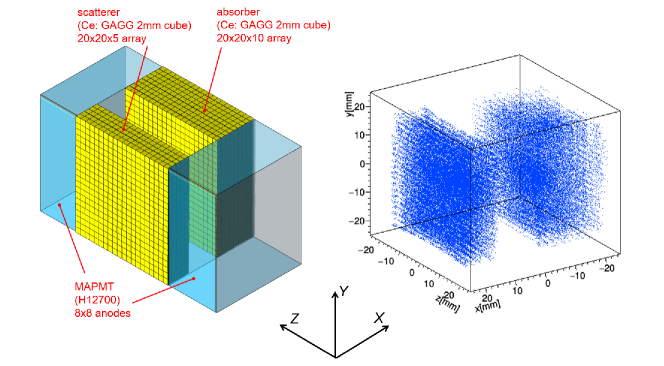
The configuration of the Compton camera is shown in Fig.4 (). The camera consisted of 20205 arrays of Ce:GAGG pixels as a scatterer, whereas 202010 arrays of Ce:GAGG pixels were used as an absorber. Unlike other Compton cameras developed in our group[33, 48, 49, 50], we used two multi-anode PMTs (MAPMTs; Hamamatsu H12700A) of 88 anodes to readout the scintillation light from the right/left ends of the scintillator arrays. This is because the radiation tolerance of the MPPC is uncertain, particularly for damage caused by fast neutrons in proton beam facilities. This matter should be addressed in future work.
The output signals from both MAPMTs are fed into the PMT head amplifiers (CLEAR PULSE, 80190) controlled by LabView for position and spectral measurement of each event. An event trigger can be generated by either head amplifier. The resultant 642 ch of pulse-height data (12-bit ADC) is recorded for a time period of 1 s following trigger generation. The output ADC data is compiled, time-stamped in the FPGA and sent to a laptop via a USB 2.0 cable. Note that even a slight difference in gain for each MAPMT and head amplifier channel or in light yield along the DOI direction would affect the spatial resolution of the Compton camera. To correct for this gain, we pre-emptively produced ”gain maps” for individual MAPMTs and head amplifiers. We then calibrated the response from all the scintillator pixels using a photo-peak irradiated by a 60Co calibration source prior to the Compton imaging. Then the , , and coordinates of each gamma ray interaction position were calculated using the following equations for both the scatterer and absorber:
| (1) |
where and are the pulse heights, and are the position of -th anode of left and right MAPMTs, = 42 mm is the DOI length (i.e., length in the direction) of the scintillator array. Also, is the number of MAPMT channels covering either the scatterer or absorber, namely = 24 for the scatterer and = 40 for the absorber. The positional map thus calculated for a 60Co source which emits 1.17 and 1.33 MeV gamma rays is shown in Fig.4 ().
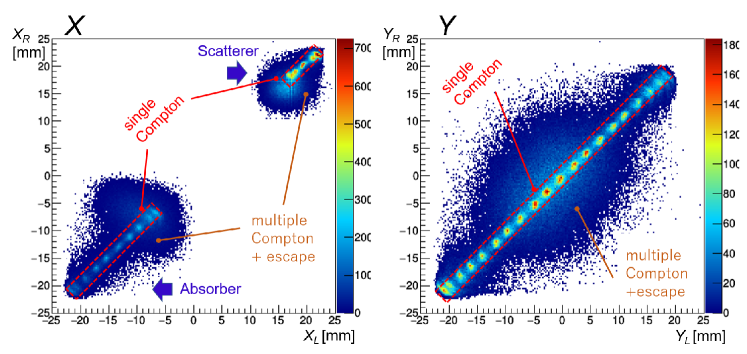
In this experimental setup, instances of coincidence between the scatterer and the absorber can be easily recorded to detect Compton interaction for the purpose of offline analysis. Since the outputs from all MAPMT channels were recorded in list mode, events during which both the scatterer (24 channels in +6 mm +24 mm) and the absorber (40 channels in 24 mm +6 mm) have recorded non-zero ADC values when the coincidence time window was fixed at 1s may be selected for the analysis. During the imaging of high-energy gamma rays, a fraction of multiple Compton and/or escape events within the detector are considered more significant. Based on PHITS simulation estimates, these fractions are 65 and 88 for multiple and escape events respectively that occur during the imaging of 4.4 MeV gamma rays. We therefore calculated the and coordinates individually for the left and right MAPMTs as follows for both the scatterer and absorber:
| (2) |
Fig.5 shows 2-D histograms comparing vs (Fig.5 ) and vs (Fig.5 ) in the absorber, as an example for a 60Co source. The events show a narrow correlation, shown as the red-dash boxes in the center. Events outside this area are regarded as multiple Compton and/or escape events. Throughout the paper, we only used single Compton events, in which and are satisfied in both the scatterer and absorber. Using this simple method for event selection, we confirmed that more than 90 of multiple Compton events can be eliminated while detecting 4.4 MeV gamma rays. The signal-to-background event ratio would be almost comparable, resulting in a high quality image, as shown in Fig.2. Also, we applied various energy cuts to remove (1) escape events where part of the incident gamma ray energy is deposited but cannot be totally absorbed, and (2) backscattering events in which gamma rays interact first in the absorber, then backscattered photons are absorbed within the scatterer. Specifically, 65 keV 180 keV and 3 MeV + 5 MeV were applied for imaging the 4.4 MeV gamma rays, where and are the energy deposits in the scatterer and absorber, respectively. However, we note that even higher energy gamma rays may deposit a fraction of their energy between 3 and 5 MeV, and then escape from the detector. Such events cannot be rejected in the current flow of event selection, but are estimated to be less than 20 from the simulation.
Performance verification of 3D-PSCC
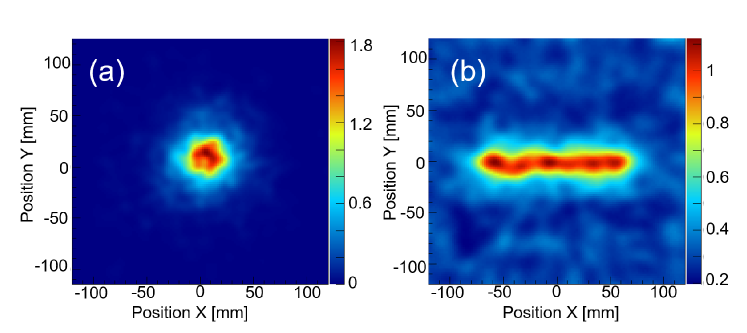
Detailed performance of the 3D-PSCC, such as the angular response and sensitivity to high energy gamma rays, were investigated both in the laboratory experiment and a Geant-4 simulation. The angular resolution of the Compton camera is determined by three factors: (1) position uncertainty, (2) energy uncertainty, and (3) the Doppler broadening effect[51]. In our case, position uncertainty is the primary factor affecting angular resolution and is determined from the side length of the cubic Ce:GAGG scintillator (2 mm throughout the measured energy range). The energy resolution achieved using typical Ce:GAGG pixel in a 3-D scintillator array is 10.5 (FWHM) when detecting 1.33 MeV gamma rays, and is anticipated to be 5.7 for 4.4 MeV gamma rays. The Doppler broadening effect depends on the materials forming the scatterer but has negligibly small influence on angular resolution compared with the other two factors. Fig.6 (a) shows the experimental image reconstructed for a 60Co point source placed 10 cm from the detector. We applied the list-mode maximum likelihood expectation maximization (LM-MLEM) algorithm as developed in the literature[21], with an iteration number of three. The angular resolution thus measured was 9.5∘ (FWHM) at 1.33 MeV, which is consistent with the simulation. The simulation also predicts the angular resolution improves as energy increases, typically 6.4∘ (FWHM) as measured at 4.4 MeV for prompt gamma ray imaging.
Also, to correctly reconstruct the geometry and intensity of extended and/or diffuse sources, we first simulated the 3D-PSCC response against a uniformly distributed plane source that covers the entire field of view and emits 4.4 MeV monochromatic gamma rays. The results are used as sensitivity maps to correct the measurement image for extended sources as measured at 4.4 MeV. We also simulated 10 cm, 15 cm, and 20 cm line sources and placed them at 20 cm from the camera to mimic the experimental conditions in the NIRS experiments, as detailed below. From Fig.6 (b), we confirmed that the 3D-PSCC obtained 10 uniformity for a 15 cm line source, which emits 4.4 MeV gamma rays.
Setup for measuring prompt gamma-ray spectra
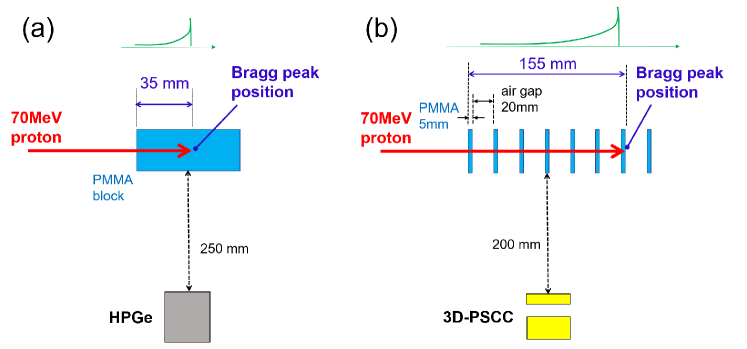
Fig.7 (a) shows a setup for measuring prompt gamma ray emission in the cyclotron facility at NIRS. We irradiated various phantoms with a 70 MeV proton beam that was narrowly collimated to a diameter of approximately 10 mm. The size of each phantom was sufficiently larger than both the proton range and proton beam diameter, so that all the protons are absorbed in the phantom. For example, we used a PMMA cube phantom with 3030 mm2 cross section and 10 cm depth along the beam direction, based on a 35 mm proton range for 70 MeV protons in PMMA. The spectrum of prompt gamma rays was gathered with an HPGe detector provided by EGG (GEM-40190-P-S) by setting the energy range from 10 keV to 5 MeV. The HPGe detector was set perpendicular to the beam axis, and the center of the detector’s FOV is approximately aligned to the position of the Bragg peak. The proton beam intensity was reduced to approximately 3 pA so that the probability of a pile up event was less than 5 during on-beam data acquisition. The output signal from the HPGe was fed into a shaping amplifier (ORTEC 570) with a shaping time set to 6 s. Each spectrum was accumulated for 10 min for both the on-beam and off-beam conditions. The distance between the phantom and detector was always fixed to 25 cm. As shown in Fig.1 ( spectra), a significant amount of gamma-ray emission exists even when the beam is turned off, particularly below 1 MeV. These gamma rays might be accounted for by the long-lived positron emitters generated in the phantom[44] and/or the room background from sources such as from activated materials in the cyclotron beam port. This background is, however, about an order of magnitude smaller than the gamma-ray emission we are referring to. For the 35 MeV gamma rays in particular, contamination is negligibly small – as can be clearly seen in Fig.1.
Setup for imaging 4.4 MeV gamma rays
In an actual clinical situation, a proton beam typically has energies ranging from 70 MeV to 250 MeV. Thus, the experimental conditions at the NIRS cyclotron facility using a 70 MeV beam are rather close to the lower limit. However, nuclear reactions that take places in the patient’s body and the subsequent production of prompt gamma rays are completely the same, as indicated from the energy threshold of each nuclear reaction and shown in Fig.3 (). However, an obvious difference exists in the proton range. The typical range of clinical proton beam is approximately 25 cm in both water and PMMA, whereas the range is 3.5 cm for 70 MeV protons. Therefore, if we place the 3D-PSCC 20 cm from the proton beam axis, it would be difficult to quantitatively compare with the proton dose distribution, even with the obtained spatial distribution of 4.4 MeV image[15]. Therefore, we used eight 5 mm thick PMMA slab phantoms that were placed 20 mm apart. A schematic of experimental setup is shown in Fig.7 (b). In this configuration, the proton range extended to 15.5 cm, and the most precise imaging of 4.4 MeV gamma rays can be obtained with such a simple setup. Again, the proton beam intensity was reduced to approximately 3 pA and the measurement time was 5 hr.
References
- [1] Khalil, M. K., Tremoleda, J. L., Bayomy, T. B. & Gsell, W. Molecular SPECT Imaging: An Overview. \JournalTitleInt. Jnl. of Molec. Img. 2011, 796025 (2011).
- [2] Rosenthal, M. S. et al. Quantitative SPECT imaging: a review and recommendations by the Focus Committee of the Society of Nuclear Medicine Computer and Instrumentation Council. \JournalTitleJ Nucl Med 36, 1489–1513 (1995).
- [3] Kubota, K. From tumor biology to clinical Pet: a review of positron emission tomography (PET) in oncology. \JournalTitleAnn. Nucl. Med 15, 471–486 (2005).
- [4] Coleman, R. Positron emission tomography diagnosis of Alzheimer’s disease. \JournalTitleNeuroimaging Clin N Am 15, 837–846 (2005).
- [5] Weilhammer, P. Overview: silicon vertex detectors and trackers. \JournalTitleNucl. Instrm. Methods A 453, 60–70 (2000).
- [6] Torii, S. et al. The CALorimetric Electron Telescope (CALET): High Energy Astroparticle Physics Observatory on the International Space Station. \JournalTitleProceedings of Science, ICRC2015 34, id.581 (2015).
- [7] Jürgen, K. The future of gamma-ray astronomy. \JournalTitleC. R. Physique 17, 663–678 (2016).
- [8] Atwood, W. B. et al. The Large Area Telescope on the Fermi Gamma-Ray Space Telescope Mission. \JournalTitleAstrophys. J. 697, 1071–1102 (2009).
- [9] Acero, F. et al. Fermi Large Area Telescope Third Source Catalog. \JournalTitleAstrophys. J. Suppl. Se. 218, 23–64 (2015).
- [10] Schönfelder, V., Hirner, A. & Schneider, K. A telescope for soft gamma ray astronomy. \JournalTitleNucl. Instrm. Methods A 107, 385–394 (1973).
- [11] Lopes, P. C. et al. Time-resolved imaging of prompt-gamma rays for proton range verification using a knife-edge slit camera based on digital photon counters. \JournalTitlePhys. Med. Biol. 60, 6063–6085 (2015).
- [12] Golnik, C. et al. Tests of a Compton imaging prototype in a monoenergetic 4.44 Mev photon filed - a benchmark setup for prompt gamma-ray imaging devices. \JournalTitleJournal of Instrumentation 11, P06009 (2016).
- [13] Hilaire, E., Sarrut, D., Peyrin, F. & Maxim, V. Proton therapy monitoring by Compton imaging: influence of the large energy spectrum of the prompt- radiation. \JournalTitlePhys. Med. Biol. 61, 3–368 (2016).
- [14] Kelleter, L. et al. Spectroscopic study of prompt-gamma emission for range verification in proton therapy. \JournalTitlePhys. Med. 34, 7–17 (2017).
- [15] Koide, A. et al. Spatially resolved measurement of wideband prompt gamma-ray emission toward on-line monitor for the future proton therapy. \JournalTitleNucl. Instrm. Methods A in press (2018).
- [16] Min, C.-H., Kim, C. H., Youn, M.-Y. & Kim, J.-W. Prompt gamma measurements for locating the dose falloff region in the proton therapy. \JournalTitleApplied Physics Letters 89, 183517 (2006).
- [17] Knopf, A.-C. & Romax, A. In vivo proton range verification: a review. \JournalTitlePhys. Med. Biol. 58, R131–R160 (2013).
- [18] Kurosawa, S. et al. Prompt gamma detection for range verification in proton therapy. \JournalTitleCurrent Applied Physics 12, 364–368 (2012).
- [19] Nishio, T. et al. The Development and Clinical Use of a Beam ON-LINE PET System Mounted on a Rotating Gantry Port in Proton Therapy. \JournalTitleRadiation Oncology 76, 277–286 (2010).
- [20] Taya, T. et al. First demonstration of real-time gamma imaging by using a handheld Compton camera for particle therapy. \JournalTitleNucl. Instrm. Methods A 831, 355–361 (2016).
- [21] Taya, T. et al. Optimization and verification of image reconstruction for a Compton camera towards application as an on-line monitor for particle therapy. \JournalTitleJournal of Instrumentation 12, P07015 (2017).
- [22] Kozolovsky, B., Murphy, R. J. & Ramaty, R. Nuclear deexcitation gamma-ray lines from accelerated particle interactions. \JournalTitleAstrophys. J. Suppl. S. 141, 523–541 (2002).
- [23] Kobayashi, S. et al. Determining the Absolute Abundances of Natural Radioactive Elements on the Lunar Surface by the Kaguya Gamma-ray Spectrometer. \JournalTitleSpace Science Reviews 154, 193–218 (2002).
- [24] Vestrand, W. T. et al. THE SOLAR MAXIMUM MISSION ATLAS OF GAMMA-RAY FLARES. \JournalTitleAstrophys. J. Suppl. S. 120, 409–467 (1999).
- [25] Iyudin, A. F. et al. COMPTEL observations of Ti-44 gamma-ray line emission from CAS A. \JournalTitleAstron. Astrophys. 284, L1–L4 (1994).
- [26] Diehl, R. et al. COMPTEL observations of Galactic 26Al emission. \JournalTitleAstron. Astrophys. 298, 445–460 (1995).
- [27] Dogiel, V. A. et al. Nuclear interaction gamma-ray lines from the Galactic center region. \JournalTitleAstron. Astrophys. 508, 1–7 (2009).
- [28] Beekman, F. J. & der Have, F. V. The pinhole: gateway to ultra-high-resolution three-dimensional radionuclide imaging. \JournalTitleJ. Nucl. Med. Mol. Imaging 34, 151–161 (2007).
- [29] Caroli, E., Stephen, J. B., Di Cocco, G., Natalucci, L. & Spizzichino, A. Coded aperture imaging in X- and gamma-ray astronomy. \JournalTitleSpace Science Reviews 45, 349–403 (1987).
- [30] Schönfelder, V. et al. Instrument description and performance of the imaging gamma-ray telescope COMPTEL aboard the Compton Gamma-Ray Observatory. \JournalTitleAstrophys. J. Suppl. S. 86, 675–692 (1993).
- [31] Tanimori, T. et al. Mev -ray imaging detector with micro-TPC. \JournalTitleNew Astronomy Reviews 48, 263–268 (2004).
- [32] Takahashi, T. et al. Hard X-ray and -ray detectors for the NeXT mission. \JournalTitleNew Astronomy Reviews 48, 269–273 (2004).
- [33] Kataoka, J. et al. Handy Compton camera using 3D position-sensitive scintillators coupled with large-area monolithic MPPC arrays. \JournalTitleNucl. Instrm. Methods A 541, 398–404 (2013).
- [34] Motomura, S. et al. Improved imaging performance of a semiconductor Compton camera GREI makes for a new methodology to integrate bio-metal analysis and molecular imaging technology in living organisms. \JournalTitleJnl. of Anal. Atom. Spectrom. 28, 934–939 (2017).
- [35] Tanimori, T. et al. Establishment of Imaging Spectroscopy of Nuclear Gamma-Rays based on Geometrical Optics. \JournalTitleScientific Reports 7, 41511 (2017).
- [36] Todd, R. W., Nightingale, J. M. & Everett, D. B. A proposed camera. \JournalTitleNature 251, 132–134 (1974).
- [37] Kishimoto, A. et al. First demonstration of multi-color 3-D in vivo imaging using ultra-compact Compton camera. \JournalTitleJournal of Instrumentation 9, P11025 (2014).
- [38] Wahl, C. G. et al. The Polaris-H imaging spectrometer. \JournalTitleNucl. Instrm. Methods A 784, 377–381 (2015).
- [39] Takeda, S. et al. A portable Si/CdTe Compton camera and its applications to the visualization of radioactive substances. \JournalTitleNucl. Instrm. Methods A 787, 207–211 (2015).
- [40] Tomono, D. et al. First On-site True Gamma-Ray Imaging-Spectroscopy of Contamination near Fukushima Plant. \JournalTitleScientific Reports 7, 41972 (2017).
- [41] Mochizuki, S. et al. First demonstration of aerial gamma-ray imaging using drone for prompt radiation survey in Fukushima. \JournalTitleJournal of Instrumentation 12, P11014 (2017).
- [42] Haefner, A. et al. Handheld real-time volumetric 3-D gamma-ray imaging. \JournalTitleNucl. Instrm. Methods A 857, 42–49 (2017).
- [43] Sato, T. et al. Features of Particle and Heavy Ion Transport code system (PHITS) version 3.02. \JournalTitleJ. Nucl. Sci. Technol. https://doi.org/10.1080/00223131.2017.1419890 (2018).
- [44] Masuda, T. et al. Measurement of nuclear reaction cross sections by using Cherenkov radiation toward high-precision proton therapy. \JournalTitleScientific Reports 8, 2570 (2018).
- [45] Kamada, K. et al. 2 inch diameter single crystal growth and scintillation properties of Ce:Gd3Al2Ga3O12. \JournalTitleJournal of Crystal Growth 352, 88–90 (2012).
- [46] Takeda, S. et al. Experimental Results of the Gamma-Ray Imaging Capability with a Si/CdTe Semiconductor Compton Camera. \JournalTitleIEEE Trans. on Nucl. Sci. 56, 783–790 (2009).
- [47] McCleskey, M. et al. Evaluation of a multistage CdZnTe compton camera for prompt imaging for proton therapy. \JournalTitleNucl. Instrm. Methods A 785, 163–169 (2015).
- [48] Kataoka, J. et al. Recent progress of MPPC-based scintillation detectors in high precision X-ray and gamma-ray imaging. \JournalTitleNucl. Instrm. Methods A 784, 248–254 (2015).
- [49] Kataoka, J. et al. Ultracompact Compton camera for innovative gamma-ray imaging. \JournalTitleNucl. Instrm. Methods A in press (2018).
- [50] Kishimoto, A. et al. First demonstration of multi-color 3-D in vivo imaging using ultra-compact Compton camera. \JournalTitleScientific Reports 7, 2110 (2017).
- [51] Watanabe, S. et al. A Si/Cdte semiconductor Compton camera. \JournalTitleIEEE Trans. on Nucl. Sci. 52, 2045–2051 (2005).
Acknowledgements
This research was supported by JSPS KAKENHI Grant Number JP15H05720. Careful supports by technical staffs in the cyclotron facility in NIRS is also acknowledged to complete the experiments presented in the paper.
Author contributions statement
J.K. conceived the concept of this research. A.K., J.K., T.T., S.M. K.S. L.T. K.F. T.M. and T.K. conceived the experiments, T.M. derived various cross sections for major nuclear reactions, T.I. provided the technical advices for the NIRS experiments and interpretation of results. J.K. wrote the paper, and ll authors reviewed the manuscript.
Additional information
Competing financial interests: The authors declare that they have no competing interests.