Four single-spin Rabi oscillations in a quadruple quantum dot
Abstract
Scaling up qubits is a necessary step to realize useful systems of quantum computation. Here we demonstrate coherent manipulations of four individual electron spins using a micro-magnet method in a quadruple quantum dot - the largest number of dots used for the single spin control in multiple quantum dots. We observe Rabi oscillations and electron spin resonance (ESR) for each dot and evaluate the spin-electric coupling of the four dots, and finally discuss practical approaches to independently address single spin control in multiple quantum dot systems containing even more quantum dots.
Semiconductor quantum dots (QDs) provide a promising platform for quantum information processing in solid state devices 1995DiVicenzoScience ; 1998LossPRA ; 2005PettaScience ; 2006KoppensNature . The QD system has advantages in implementing quantum bits (qubits), including a relatively long coherence time of electron spin, potential scalability thanks to the well-established fabrication technology and small physical size per qubit. To date gate-defined QDs 2000CiorgaPRB have been up-scaled to double 1996BlickPRB , triple 2006GaudreauPRL , quadruple 2014TakakuraApplPhysLett ; 2014DelbecqApplPhysLett and quintuple QDs 2016ItoSciRep to increase the number of qubits. Recently half-filled QDs were demonstrated in an array of nine QDs 2016ZajacPRA . The multiple QDs can also be used to study the physics of electron-electron interactions such as quantum cellular automata 2006GaudreauPRL and the Fermi-Hubbard model 2017HensgensNature . In parallel with up-scaling of the QD system, basic manipulations of a few qubits have been demonstrated 2005PettaScience ; 2007NowackScience ; 2008PioroNatPhys ; 2011BrunnerPhysRevLett . We used a micro-magnet ESR (MM-ESR) method to realize the fastest control of a single spin 2014YonedaPhysRevLett , and then individual control of electron spins confined in a triple QD 2016NoiriAPL and four individual ESR signals in a quadruple QD (QQD) 2016OtsukaSciRep .
In this paper, we perform single spin control in a QQD with the MM-ESR method. We use a correlated double sampling (CDS) technique 2014ShulmanNatCom to enhance the ESR signal as compared to our previous experiment 2016OtsukaSciRep and observe a coherent oscillation (Rabi oscillation) of an electron spin in each dot by sweeping the ESR driving time. Based on the acquired data, we discuss how to improve the quality of the Rabi oscillations by considering the control speed and the addressability of the electron spin in each dot.
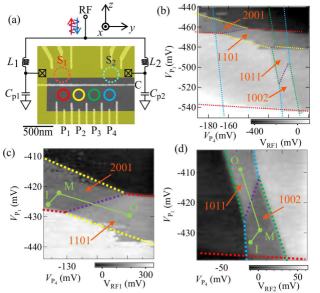
Fig.1 (a) shows a scanning electron micrograph of the QQD device and a schematic picture of the measurement electric circuit. The device is fabricated in a GaAs/AlGaAs modulation doped two dimentional electron gas containing heterostructure wafer. The Ti/Au gate electrodes placed on the surface appear in white. The MM is placed on top of the gate electrode layer with a 100 nm thick insulator in between (shown in yellow shaded region). By applying negative voltages on the gate electrodes, we form six dots in total as pictorially indicated by four solid circles and two dotted circles. The four dots under the horizontal gate electrode named C are the qubit dots named QD1, QD2, QD3 and QD4 in red, yellow, green and blue, respectively and tunnel-coupled next to each other. The two dots above gate C are the sensor dots named S1, and S2 in red, and blue, respectively. The sensor dots are connected to the respective RF resonators configured by inductances and and stray capacitances and with resonance frequency of =298 MHz for S1 and =207 MHz for S2. We monitor the charge state of the QQD via the reflected RF signals 2007ReillyAPL ; 2010BarthelPRB , and of the two sensors at the respective resonance frequencies. The MM-ESR is performed by applying a microwave (MW) to gate C in the presence of an external magnetic field along the z-axis as shown in Fig.1 (a). The MM magnetizes in the direction and creates a stray field across the QQD. The shape of the MM is specially designed for the MM-ESR to address the four dots 2016NoiriAPL ; 2016OtsukaSciRep ; 2015YonedaAPEX such that the stray field produces a slanting field along x with z for driving the electron spin rotation and a local magnetic field along z that changes the resonance condition among the four dots. All measurements described below are conducted for the QQD device placed in a dilution fridge at a temperature of mK.
Fig.1 (b) shows the charge stability diagram measured by monitoring as a function of the voltages and of the plunger gates P1 and P4, respectively. We identify the dot-lead and inter-dot charge transition lines indicated by the dotted lines, and assign them in red, yellow, green and blue from horizontal to vertical to the dot-lead charge transition lines of QD1, QD2, QD3 and QD4, respectively. The inter-dot charge transition lines are observed as the lines in purple between the opposite cross points of two dot-lead charge transition lines. We denote the charge state as [,,,], where with = 1 to 4 is denoting the number of electrons confined in QDi. In the MM-ESR experiment we use Pauli spin blockade (PSB) in tunnel-coupled double QDs (DQDs) for the spin readout 2005PettaScience . Then the spin configuration, up or down is distinguished by measuring the transition between [2,0] (or [0,2]) and [1,1]. So in the following measurement we separate the QQD into two DQDs of QD1 - QD2 and QD3 - QD4, and mainly focus on the charge states of [2,0,0,1] and [1,1,0,1], and [1,0,1,1] and [1,0,0,2] to operate the MM-ESR in QD1 and QD2 with S1, and QD3 and QD4 with S2, respectively. Figs.1 (c) and (d) show the enlarged stability diagrams around the boundary line between [2,0,0,1] - [1,1,0,1], and [1,0,1,1] - [1,0,0,2], respectively.
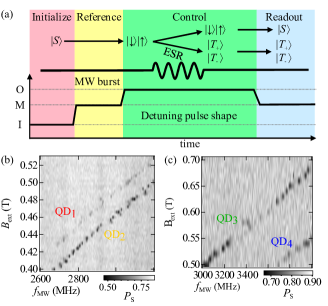
Fig.2 (a) shows a schematic of the gate voltage pulses for the ESR measurements. Here three voltage conditions named I, M and O are specified in Figs.1 (c) and (d) by the green circles to define the four operation sections, “Initialization” in red, “Reference” in yellow, “Control” in green and “Readout” in blue. In the “Initialization” section, the voltage condition is tuned to point I that is close to the charge transition line of the outer dots (QD1 and QD4). The two-electron spin state in QD1 - QD2 (or QD3 - QD4) is initialized to the ground doubly occupied singlet state in QD1 (or QD4) by exchanging electrons with the adjacent reservoir. In the “Reference” section the voltage condition is tuned to point M that is deep inside the Coulomb blockade region of the doubly occupied charge state [2,0,0,1] (or [1,0,0,2]). This stage does not influence the spin state and we obtain the background signal of the charge sensor in this section. In the “Control” section the voltage condition is ramped to point O where two electrons in QD1 (or QD4) are separated into QD1 and QD2 (or QD3 and QD4) to form [1,1,0,1] (or [1,0,1,1]) having the anti-parallel spin state 2005PettaScience ; 2016OtsukaSciRep . Then, a MW burst is applied on gate C to spatially oscillate electron spins in all dots in the MM induced . The electron spin coherently flips between and but independently in each QD when the resonance condition of is satisfied. Here is the MW frequency, is the Lande -factor of the electron confined in the QD, and is the Bohr magneton, respectively. Finally, in the “Readout” section with the voltage condition back to point M, the spin state is detected using PSB. When the spin is not flipped in either of QD1 or QD2 (or QD3 or QD4), the two-electron spin state returns to the doubly occupied in QD1 (or QD4). When the spin is flipped in either dot, the two-electron state is either or , the charge state remains singly occupied in QD1 - QD2 (or QD3 - QD4) without relaxing to the doubly occupied . Here, we measure the singlet return probability or probability of finding the two electron spin state in the by taking the difference of (or ) from that measured in the ”Reference” section (CDS method). Note this CDS technique is efficient to compensate the low frequency noise in the charge sensor.
Figs.2 (b) and (c) show as a function of and upon application of the MW pulse measured using S1 and S2, respectively. We observe two distinct lines due to ESR in QD1 and QD2 in (b) and QD3 and QD4 in (c). The separation of the two ESR lines in each figure is due to the Zeeman energy difference, which arises from the differences in the MM-induced and -factor among dots. This separation is much larger than the ESR line width of MHz and therefore enables us to access each resonance condition independently by choosing the and properly.
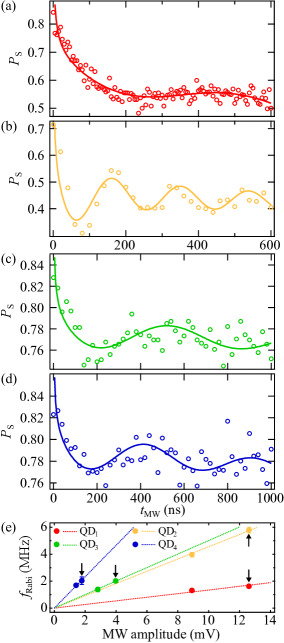
Next, we perform measurements of single-electron spin oscillations. We apply the same voltage pulse sequence as used in the ESR measurement but change the MW burst time in the “Control” section to see Rabi oscillations. Figs.3 (a), (b), (c), and (d) show the measured at the respective resonance condition of QD1, QD2, QD3 and QD4. We observe Rabi oscillations of the electron spin in each dot. The Rabi oscillations are best resolved in QD2 with frequency 5.32 MHz, the highest among all dots. On the other hand, the Rabi oscillation is less clear for the other QDs because of the lower frequency of about 2 MHz. Nevertheless, all Rabi oscillation data are well fitted by a power law envelope function with a phase shift 2007KoppensPRL cos. The last linear term accounts for the reduction of due to the leakage to non-qubit states presumably caused by photon-assisted tunneling 2010NadjaNature .
We measured Rabi oscillations for various MW output power values and derived from the curve fitting described above. The obtained values of are shown as a function of MW amplitude in Fig.3 (e). The MW amplitude is calculated from the applied and the RF line attenuation solely given by discrete attenuators ( dB). We observe linearly depending on the MW amplitude for each QD. We derive the slope of the linear fitting to the data points and find that it is different from dot to dot with ratio of for QD1 to QD4. The slope of the fitting line is related to the spin-electric coupling roughly proportional to the product of and where is the orbital spread along z axis and is the QD confinement energy. Considering the MM design used in this device, the value should gradually increase from QD1 to QD4. The experimental data seemingly agree with this trend but the observed variation of the slope is quantitatively larger than expected. We discuss this discrepancy later using Fig.4.
We note that we could not apply a large to the right DQD (QD3 and QD4) while we could to the left DQD (QD1 and QD2), because the ESR signals of QD3 and QD4 become obscure in the high range. So the Rabi oscillations shown in Figs. 3 (c) and (d) are only measured at a small , and therefore the oscillation frequency is significantly lower than that for QD2. This may not be related to the robustness of the ESR conditions because decreases with increasing even in the off-resonance conditions. One of the possible reasons is that the tunnel barrier between QD4 and the right reservoir is not well closed and the electron can tunnel out to the reservoir more easily as the becomes large.
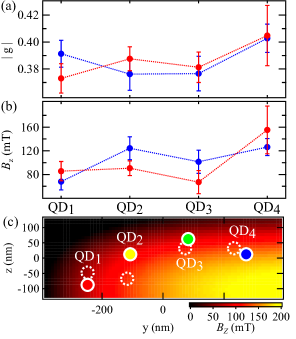
In what follows, we discuss the electron spin addressability in the QQD device. We estimate the -factors and values of individual QDs from the resonance lines in Figs.2 (b) and (c). These values are shown by the red circles in Figs. 4 (a) and (b). Those extracted from the data measured with the different gate voltage condition in our previous experiment 2016OtsukaSciRep are also shown by the blue circles. With both variations of and we are able to independently address the MM-ESR in each dot. Indeed, the difference alone will not be large enough to resolve resonances between QD1 and QD2 in the present experiment, because the ESR line separation will be only 20 MHz comparable to the ESR line width. The variation of between QDs may be explained by the difference in the confinement potential 2018MichalPRB . On the other hand, that of is probably due to variation of the dot position and inhomogeneity of the MM induced stray field. In support of this, we find the observed in each dot different when changing the gate voltage conditions. This result implies that is varied from dot to dot in a controlled manner with the gate voltage condition and therefore allows us to independently address the MM-ESR in each dot. Fig.4 (c) shows a two-dimensional distribution (y-z plane in Fig.1 (a)) of the calculated numerically from the shape of the MM and the QD positions that explain the results of Fig.4 (b). The solid, and dotted circles indicate the positions for the data set in red, and blue in Fig.4 (b), respectively. The variation of the dot positions suggests that the QDs are formed in a disordered manner due to e.g. charge impurities.
Finally, we discuss the variation of the MW amplitude dependence of among the four dots as observed in Fig.3 (e). The dot positions which can explain the values shown in Fig.4 (c) give the ratio of for QD1 to QD4. These values are numerically calculated in the same way with . This variation of among dots is too small to fully account for that of the slopes of MW amplitude dependence. The variation of the as shown in Fig.4 (a) can also influence the control speed but not so significantly. This discrepancy may be caused by inhomogeneity of the spin-electric coupling, which depends on the inhomogeneity of the confining potential profile and MM geometry or domain, although not well characterized.
In conclusion, we demonstrate coherent manipulations of four individual spins in a linearly coupled QQD with the MM-ESR method. The QQD is the largest multiple QD system ever used for coherent control of single electron spins. From measurements of Rabi oscillations and ESR signals, we quantified variations of the -factor and the MM induced stray field at the dot positions. Our analysis hints at inhomogeneity in the spin-electric coupling, which may be due to the inhomogeneous dot potentials or MM stray field. The results obtained here imply the gate-voltage-tunable addressability of four individual spins with the MM-ESR method, and therefore may pave the way towards the further scale-up of the spin qubit systems with QDs.
We thank the Microwave Research Group in Caltech for technical support. This work was supported financially by Core Research for Evolutional Science and Technology (CREST), Japan Science and Technology Agency (JST) (JPMJCR15N2, JPMJCR1675) and the ImPACT Program of Council for Science, Technology and Innovation (Cabinet Office, Government of Japan). T.I. acknowledges support from Materials Education program for the future leaders in Research, Industry, and Technology (MERIT). T.O. T.N. and J.Y. acknowledge support from RIKEN Incentive Research Projects. T.O. acknowledges support from Precursory Research for Embryonic Science and Technology (PRESTO) (JPMJPR16N3), JSPS KAKENHI grant numbers JP16H00817 and JP17H05187, Advanced Technology Institute Research Grant, the Murata Science Foundation Research Grant, Izumi Science and Technology Foundation Research Grant, TEPCO Memorial Foundation Research Grant, The Thermal and Electric Energy Technology Foundation Research Grant, The Telecommunications Advancement Foundation Research Grant, Futaba Electronics Memorial Foundation Research Grant and Foundation for Promotion of Material Science and Technology of Japan (MST) Foundation Research Grant. S.T. acknowledges support by JSPS KAKENHI grant numbers JP26220710 and JP16H02204.
References
- (1) D.P. DiVincenzo, Science 270, 255 (1995).
- (2) D. Loss and D.P. DiVincenzo, Phys. Rev. A 57, 120 (1998).
- (3) J.R. Petta, A.C. Johnson, J.M. Taylor, E.A. Laird, A. Yacoby, M.D. Lukin, C.M. Marcus, M.P. Hanson, and A.C. Gossard, Science 309, 2180 (2005).
- (4) F.H.L. Koppens, C. Buizert, K.J. Tielrooij, I.T. Vink, K.C. Nowack, T. Meunier, L. P. Kouwenhoven, and L.M.K. Vandersypen, Nature 442, 766 (2006).
- (5) M. Ciorga, A. Sachrajda, P. Hawrylak, C. Gould, P. Zawadzki, S. Jullian, Y. Feng, and Z. Wasilewski, Phys. Rev. B 61, R16315 (2000).
- (6) R.H. Blick, R.J. Haug, J. Weis, D. Pfannkuche, K.V. Klitzing, and K. Eberl, Phys. Rev. B 53, 7899 (1996).
- (7) L. Gaudreau, S.A. Studenikin, A.S. Sachrajda, P. Zawadzki, A. Kam, J. Lapointe, M. Korkusinski, and P. Hawrylak, Phys. Rev. Lett. 97, 036807 (2006).
- (8) T. Takakura, A. Noiri, T. Obata, T. Otsuka, J. Yoneda, K. Yoshida, and S. Tarucha, Appl. Phys. Lett. 104, 113109 (2014).
- (9) M.R. Delbecq, T. Nakajima, T. Otsuka, S. Amaha, J.D. Watson, M.J. Manfra, and S. Tarucha, Appl. Phys. Lett. 104, 183111 (2014).
- (10) T. Ito, T. Otsuka, S. Amaha, M.R. Delbecq, T. Nakajima, J. Yoneda, K. Takeda, G. Allison, A. Noiri, K. Kawasaki, and S. Tarucha, Sci. Rep. 6, 39113 (2016).
- (11) D.M. Zajac, T.M. Hazard, X. Mi, E. Nielsen, and J.R. Petta, Phys. Rev. Appl. 6, 054013 (2016).
- (12) T. Hensgens, T. Fujita, L. Janssen, X. Li, C.J. Van Diepen, C. Reichl, W. Wegscheider, S. Das Sarma, and L.M.K. Vandersypen, Nature 548, 70 (2017).
- (13) K.C. Nowack, F.H.L. Koppens, Y.V. Nazarov, and L.M.K. Vandersypen, Science 318, 1430 (2007).
- (14) M. Pioro-Ladrière, T. Obata, Y. Tokura, Y.-S. Shin, T. Kubo, K. Yoshida, T. Taniyama, and S. Tarucha, Nat. Phys. 4, 776 (2008).
- (15) R. Brunner, Y.-S. Shin, T. Obata, M. Pioro-Ladrière, T. Kubo, K. Yoshida, T. Taniyama, Y. Tokura, and S. Tarucha, Phys. Rev. Lett. 107, 146801 (2011).
- (16) J. Yoneda, T. Otsuka, T. Nakajima, T. Takakura, T. Obata, M. Pioro-Ladrière, H. Lu, C.J. Palmstrøm, A.C. Gossard, and S. Tarucha, Phys. Rev. Lett. 113, 267601 (2014).
- (17) A. Noiri, J. Yoneda, T. Nakajima, T. Otsuka, M.R. Delbecq, K. Takeda, S. Amaha, G. Allison, A. Ludwig, A.D. Wieck, and S. Tarucha, Appl. Phys. Lett. 108, 153101 (2016).
- (18) T. Otsuka, T. Nakajima, M.R. Delbecq, S. Amaha, J. Yoneda, K. Takeda, G. Allison, T. Ito, R. Sugawara, A. Noiri, A. Ludwig, A.D. Wieck, and S. Tarucha, Sci. Rep. 6, 31820 (2016).
- (19) M.D. Shulman, S.P. Harvey, J.M. Nichol, S.D. Bartlett, A. C. Doherty, V. Umansky, and A. Yacoby, Nat. Commun. 5, 5156 (2014).
- (20) D.J. Reilly, C.M. Marcus, M.P. Hanson, and A.C. Gossard, Appl. Phys. Lett. 91, 162101 (2007).
- (21) C. Barthel, M. Kjrgaard, J. Medford, M. Stopa, C.M. Marcus, M.P. Hanson, and A.C. Gossard, Phys. Rev. B 81, 161308(R) (2010).
- (22) J. Yoneda, T. Otsuka, T. Takakura, M. Pioro-Ladrière, R. Brunner, H. Lu, T. Nakajima, T. Obata, A. Noiri, C.J. Palmstrøm, A.C. Gossard, and S. Tarucha, Appl. Phys. Express 8, 084401 (2015).
- (23) F.H.L. Koppens, D. Klauser, W.A. Coish, K.C. Nowack, L.P. Kouwenhoven, D. Loss, and L.M.K. Vandersypen, Phys. Rev. Lett. 99, 106803 (2007).
- (24) S. Nadj-Perge, S.M. Frolov, E.P.A.M. Bakkers, and L.P. Kouwenhoven, Nature 468, 1084 (2010).
- (25) V.P. Michal, T. Fujita, T.A. Baart, J. Danon, C. Reichl, W. Wegscheider, L.M.K. Vandersypen, and Y.V. Nazarov, Phys. Rev. B 97, 035301 (2018).