Commensurate vs incommensurate charge ordering near the superconducting dome in Ir1-xPtxTe2 revealed by resonant x-ray scattering
Abstract
The electronic-structural modulations of Ir1-xPtxTe2 (0 0.12) have been examined by resonant elastic x-ray scattering (REXS) and resonant inelastic x-ray scattering (RIXS) techniques at both the Ir and Te edges. Charge-density-wave-like superstructure with wave vectors of =(1/5 0 1/5), (1/8 0 1/8), and (1/6 0 1/6) are observed on the same sample of IrTe2 at the lowest temperature, the patterns of which are controlled by the cooling speeds. In contrast, superstructures around =(1/5 0 1/5) are observed for doped samples (0.02 0.05). The superstructure reflections persist to higher Pt substitution than previously assumed, demonstrating that a charge density wave (CDW) can coexists with superconductivity. The analysis of the energy-dependent REXS and RIXS lineshape reveals the importance of the Te 5 state rather than the Ir 5 states in the formation of the spatial modulation of these systems. The phase diagram re-examined in this work suggests that the CDW incommensurability may correlate the emergence of superconducting states as-like CuxTiSe2 and LixTaS2.
pacs:
71.45.Lr, 78.70.Ck, 78.70Dm, 71.20.BeI Introduction
The interplay between spin-orbit coupling and the Coulomb interaction led to a renaissance in the study of transition-metal compounds, because it can lead to novel superconductivity competing with charge ordering of spin-orbit Mott states as in high- superconductors Mizokawa01 ; Kim08 ; Comin13 ; Comin15 ; Achkar13 ; Tranquada95 ; Ghiringhelli12 . When the electronic states are localized as in the Mott state, a charge-ordered-type modulation appears owing to intersite Coulomb interactions. Moreover, a charge modulation can be induced by the Peierls instability — the so-called charge density wave (CDW). In a system with heavy elements such as 5 transition-metals, the large spin-orbit interaction can stabilize the localized spin-orbit Mott state, as observed in the 5 transition-metal compounds, and then the charge-ordered Mott state leads to a novel framework of the interplay Ko15 ; Kim08 .
A CDW-like structural transition was reported in the 5 transition-metal chalcogenide IrTe2 at K Matsumoto99 ; Jobic92 . This has attracted great interest because of the recent discovery of superconductivity in Pt- and Pd-substituted or intercalated compounds Pyon12 ; Pyon13 ; Yang12 ; Qi12 ; Kamitani13 ; Kudo13 . With increasing Pt-substitution, the structural transition is suppressed and a superconducting dome appears in the region of 0.04 0.12, indicating similar diagrams those of other unconventional superconductors. Although numerous studies have followed these initial works, consensus about the mechanism for this structural transition is still lacking. The phase transition of IrTe2 () is accompanied by the emergence of a superstructure lattice modulation Yang12 , with wave vector =(1/5 0 1/5) as expressed in reciprocal lattice units in trigonal notation, which is illustrated in Fig. 1. The main elements are the Ir-Ir dimerization along the -axis with period 5, and the consequent distortion of the triangular Ir sublattice in the - plane, occurring together with a trigonal-to-triclinic symmetry reduction. The Ir-Ir dimerization stabilizes a unique stripe-like order, with stripes running along the -axis, as indicated by x-ray diffraction Cao13 ; Pascut14B ; Pascut13 ; Toriyama13 , extended x-ray absorption fine structure Joseph13 and resonant x-ray scattering Takubo14 studies. Since in IrTe2 the formal valence of Ir is +4, the Ir 5 electrons with configuration are the closest to the chemical potential, and they are thus expected to play a central role in the CDW. However, photoemission and optical studies have shown that the charge-transfer energy in IrTe2 is close to zero, and that the Te 5 states are also important for the low-energy physics Ootsuki12 ; Fang13 ; Qian13 . In addition, recent x-ray diffraction (XRD) Pascut14B ; Ko15 and scanning tunneling microscopy (STM) Hsu13 experiments revealed a further step-wise charge-ordering transition from to (1/8 0 1/8) and/or (1/11 0 1/11) below 200 K, while many studies reported that the -type superstructures survived at their lowest temperatures Toriyama13 ; Cao13 ; Takubo14 . Results from these studies also suggested that a CDW occurs at both of the Ir and Te sites at least near its surface region. Furthermore, in some studies, differences of the electronic state between surface and bulk states for IrTe2 have been reported. In another recent STM study for non-substituted IrTe2, a superconducting domain coexisting with very complex charge-ordering structures that only exist in the surface region were reported Kim16 . An exotic one-dimensional surface state was also observed on angular-resolved photoemission spectra by Ootsuki et al Ootsuki13 .
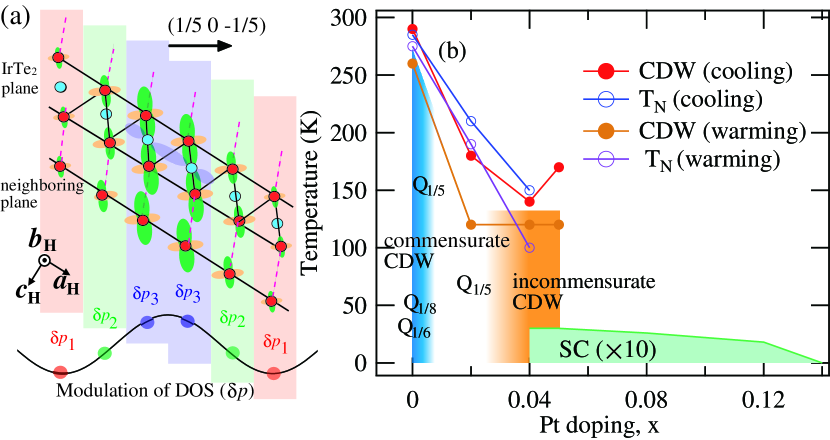
Moreover, a complex picture can be assumed for the relationship between such elusive CDW orders and superconducting orders in Pt-substituted Ir1-xPtxTe2. Because the phase digram of Ir1-xPtxTe2 exhibits a diagram similar to those of other unconventional superconductors, the idea of a quantum critical point inside the superconducting dome can be considered Pyon12 . However, it has been observed that many other transition-metal chalcogenides exhibit the coexistence of superconductivity with incommensurate CDW orders, where disorder effects and incommensuration of the CDWs suggested to be more important Morosan06 ; Li15 ; Joe14 ; Liu13 ; Sipos08 ; Kogar17 . In the intercalated 1-TaS2 and 1-TiSe2 systems, the superconductivity only coexists with incommensurate CDWs, although their mother compounds exhibit commensurate CDWs Sipos08 ; Liu13 ; Kogar17 .
To revisit the superstructures in Ir1-xPtxTe2 and to clarify the relation between superconductivity and superstructural modulation in the bulk region, we studied the spatial ordering of electronic states by means of bulk-sensitive methods: resonant elastic and inelastic x-ray scattering at edges of both Ir and Te. As a result, superstructure peaks with wave vectors of =(1/5 0 1/5), (1/8 0 1/8), and (1/6 0 1/6) are found on IrTe2 (=0.0) at the lowest temperature, which are governed by the cooling speeds. In contrast, the incommensurate ordering peaks around =(1/5 0 1/5) are observed for doped samples of 0.02 0.05 at low temperature, suggesting that CDWs can coexist with superconductivity for =0.05. The resonant elastic and inelastic x-ray scattering results at the Ir and Te edges emphasize the importance of the Te 5 states rather than Ir 5 states in the stripe-like ordering formation in these systems.
II Experiment
Single-crystal samples of Ir1-xPtxTe2 (0 0.12) were prepared using a self-flux method Fang13 ; Pyon13 ; Kudo13 . The cleaved (001) planes were used for all the scattering experiments. Resonant elastic x-ray scattering (REXS) at the Ir (2 5) absorption edge in the hard x-ray region were performed at Photon Factory’s BL-4C. REXS at the Te (2 5) absorption edge were conducted at BL-22XU of SPring-8. The polarization of incident x ray was perpendicular to the scattering plane. The samples were mounted so that [100] and [001] directions were in the scattering plane, although it was confirmed that the REXS spectra barely show the azimuthal dependence. Here, the reciprocal space indices ( ) refer to the high-temperature trigonal unit cell. The x-ray absorption spectra (XAS) at the Ir and Te edges were recorded by their fluorescence.
On the other hand, resonant inelastic x-ray scattering (RIXS) at the Ir edges were carried out at BL-11XU of SPring-8 Ishii13 . Incident x rays were monochromatized by a double-crystal Si(111) monochromator and a secondary Si(844) channel-cut monochromator. Horizontally scattered x rays were analyzed in energy by a spherically diced and bent Si(844) crystal. The total energy resolution was about 70 meV. The spectra for horizontally polarized incident x-rays were recorded near 86 degrees so that elastic scattering was reduced [See Fig. 5(d)]. The sample was also mounted so that the [100] and [001] directions span the scattering plane.
REXS at the Te (3 5) edge in the soft x-ray region were performed at the REIXS beamline of Canadian Light Source Hawthorn_RevSci . Single crystals were cleaved in vacuum to minimize surface contamination effects. The cleaved (001) plane was oriented at 54 degrees from the scattering plane in order to perform REXS measurements in the =( 0 ) plane. The polarization of the incident x ray was perpendicular to the scattering plane. XAS at the Te- edges were recorded in the total electron yield (TEY) modes. The XAS results using the TEY mode showed no noticeable difference with respect to spectra acquired in total fluorescence yield mode.
III Results and Discussion
III.1 Superstructures in IrTe2 (=0.0)
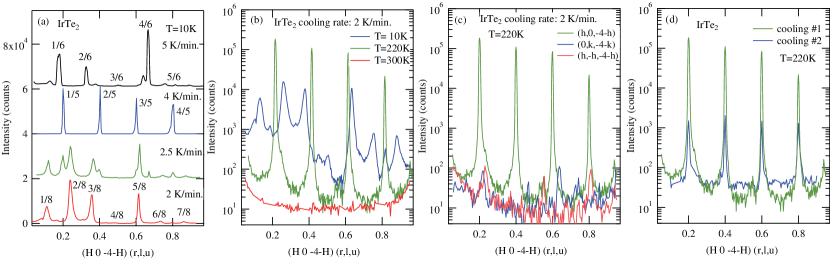
Figure 2 shows XRD along (0 0 4) to (1 0 5) through the superstructure peaks for IrTe2 (=0.0) taken with keV which is below the energy of the Ir absorption. The periods of the superstructures at low temperature strongly depend on the cooling protocols. As for the results of =0.0 shown in Fig. 2, the sample temperatures were continuously ramped down from =300 K to 220 K with various tuned cooling rates and once XRD was measured at =220 K. Then the samples were cooling down again to =10 K with the same speeds. These measurements were conducted for a fresh sample each time grown in a single batch. The measurements at =10 and 220 K took for 1 2 hours, including the time for alignment of the sample axes. When the cooling rate was set to 2 K/min, CDW-like superstructures with =(1/8 0 1/8) emerged at low temperature (=10 K) as shown in Fig. 2 (b). While only the Bragg peaks were observable at =300 K [Fig.2(b)-(d)], the =(1/5 0 1/5)-type ordering peaks appeared at =220K (below 280 K). Then, the modulation was subsequently changed to -type below 200 K, although the -type superstructures were reported for IrTe2 in the previous studies for these samples at the lowest temperature Takubo14 ; Toriyama13 ; Pyon13 . Although some diffuse scatterings were observed along the ( 0 ) reciprocal axis, the -type ordering stabilized at =10 K. This observation is similar to the step-wise charge-ordering cascade reported by Ko et al. for samples synthesized by other groups Ko15 . Upon heating, the peaks remain up to K and this phase directly transits to the high-temperature phase Ko15 . When the cooling speed was set to 4 K/min, however, the step-wise cascade transition to was not observed and superstructures with were stabilized even at the lowest temperature of K as shown in Fig. 2(a), which is consistent with the previous reports for the same samples Takubo14 ; Toriyama13 . However, the coexistence of and could be obtained with a medium-cooling speed of 2.5 K/min. Finally, superstructures around =(1/6 0 1/6) coexisting with weak peaks appeared with the fastest cooling speed above 5 K/min. ordering for IrTe2 has not ever been reported previously, while similar superstructures were obtained for IrTe2-xSex () Oh13 ; Pascut14B . These observation strongly supports a scenario of anionic depolymerization transition, as suggested by Oh et al. Oh13 , where depolymerization-polymerization occur between the anionic Te-Te bonds across the transition. The covalence of the Te-Te bonds is partially lost across the transition, depolymerizing the Te-Te networks and leading to the diversity of superstructures.
The superstructures appear along one direction ( 0 4) of the triangular lattices and are not observable along other two directions of (0 4) and ( 4) as plotted in Fig. 2(c), indicating formation of a single-domain structure with an x-ray spot size of 1 mm2. CDW distortion seemed to occur along one side of the triangular axis in these hard x-ray experiments, although multi domain structures were reported in previous soft x-ray and low-energy electron diffraction experiments Takubo14 . The evolution of the domain structures and superstructures seems to depend on the sample condition. Figure 2(d) shows the patterns at =220 K of the first and second cooling-warming cycles taken for the same sample, which are normalized by the intensity of the Bragg peak of (004). The superstructure intensities at the second cooling attempt were 10-2 order of magnitude smaller than those at the first attempt. Since the structural transition of IrTe2 across is very steep and can cause cracks in the crystal, long-range ordering would be weakened after the cooling cycle.
It should be noted that the pattern of the superstructures could also depend on many other subtle conditions. For example, the cracks mentioned above seem to change the thermal condition. We also tried the repeated — cooling and warming — measurements on a single sample but did not observe a clear reproducibility. However, superlattices were obtained in many cases, even when the cooling speeds were set to above 4 K/min. The thermal conductance from cryostat would become worse by the cracks and this tendency would still be consistent with the scenario of the cooling-rate dependence. In addition, the drift of the observations with time was also appeared if the temperature was fixed at the range between =80 and 200 K. The diffuse scattering along the ( 0 ) axis were sometimes observed at this temperature range (not shown). However, these drifts seemed to be very slow taking several hours, and a clear reproducibility has not been obtained. A further study will be needed in order to clarify this point.
III.2 Doping dependence of superstructure
Next, to clarify the relation between the CDW-like structural modulation and superconductivity, the evolution of the superstructure peaks with Pt doping is examined by XRD for Ir1-xPtxTe2. As for the results shown in Fig. 3, the averaged cooling rates were set to 2.5 K/min. The measurements took 10 min. at each temperature. The modulation periods only slightly depend on the cooling speeds, and cascade transition to were not observed for the doped samples (0.02 0.05). As can be seen, the CDW-like superstructures of Q1/5 are observed for =0.02 below 140 K. In addition, the superstructures around are also found on =0.04 and 0.05 samples at low temperature. Although =0.04 show some sample dependence of the structural and superconducting transition temperatures which may originate from its inhomogeneity Pyon13 ; Kudo13 , all the =0.05 samples including the batch used in this study show the superconductivity and do not show any anomaly at 140 K on the macroscopic conductivity and magnetization measurements [see Fig. 1(b)]. The superstructures for =0.05 are 10-2 order of magnitude smaller than that for =0.02 but certainly observable around . 4 pieces of =0.05 crystals were investigated and similar superlattices were found on all the pieces. The microscopic phase separation of the majority superconducting and minority charge ordered domains may occur in the =0.05 samples. On the other hand, the superstructures disappears in =0.08 and 0.12 [Fig. 3(b)]. CDW with seems to persist to higher doping level () than previously thought and coexists with the superconducting state. Furthermore, CDW incomensuration is found along the ( 0 ) direction for =0.04 and 0.05 near the superconducting dome. Although the superstructures are perfectly commensurate with the lattice for =0.0 and 0.02, the peaks for =0.04 and 0.05 shift to the lower- side. The peak widths also broaden as the doping level increases. These observations are very similar to the results obtained for CDW in 1-TaS2 Sipos08 and 1-TiSe2 Kogar17 ; Joe14 systems, where the incommensuration of CDWs also coincides with the onset of superconductivity. Both electron-phonon and electron-hole couplings have been suggested to play significant roles in of these systems Kogar17 . Therefore, similar mechanisms may also be important in driving the superconductivity of Ir1-xPtxTe2. Another possibility for driving the incommensurability of =0.04 and 0.05 is the coexistence of - and - type domains in the microscopic region, as observed in the STM studies for IrTe2 where various kinds of ordered domains coexists on nanometer scales Hsu13 ; Kim16 . Since the superconducting transition temperature at =0.05 is similar to those for 0.05 without CDW, it is naturally speculated that the superconducting phase at =0.05 is different from the incommensurate CDW phase observed at =0.04 and 0.05. However, the incommensurability of CDW shows that the phase separated =0.05 state is not a mere mixture of the commensurate CDW phase at =0.0 and the superconducting phase for 0.05. In this sense, the incommensurability of CDW is associated with the emergence of superconductivity.
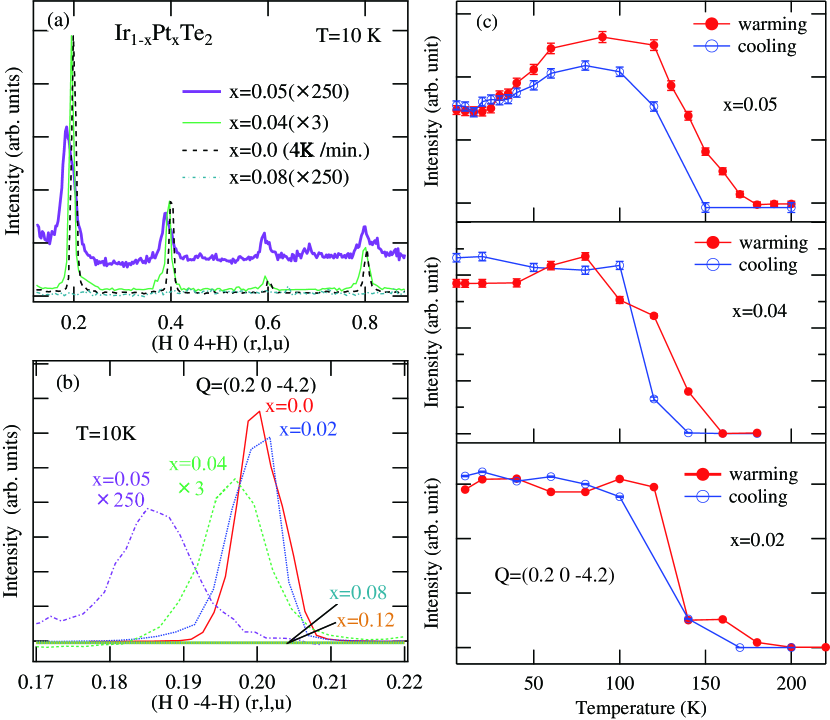
Figure 3(c) shows the detailed temperature dependence of the superstructure intensities around for =0.02, 0.04 and 0.05, measured across during both cooling and warming cycles. The cooling-warming rates were set to 4 K/min. The signals show sharp onsets having some hysteretic behaviors at 150 K for =0.02, 140 K for =0.04, and 140 K for =0.05, indicating the first-order character of these transitions. Furthermore, the intensity of the superstructures in superconducting =0.05 is suppressed below 50 K again. Similar suppression of the CDW intensities near the superconducting dome was reported for CDW in high-temperature superconducting cuprates Ghiringhelli12 , indicating that these systems may harbor similar exotic phases.
III.3 REXS at Ir edge
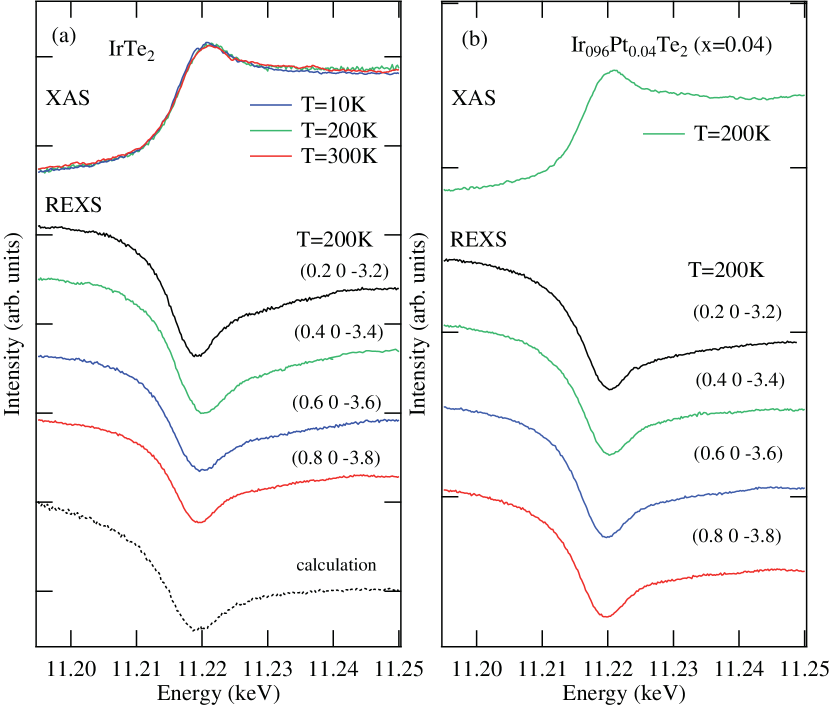
The spatial modulation of the electronic states in the Ir sites was investigated using the resonance at the Ir absorption at 12.2 keV Kamitani13 ; Clancy12 . Figure 4 shows the REXS and x-ray absorption spectra for (a) =0.0 and (b) =0.04. However, no noticeable Q-dependence is observed for the REXS spectra at the Ir edge. Although the REXS signals at the Te edges are resonantly enhanced in the XAS-peak region, as shown in Ref. Takubo14 and later sections, only the dip structures were observed on REXS at the Ir edge. While the REXS spectra for the Te edges can be modeled by using (i) valence modulation or (ii) energy shift models in the previous study Takubo14 ; Achkar13 , such dip structures on REXS without a Q-dependence can only be reproduced by the calculation with (iii) a lattice displacement model such as given in the bottom of Fig. 4(a). In this calculation, the form factors for different Ir and Te sites are evaluated from XAS. The wavevector (Q) and photon-energy () dependent structure factor are subsequently constructed based on the spatial modulation of at different atomic positions :
| (1) |
In the lattice displacement model, the major contribution to originates from , where small displacements are used for the Ir and Te lattice sites in the modulated structure. Here, are site-independent; namely, no electronic modulation is assumed in the Ir sites. If are assumed to have a modulation as large as 0.3 eV, the calculated line shape exhibits a large Q-dependence and conflicts with the present experimental observation (with further details of the calculation given in the Appendix). Therefore, these REXS results indicate that the electronic states in the Ir sites scarcely have spatial modulation, apparently contradicting the previous x-ray photoemission results Ko15 ; Qian13 ; Ootsuki12 . Since REXS at the Ir edge is a highly bulk-sensitive technique compared to photoemission, the discrepancy may arise from the electronic structural difference between the bulk and surface regions suggested in the recent STM experiment Kim16 . The charge ordering in the Ir sites may only exist in their surface region, but the charge ordering in the bulk of Ir1-xPtxTe2 seems to occur in the Te orbitals rather than the Ir orbitals.
III.4 RIXS at Ir edge
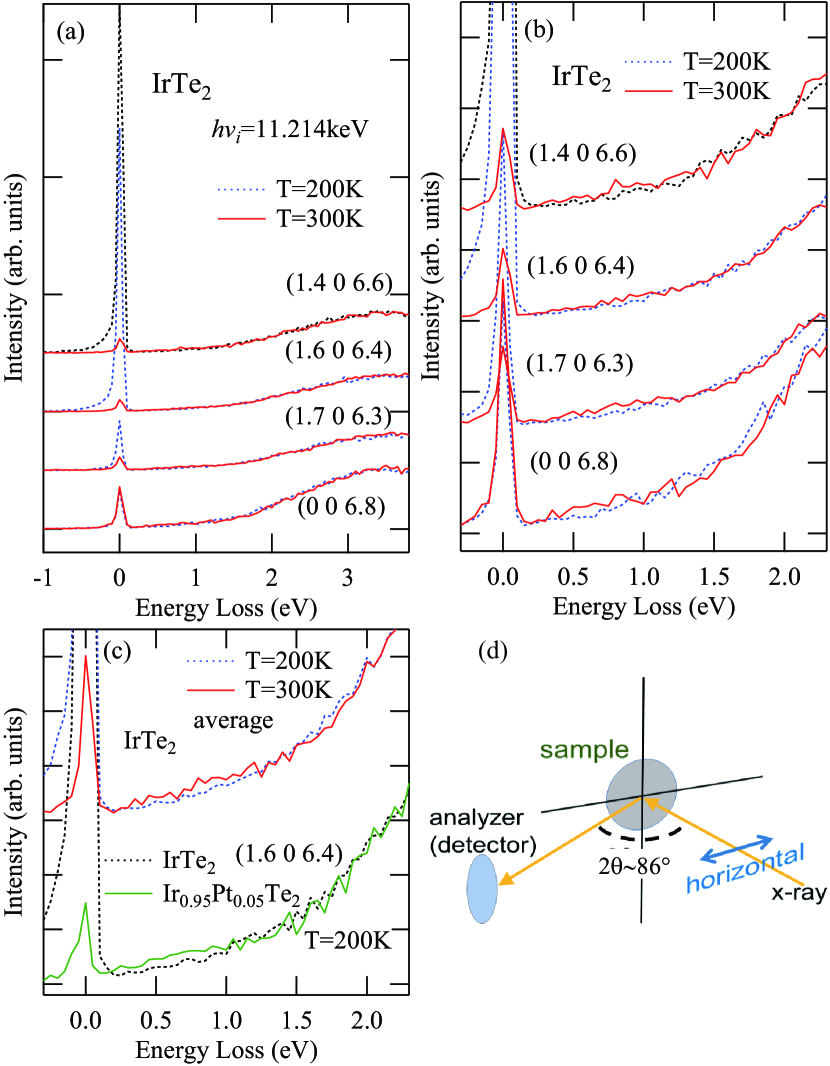
To further examine the electronic structural evolution in the Ir sites at the specific Q positions, RIXS spectra have been acquired with incident energies of = 11.214 keV near the top of the Ir -edge. The data are shown in Fig. 5(a) and 5(b) for IrTe2 and in Fig. 5(c) for Ir0.95Pt0.05Te2 (=0.05). Distinct elastic diffraction (=0) is observed at the superstructural positions of Q=(1.4 0 6.6) and (1.6 0 6.4) at =200 K (below ) for IrTe2. Asymmetric lineshape of the elastic peak comes from residual strain in the diced analyzers crystal. Some diffusive diffraction along ( 0 ) is also observable at Q=(1.7 0 6.3) at = 200 K. Strong fluorescence is observed around 2-4 eV energy loss at all positions, which is associated with the hybridization effects between the transition-metal and chalcogen states Monney13 ; Takubo17 . In contrast, the - excitations across the Ir bands observed between 0.5 and 1.5 eV are very weak compared to those obtained for Ir oxides Ishii13 . These observations indicate that the holes near the Fermi-level and its spatial modulation reside in the Te orbitals rather than in the Ir orbitals and are consistent with the REXS results at the edge described before. Although the spectral change across is very small, the tendency is similar to that observed in RIXS for CuIr2S4 across [see averaged (sum) spectrum in Fig. 5(c) and in Fig. 4 of Ref. Gretarsson11, ]. The spectral weight near the Fermi-level (0.5 eV) are transferred into the higher energy region of 1.5 eV below , qualitatively in agreement with the reconstruction of band structure near the Fermi level up to 2 eV in the optical conductivity measurement Fang13 . In addition, the spectral difference between Ir0.95Pt0.05Te2 (=0.05) and the low temperature phase of IrTe2 taken at =200 K is similar to the temperature dependence of IrTe2 across [Fig.5(c)], indicating that these electronic evolutions definitely reflects the structural transition of these systems. The spectral shapes of the - excitation scarcely depend on the Q positions, which are also similar to the case of CuIr2S4 Gretarsson11 .
III.5 REXS at Te and edges
Finally, the spatial modulation in the Te sites is investigated using REXS at the Te edges. Figure 6 shows ( 0 ) momentum scans and their temperature dependences through the resonant peak for Ir1-xPtxTe2 (=0.0, 0.04 and 0.05) at a photon energy of 571.3 eV, corresponding to the Te- pre-peak position. REXS signals on the superstructures around Q=(0.2 0 0.2) are clearly observed on all samples of =0.0, 0.04, and 0.05 at the low temperature, consistent with the hard x-ray experiments described before. The CDW incomensurations, namely peak-shift to the lower- side and broadening of the widths are also found on =0.04 and 0.05 near the onset of the superconducting dome. The cooling rates were 4 K/min. and the cascade transition to was not found in these soft x-ray experiments. This difference could arise from the difference of the charge order between the surface and bulk region due to the different penetration depths for soft and hard x-ray experiments, while Q1/8-type order was reported on a surface sensitive STM study by Hsu in Ref. [27]. Similar to the hard x-ray experiment, all of the superstructural signals show sharp onsets at 280 K for =0.0, 130 K for =0.04, and 120 K for =0.05, respectively, indicating again the first-order character of these phase transitions.
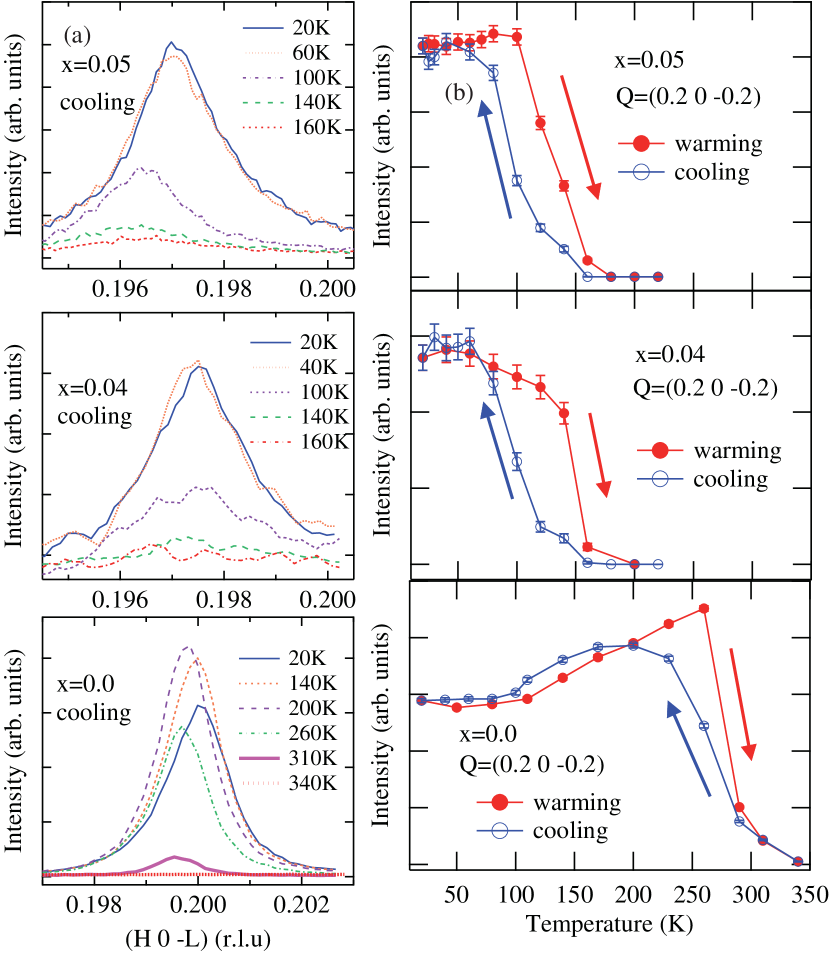
Figure 7 shows the Te- pre-edge spectra which reflect the covalency between Te 5 and Ir 5 orbitals, or unoccupied partial density of states (DOS) in the Te sites Takubo14 . The XAS spectra at =300 K shift to higher energy as the doping increases, indicating chemical potential shifts or electron dopings into the Te 5 orbitals induced by the Pt substitution [Fig.7 (a)]. The spectral change of XAS across the transition for IrTe2 is consistent with the result of the band structure calculations Pascut13 ; Toriyama13 ; Qian13 . While the XAS spectra barely show any temperature dependence for =0.05, the energy-dependent lineshape of REXS for =0.05 at =20 K is very similar to that for =0.0, as can be seen in Fig. 7(b) and 7(c). These features of REXS for =0.0, namely dip-hump structures at Te- is an evidence of the modulation of the unoccupied DOS for the five structurally inequivalent Te sites Takubo14 . The charge ordering in the Te sites of =0.05 will exist in the partial small domain and the spatial modulation in it will be qualitatively similar to that for =0.0.

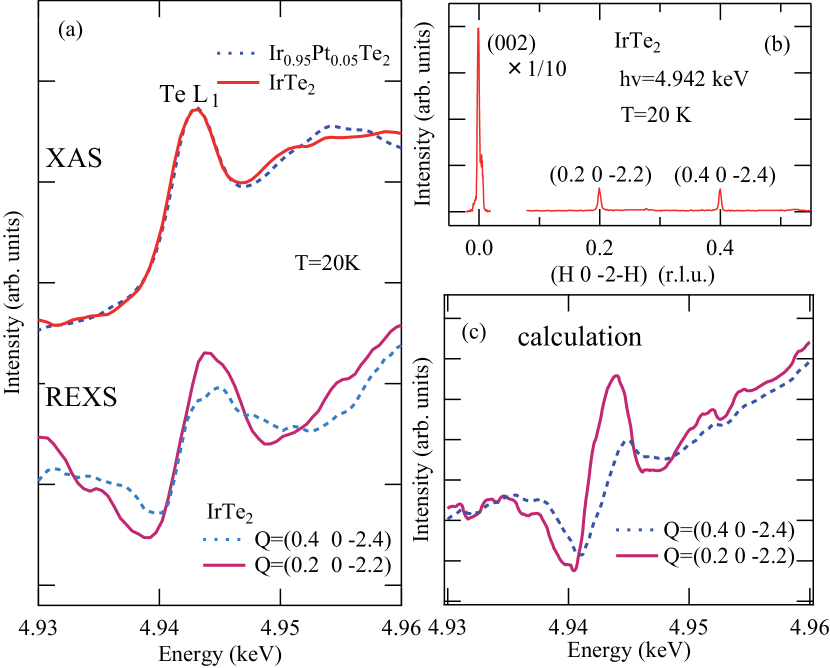
One may consider that REXS at the Te edges is a rather surface sensitive technique comparable to the photoemission spectroscopy, since the Te edges are in the soft x-ray region. Then the fact that the charge modulation on REXS are observed at Te but not at Ir edge will not reflect the difference between the Te and Ir sites. However, the dip-hump structure and Q dependent lineshape are also observed on the bulk-sensitive REXS at the Te edge as shown in Fig. 8. The XAS and REXS spectra at the Te edge for IrTe2 are plotted in Fig. 8(a) and a corresponding momentum scan is plotted in Fig. 8(b). The signals of REXS on Q=(0.2 0 2.2) and (0.4 0 2.4) are resonantly enhanced at the Te edge and the dip features are observed before the peak structures, which is just similar to REXS at the Te edge. In addition, REXS at the Te edge exhibits a certain Q dependence in contrast to the case for the Ir edge. The resonant enhancement at the peak of Q=(0.4 0 2.4) is indistinctive compared to that of Q=(0.2 0 2.2), while the dip structures are noticeable at the both positions. These line shapes for IrTe2 can be modeled by the valence-modulation model with just same parameters for REXS at the Te edges given in Ref. Takubo14 [Fig. 8(c)]. In the valence-modulation model, the major contribution to arises from , where is the variation in the local valence of the Te ions. The parameters are =-0.6, = -0.6, = -0.15, =0.9, and =-0.15 and proportional to the local DOS at the Te sites which are illustrated in Fig.1 (a). Therefore, we safely conclude that the spatial charge modulation of IrTe2 exists in the Te sites even in the bulk region, following the striped formation with =(1/5 0 1.5).
IV Summary
We have examined the charge modulation of the Ir and Te sites in Ir1-xPtxTe2 by means of the resonant x-ray scattering technique. The Q=(1/5 0 1/5)-, (1/8 0 1/8)-, and (1/6 0 1/6)- type superstructures are observed for IrTe2 (=0.0) at low temperature. The superstructures around =(1/5 0 1/5) coexist with the superconducting phase for Ir1-xPtxTe2 (=0.05), suggesting CDW persist to higher Pt substitution than previously thought. The incommensuration of CDW is observed for =0.04 and 0.05 samples which coincide with the onset of the superconductivity. The REXS and RIXS spectra for the Ir edge scarcely depend on the wavevectors, while REXS spectra at the Te edges indicates the spatial charge modulation on the Te sites. The charge modulation in the bulk regions seems to reside in the Te orbitals rather than the Ir orbitals.
Acknowledgements
The authors thank Dr. D. Ootsuki for valuable discussions. REXS measurement at the Te edges in this paper was performed at the Canadian Light Source, which is supported by the Canada Foundation for Innovation, Natural Sciences and Engineering Research Council of Canada, the University of Saskatchewan, the Government of Saskatchewan, Western Economic Diversification Canada, the National Research Council Canada, and the Canadian Institutes of Health Research. REXS measurements at the Ir edge were performed under the approval of the Photon Factory Program Advisory Committee (Proposals No. 2015G556, 2015S2-007) at the Institute of Material Structure Science, KEK. RIXS measurement at the Ir edge and REXS measurements at the Te edge were performed under the approval of SPring-8 (Proposals No. 2014B3787 and 2016A3564). This works was supported by the Japan Society for the Promotion of Science (JSPS) of Grant-in-Aid for Young Scientists (B) (No. 16K20997).
Appendix A Detail of the calculation of REXS intensity
The calculation of the REXS intensity is structured similarly to the method in the previous REXS study for IrTe2 at the Te edges Takubo14 . The details were presented in the supplementary of Ref. Takubo14, , thus the essential parts are pointed here. The scattering intensity can be expressed as:
| (2) |
The calculation is performed for three different methods Achkar13 , namely: (i) valence modulation model, corresponding to a periodic variation in the local valence of Ir or Te ions; (ii) energy shift model, assuming a spatial modulation in the energy of the Ir 5 or Te 5 states; and (iii) lattice displacement model, where small displacement are used for the Te and Ir lattice sites in the supermodulated structure. These models are subsequently implemented in the calculation of the structure factor which is written generally as Eq. (1) in the main text. In Eq. (1), is the position vector in the undistorted structure at site and is the displacement from the lattice position due to the structural modulation. The atomic form factor can also depend on additional parameters related to the electronic structure of the atom at , such as the local charge density or energy levels; these factors are explicitly included in the respective models. More specifically, all the energy dependent terms are included in the atomic form factor , while the atomic positions or displacements are of course energy-independent.
The form factor Im can be determined from the XAS spectra which are offset and scaled to calculated values of the absorption coefficient (from NIST NIST95 ) in order to express in units of . Via the optical theorem, Im is linearly proportional to the absorption coefficient , and Re can be determined from Im using Kramers-Kronig transformations. Accordingly, to express in electrons/atom, experimental XAS have been scaled and extrapolated to high and low energy using tabulated calculations of Im above and below the absorption edge.
A.1 Valence modulation model
The valence (or local DOS) modulation model takes into account spatial modulations in the local DOS at the Ir and Te sites as;
| (3) |
We determine as a function of the local DOS modulation by performing a linear extrapolation from the measured with XAS at 300 K (HT phase) and 200 K (LT phase). The scattering intensity is given by:
| (4) |
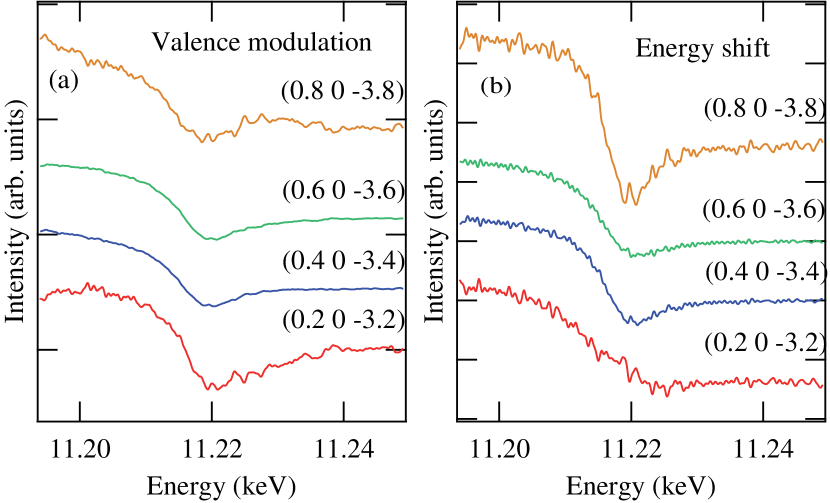
The corresponding calculation for the Ir edge, shown in Fig. 9(a), uses parameters =-0.6, = -0.6, = -0.15, =0.9, and =-0.15 which were used in the previous study. However, the results have a certain -dependence and cannot reproduce the experimental feature for the Ir edge. On the other hand, these models with nonresonant lattice displacement terms describe well the REXS results at the Te- in the previous study Takubo14 and edges as discussed in Sec. III.E.
A.2 Energy shift model
Secondly, the enegy shift model is considered. The difference with the valence modulation model is that here we use the spatial variation of the energy shift in place of the local DOS; in this case, the structure factor for the Ir-striped model is given by:
| (5) |
Therefore the scattering intensity can be written as:
| (7) |
The calculated results for Ir using this model are shown in Fig. 9 (b) with = -0.3 eV, = -0.05 eV, = 0.2 eV, = 0.2 eV, = -0.05 eV, which parameters were used in the previous study for the Te edge. However, the Q-dependence are appeared on this calculation similar to the valence modulation model, and therefore REXS at the Ir edge cannot be described within this model.
A.3 Lattice displacement model
For the lattice displacement model, is the same at each site, but lattice positions are displaced, i.e. . Considering a chain of 5 Te and/or Ir sites separated by (, 0, -) (0, 0, ), the structure factor is given by:
| (8) |
In the limit of small displacements, we can expand the exponential terms to first order and write the REXS intesity as:
| (9) | |||||
| (10) |
This result holds even if one includes higher order terms in the series expansion. Moreover, the magnitude of the displacements has no impact on the energy nor Q-dependence of the calculated scattering intensity, since no modulation was assumed in the electronic state of each sites or . The calculated result for the Ir edge using lattice displacement model are plotted in the bottom of Fig. 4 (a) and well reproduced the experimental result. On the other hand, the REXS at Te edge are unable to be reproduced by this model, since the experimental results exhibits a certain Q-dependence as discussed in the main text.
References
- (1) J. M. Tranquada, B. J. Sternlieb, J. D. Axe, Y. Nakamura, and S. Uchida, Nature 375, 561-563 (1995).
- (2) T. Mizokawa, L. H. Tjeng, G. A. Sawatzky, G. Ghiringhelli, O. Tjernberg, N. B. Brookes, H. Fukazawa, S. Nakatsuji, and Y. Maeno, Phys. Rev. Lett. , 077202 (2001).
- (3) B. J. Kim, Hosub Jin, S. J. Moon, J.-Y. Kim, B.-G. Park, C. S. Leem, Jaejun Yu, T. W. Noh, C. Kim, S.-J. Oh, J.-H. Park, V. Durairaj, G. Cao, and E. Rotenberg, Phys. Rev. Lett. 101, 076402 (2008).
- (4) G. Ghiringhelli, M. Le Tacon, M. Minola, S. Blanco-Canosa, C. Mazzoli, N. B. Brookes, G. M. De Luca, A. Frano, D. G. Hawthorn, F. He, T. Loew, M. Moretti Sala, D. C. Peets, M. Salluzzo, E. Schierle, R. Sutarto, G. A. Sawatzky, E. Weschke, B. Keimer, and L. Braicovich, Science 337, 821 (2012).
- (5) A. J. Achkar, F. He, R. Sutarto, J. Geck, H. Zhang, Y.-J. Kim, and D. G. Hawthorn, Phys. Rev. Lett. 110, 017001 (2013).
- (6) R. Comin, A. Frano, M. M. Yee, Y. Yoshida, H. Eisaki, E. Schierle, E. Weschke, R. Sutarto, F. He, A. Soumyanarayanan, Yang He, M. Le Tacon, I. S. Elfimov, J. E. Hoffman, G. A. Sawatzky, B. Keimer, and A. Damascelli, Science 343, 382 (2014).
- (7) R. Comin, R. Sutarto, E. H. da Silva Neto, L. Chauviere, R. Liang, W. N. Hardy, D. A. Bonn, F. He, G. A. Sawatzky, and A. Damascelli, Nature Materials 14, 796-800 (2015).
- (8) K.-T. Ko, H.-H. Lee, D.-H. Kim, J.-J. Yang, S.-W. Cheong, M.J. Eom, J.S. Kim, R. Gammag, K.-S. Kim, H.-S. Kim, T.-H. Kim, H.-W. Yeom, T.-Y. Koo, H.-D. Kim, and J.-H. Park. Nature Commun. 6, 7342 (2015).
- (9) S. Jobic, R. Brec, and J. Rouxel, J. Solid State Chem. 96, 169 (1992).
- (10) N. Matsumoto, K. Taniguchi, R. Endoh, H. Takano, and S. Nagata, J. Low. Temp. Phys. 117, 1129 (1999).
- (11) S. Pyon, K. Kudo, and M. Nohara, J. Phys. Soc. Jpn. 81, 053701 (2012).
- (12) J. J. Yang, Y. J. Choi, Y. S. Oh, A. Hogan, Y. Horibe, K. Kim, B. I. Min, and S.-W. Cheong, Phys. Rev. Lett. 108, 116402 (2012).
- (13) Y. P. Qi, S. Matsuishi, J. G. Guo, H. Mizoguchi, and H. Hosono, Phys. Rev. Lett. 109, 217002 (2012).
- (14) S. Pyon, K. Kudo, and M. Nohara, Physica C 494, 80 (2013).
- (15) M. Kamitani, M. S. Bahramy, R. Arita, S. Seki, T. Arima, Y. Tokura, and S. Ishiwata, Phys. Rev. B 87, 180501 (2013).
- (16) K. Kudo, M. Kobayashi, S. Pyon, and M. Nohara, J. Phys. Soc. Jpn. 82, 085001 (2013).
- (17) H. Cao, B. C. Chakoumakos, X. Chen, J. Yan, M. A. McGuire, H. Yang, R. Custelcean, H. Zhou, D. J. Singh, and D. Mandrus, Phys. Rev. B 88, 115122 (2013).
- (18) G. L. Pascut, K. Haule, M. J. Gutmann, S. A. Barnett, A. Bombardi, S. Artyukhin, T. Birol, D. Vanderbilt, J. J. Yang, S.-W. Cheong, and V. Kiryukhin, Phys. Rev. Lett. 112, 086402 (2014).
- (19) G. L. Pascut, T. Birol, M. J. Gutmann, J. J. Yang, S.-W. Cheong, K. Haule, and V. Kiryukhin, Phys. Rev. B. 90, 195122 (2014).
- (20) T. Toriyama, M. Kobori, Y. Ohta, T. Konishi, S. Pyon, K. Kudo, M. Nohara, K. Sugimoto, T. Kim, and A. Fujiwara, J. Phys. Soc. Jpn. 83, 033701 (2014).
- (21) B. Joseph, M. Bendele, L. Simonelli, L. Maugeri, S. Pyon, K. Kudo, M. Nohara, T. Mizokawa, and N. L. Saini, Phys. Rev. B 88, 224109 (2013).
- (22) K. Takubo, R. Comin, D. Ootsuki, T. Mizokawa, H. Wadati, Y. Takahashi, G. Shibata, A. Fujimori, R. Sutarto, F. He, S. Pyon, K. Kudo, M. Nohara, G. Levy, I. S. Elfimov, G. A. Sawatzky, and A. Damascelli, Phys. Rev. B 90, 081104(R) (2014).
- (23) T. Qian, H. Miao, Z. J. Wang, X. Liu, X. Shi, Y. B. Huang, P. Zhang, N. Xu, P. Richard, M. Shi, M. H. Upton, J. P. Hill, G. Xu, X. Dai, Z. Fang, H. C. Lei, C. Petrovic, A. F. Fang, N. L. Wang, and H. Ding, New J. Phys. 16 123038 (2014).
- (24) D. Ootsuki, Y. Wakisaka, S. Pyon, K. Kudo, M. Nohara, M. Arita, H. Anzai, H. Namatame, M. Taniguchi, N.L. Saini, and T. Mizokawa, Phys. Rev. B 86, 014519 (2012).
- (25) A. F. Fang, G. Xu, T. Dong, P. Zheng, and N. L. Wang, Sci. Rep. 3, 1153 (2013).
- (26) Y. S. Oh, J.J. Yang, Y. Horibe, and S.-W. Cheong, Phys. Rev. Lett. 110, 127209 (2013).
- (27) P.-J. Hsu, T. Mauerer, M. Vogt, J. J. Yang, Y. S. Oh, S-W. Cheong, M. Bode, and W. Wu, Phys. Rev. Lett. 111, 266401 (2013).
- (28) H. S. Kim, S. Kim, K. Kim, B. Il Min, Y.-H. Cho, L. Wang, S.-W. Cheong, and H. W. Yeom, Nano Lett. 16, 4260-4265 (2016).
- (29) D. Ootsuki, S. Pyon, K. Kudo, M. Nohara, M. Horio, T. Yoshida, A. Fujimori, M. Arita, H. Anzai, H. Namatame, M. Taniguchi, N. L. Saini, and T. Mizokawa, J. Phys. Soc. Jpn. 82, 093704 (2013).
- (30) E. Morosan, H.W. Zandbergen, B. S. Dennis, J.W. G. Bos, Y. Onose, T. Klimczuk, A. P. Ramirez, N. P. Ong, and R. J. Cava, Nat. Phys. 2, 544 (2006).
- (31) B. Sipos, A. F. Kusmartseva, A. Akrap, H. Berger, L. Forró, and E. Tutiš, Nat. Mater. 7, 960 (2008).
- (32) Y. Liu, R. Ang,W. J. Lu,W. H. Song, L. J. Li, and Y. P. Sun, Appl. Phys. Lett. 102, 192602 (2013).
- (33) Y. I. Joe, X. Chen, P. Ghaemi, K. Finkelstein, G. de La Peña, Y. Gan, J. Lee, S. Yuan, J. Geck, G. MacDougall, T. C. Chiang, S. L. Cooper, E. Fradkin, and P. Abbamonte, Nat. Phys. 10, 421 (2014).
- (34) L. Li, E. O’Farrell, K. Loh, G. Eda, B. Özyilmaz, and A. C. Neto, Nature (London) 529, 185 (2015).
- (35) A. Kogar, G. A. de la Pena, S. Lee, Y. Fang, S. X.-L. Sun, D. B. Lioi, G. Karapetrov, K. D. Finkelstein, J. P. C. Ruff, P. Abbamonte, and S. Rosenkranz, Phys. Rev. Lett. 118, 027002 (2017).
- (36) K. Ishii, T. Tohyama, and J. Mizuki, J. Phys. Soc. Jpn. 82, 021015 (2013), and references therein.
- (37) D. G. Hawthorn, F. He, L. Venema, H. Davis, A. J. Achkar, J. Zhang, R. Sutarto, H. Wadati, A. Radi, T. Wilson, G. Wright, K. M. Shen, J. Geck, H. Zhang, V. Novk, and G. A. Sawatzky, Rev. Sci. Instrum. 82, 073104 (2011).
- (38) J. P. Clancy, N. Chen, C. Y. Kim, W. F. Chen, K. W. Plumb, B. C. Jeon, T. W. Noh, and Young-June Kim, Phys. Rev. B 86, 195131 (2012).
- (39) C. Monney, A. Uldry, K. J. Zhou, A. Krzton-Maziopa, E. Pomjakushina, V. N. Strocov, B. Delley, and T. Schmitt, Phys. Rev. B 88, 165103 (2013).
- (40) K. Takubo, Y. Yokoyama, H. Wadati, S. Iwasaki, T. Mizokawa, T. Boyko, R. Sutarto, F. He, K. Hashizume, S. Imaizumi, T. Aoyama, Y. Imai, and K. Ohgushi, Phys. Rev. B 96, 115157 (2017).
- (41) H. Gretarsson, J. Kim, D. Casa, T. Gog, K. R. Choi, S. W. Cheong, and Y.-J. Kim, Phys. Rev. B 84, 125135 (2011).
- (42) C. Chantler, J. Phys. Chem. Ref. Data 24, 71 (1995).