∎
Nanhai Ave 3688, Shenzhen, 518060, P. R. China
Tel.: +86-0755-26538886
44email: tanzhxin@szu.edu.cn
44email: lixuejin@szu.edu.cn
55institutetext: Zhixin Tan 66institutetext: Xuejin Li 77institutetext: Yuzhi Chen 88institutetext: Shenzhen Engineering Laboratory for Optical Fiber Sensors and Networks, Shenzhen, 518060, P. R. China
99institutetext: Xuejin Li 1010institutetext: Yuzhi Chen 1111institutetext: College of Electronic Science and Technology, Shenzhen University, Shenzhen, 518060, P. R. China
1212institutetext: Zhixin Tan 1313institutetext: Ping Fan 1414institutetext: College of Physics Science and Technology, Shenzhen University, Shenzhen, 518060, P. R. China
1414email: fanping@szu.edu.cn
Improving the sensitivity of fiber optical surface plasmon resonance sensor by filling liquid in a hollow core photonic crystal fiber
Abstract
Inspired by the classic theory, we suggest that the performance of a D-shape fiber optical surface plasmon resonance (SPR) sensor can be improved by lowing down and tilting the fiber core mode. To demonstrate this, we propose a novel fiber SPR sensor based on a hollow core photonic crystal fiber with liquid mixture filled in the core. The fiber sensor design involves a side-polished fiber with gold film deposited on the polished plane and liquid filling. Our numerical simulation suggests that by tuning the ratio of components in the liquid mixture, the maximum predicted sensitivity of our model for an aqueous analyte (=1.33 ) will be over 6450 nm/RIU, which is competitive with fiber chemical sensing. This design optimization method may lead the way to an ultra-high sensitivity fiber optical biosensor.
Keywords:
Surface plasmons Fiber optics sensors Photonic crystal fiberspacs:
73.20.Mf 42.81.Pa1 Introduction
Fiber optical SPR sensors have attracted much interest in recent years for their compactness and in situ sensing capability Yanase2010Developmentopticalfiber ; Srivastava2012HighlySensitivePlasmonic ; Slavik2002miniaturefiberoptic ; Delport2012Realtimemonitoring ; Verma2013FiberopticSPR ; Kanso2008SensitivityOpticalFiber . This fiber sensor relies on a plasmonic wave, stimulated by the evanescent field leaked from the fiber core, to sense biochemical interactions. There are several ways to leak an evanescent field for chemical sensing. One popular design involves integrating the sensing surface on the inner walls of holes in the fiber Hassani2007Designcriteriamicrostructured ; Hassani2006Designmicrostructuredoptical . These gold film coating holes are located near the fiber core, which facilitates a direct excitation of plasmonic waves. This closed-form all-in-one design reduces the consumption of sample volume and has high sensitivity Popescu2012Powerabsorptionefficiency ; Shuai2012multicoreholey . However, the fabrication of such a sensor is challenging, especially the metal film deposition inside the holes. Moreover, with this sensor the experimentalist lacks an auxiliary method to check the metal film and the self-assembled bio-molecular film. Another approach to leak an evanescent field is using post-processing, for example, by drawing or side-polishing the fiber. A fiber with a diameter on the order of the wavelength of visible light is ready to leak an evanescent field Monzon-Hernandez2004OpticalFiberSurface ; Tong2006Photonicnanowiresdirectly ; however, this drawing process will produce a highly fragile fiber sensor which limit their application. A robust fiber sensor can be fabricated by side-polishing an finished fiber Chen2011Sidepolishedfiber ; Lo2011Ultrahighsensitivitypolarimetric ; Tian2012AllsolidD . This method has the advantage of simplicity, as well as allowing good control over metal film deposition. The planarity of the sensor region allows the direct adoption of techniques from existing prism SPR technology. In Ref. Tian2012AllsolidD the authors propose a side polished fiber optic SPR sensor based on all-solid photonic crystal fiber. Since the mechanical characteristics of the core and the cladding layer are identical, the fabrication is simplified. The major problem with this side-polishing sensor is that the sensitivity is limited in comparison with the closed-form design. This problem should be addressed with theoretical guidance. After studying the SPR theory, we suggest that decreasing and tilting the fiber core mode index is one way to improve the sensor performance.
In this paper, we propose a novel SPR sensor based on a side-polished hollow core photonic crystal fiber. The design involves precise polishing of the base fiber to form a uniform planar surface, upon which is deposited a gold film; in addition, the hole along the center of the fiber is filled with a liquid Xuejin2009AnalysisTemperatureSensing ; Yu2010Somefeaturesphotonic , the composition of which can be chosen to tune the core refractive index. The propagating light will be confined in the fiber core, mainly in the liquid-filled region. By changing the ratio of liquid mixture, we tuning the refractive index of the fiber liquid core. The numerical model will uncover how the filling liquid affects the coupling of the core mode and the plasmonic mode and moves the phase matching point, which is the fundamental to improve the sensor performance, as characterized by its sensitivity.
This article is organized as follows. In section 2, we discuss the model design and numerical methods. A specific application of the model to the case of a fiber SPR sensor is illustrated in section 3. In section 4 we assess a serial fiber optical SPR sensor with various choices for the central liquid filling, and discuss the relationship between the core index and the sensitivity. Then a summary in section 5 will end the paper.
2 Model and sensor design
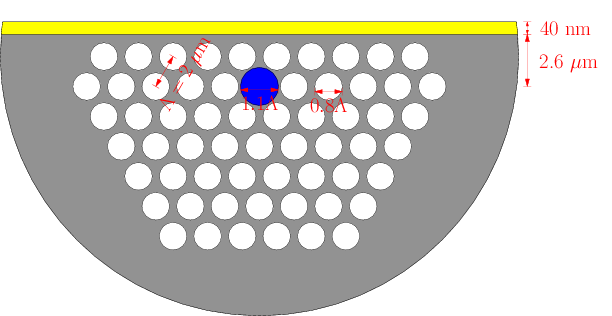
A schematic of the fiber optical SPR sensor design is shown in Fig. 1. The base fiber is a five-layer air-hole photonic crystal fiber with a large hole in the center. The pitch of the hexagonal lattice is . The diameter of the air holes in the cladding layer is , and that of the larger central hole is . The dimension of the central core will influence the light confinement.To fabricate a sensor, the fiber should be carefully polished so as not to impinge on the underlying layer of holes and to ensure a smooth, planar surface. This post-processing may be accomplished by laser micro-fabrication. The height of the polished plane above the fiber center is fixed at , and the plane is coated with a gold film 40 nm thick.
In the model, the refractive indices of silica and air are set as 1.45 and 1.0 respectively. The complex relative permittivity of gold is treated using the Drude model [5]. The refractive index of the liquid filling the central hole is variable. A convenient choice for the filling liquid is a mix of purified water and glycerin; varying the ratio of these two components allows the refractive index of the mixture to be tuned within the range 1.33 to 1.47. The dispersion of the liquid mixture is ignored now and will be discussed later. The analyte is located on the polished plane and has a refractive index of 1.33, corresponding to an aqueous environment. Symbol represents the refractive index of analyte, which is also the environmental refractive index (RI) to be sensed.
A full vectorial FEM is used to solve the electromagnetic mode of the fiber sensor Pomplun2007Finiteelementsimulation . The solution in mode analysis is the electromagnetic field propagating in the out-of-plane direction:
| (1) |
The parameter is a complex number defined as , where represents damping along the z-axis and is the propagation constant. The effective mode refractive index is defined as , where is the wave vector of the light in vacuum. The attenuation per meter in dB is correlated to the imaginary part of according to
| (2) |
Here ‘e’ is the base of the natural logarithm, means the loss of the core mode which is measurable to quantify the performance of the fiber sensor.
3 Fiber optical SPR sensor with filling liquid of RI=1.39
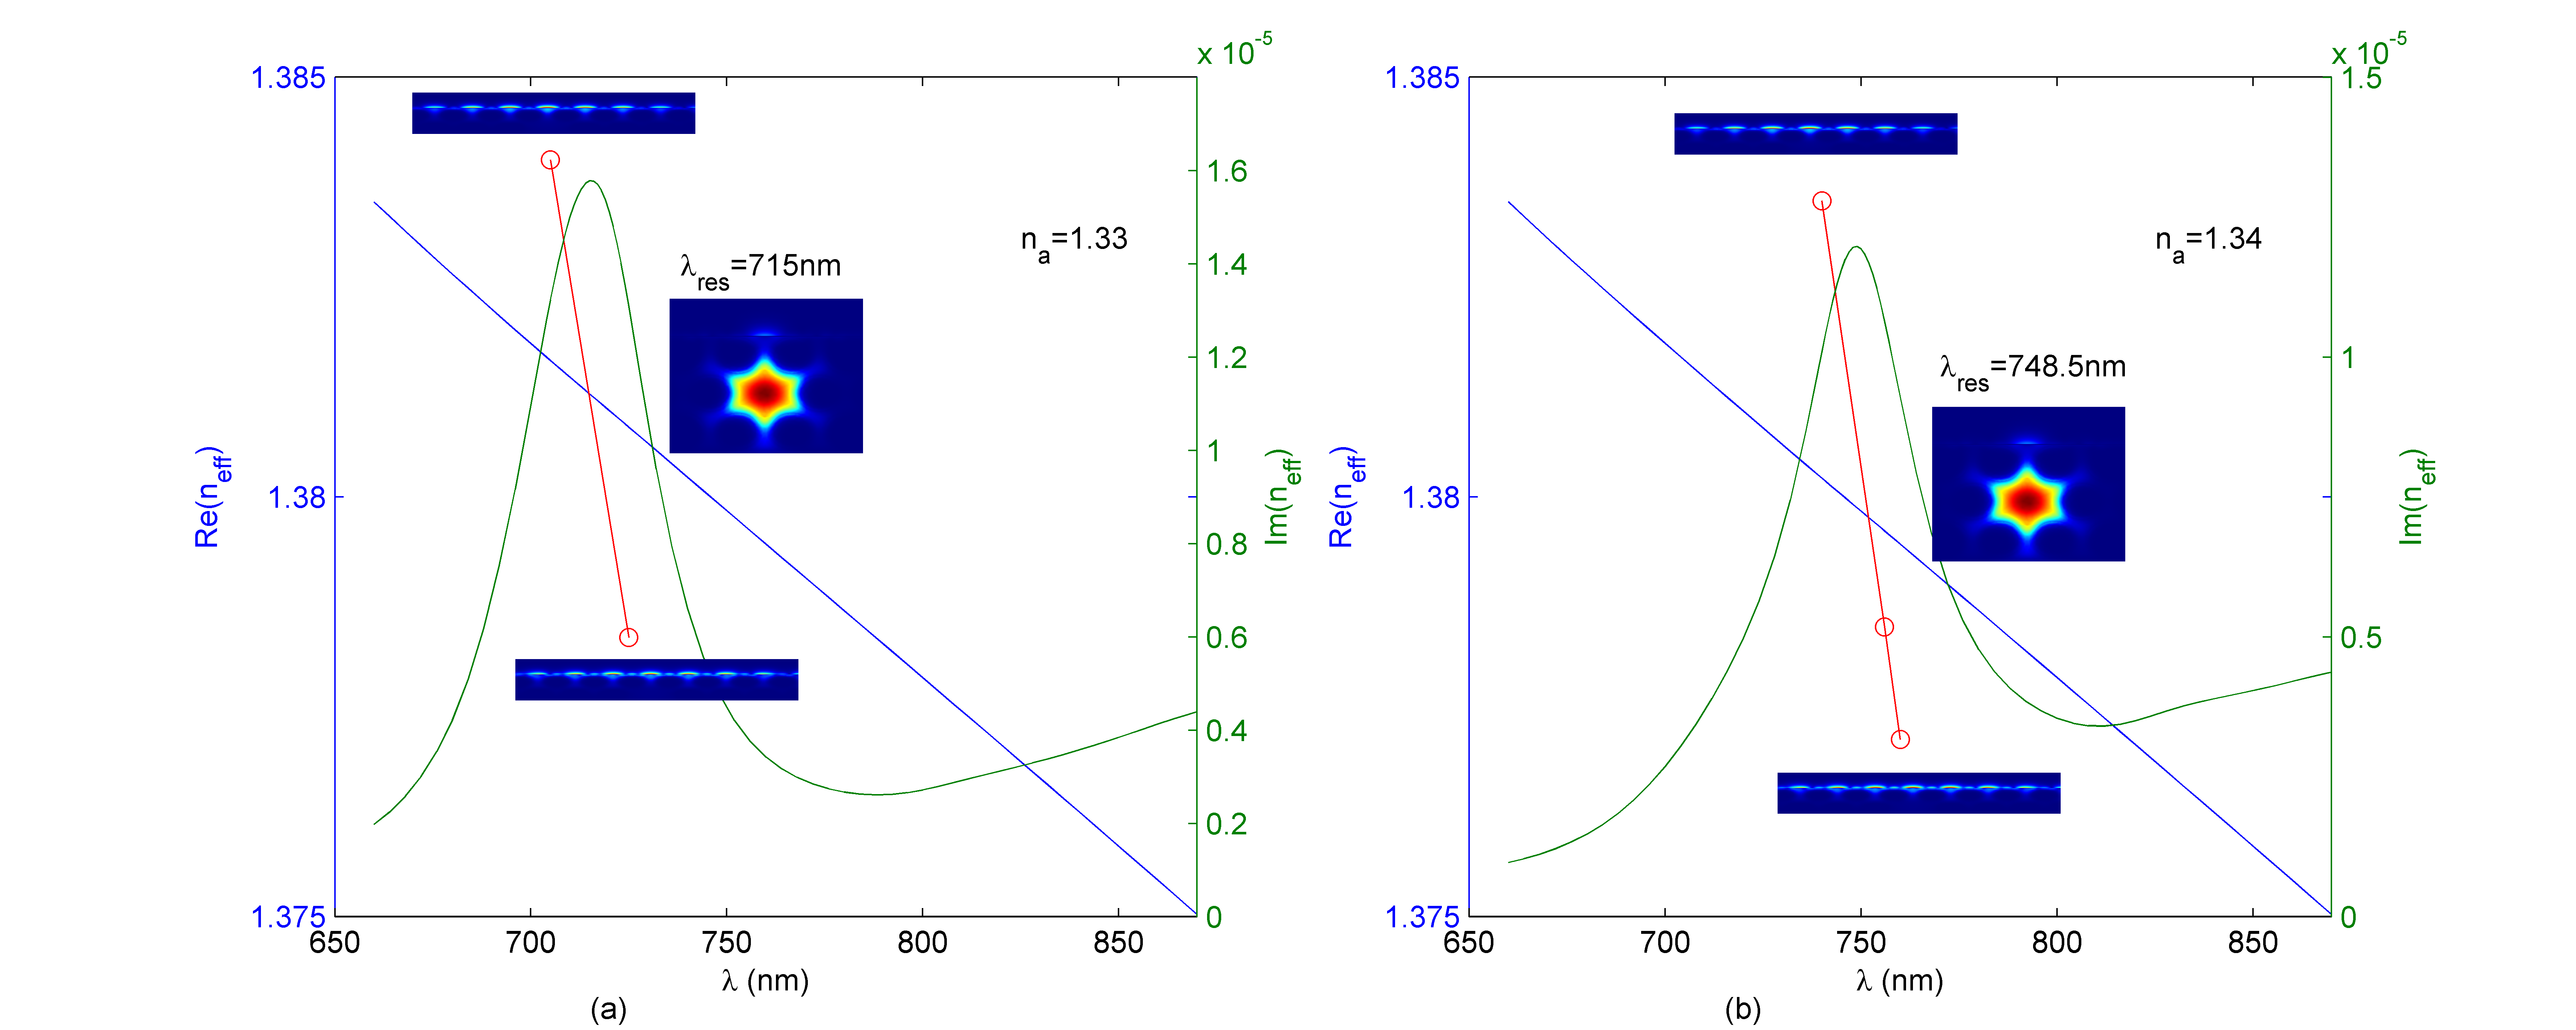
We simulated plasmonic wave stimulation on the sensor surface with the fiber sensor operating in the lp01 mode. In this section we focus on the case of a filling liquid refractive index of 1.39. Fig. 2 depicts the stimulation of a plasmonic wave on the metal surface with environmental refractive index = 1.33 (left) and 1.34 (right). In each sub-figure, the blue line is the real part of the effective refractive index () of the core guide mode as a function of the input wavelength, the green line is the imaginary part of , and the red line is the effective refractive index of the surface plasmon wave. The resonance is characterized by the imaginary part of with a peak at the crossing point of the plasmonic mode (the red line) and the guide mode (the blue line). The upper and lower insets are the electric field distribution of the plasmonic mode at the corresponding red point. The central insets show the spatial distribution of the field in the fiber sensor near the resonance wavelength. In the central insets, plasmonic waves are stimulated and propagate along the surface above the fiber center.
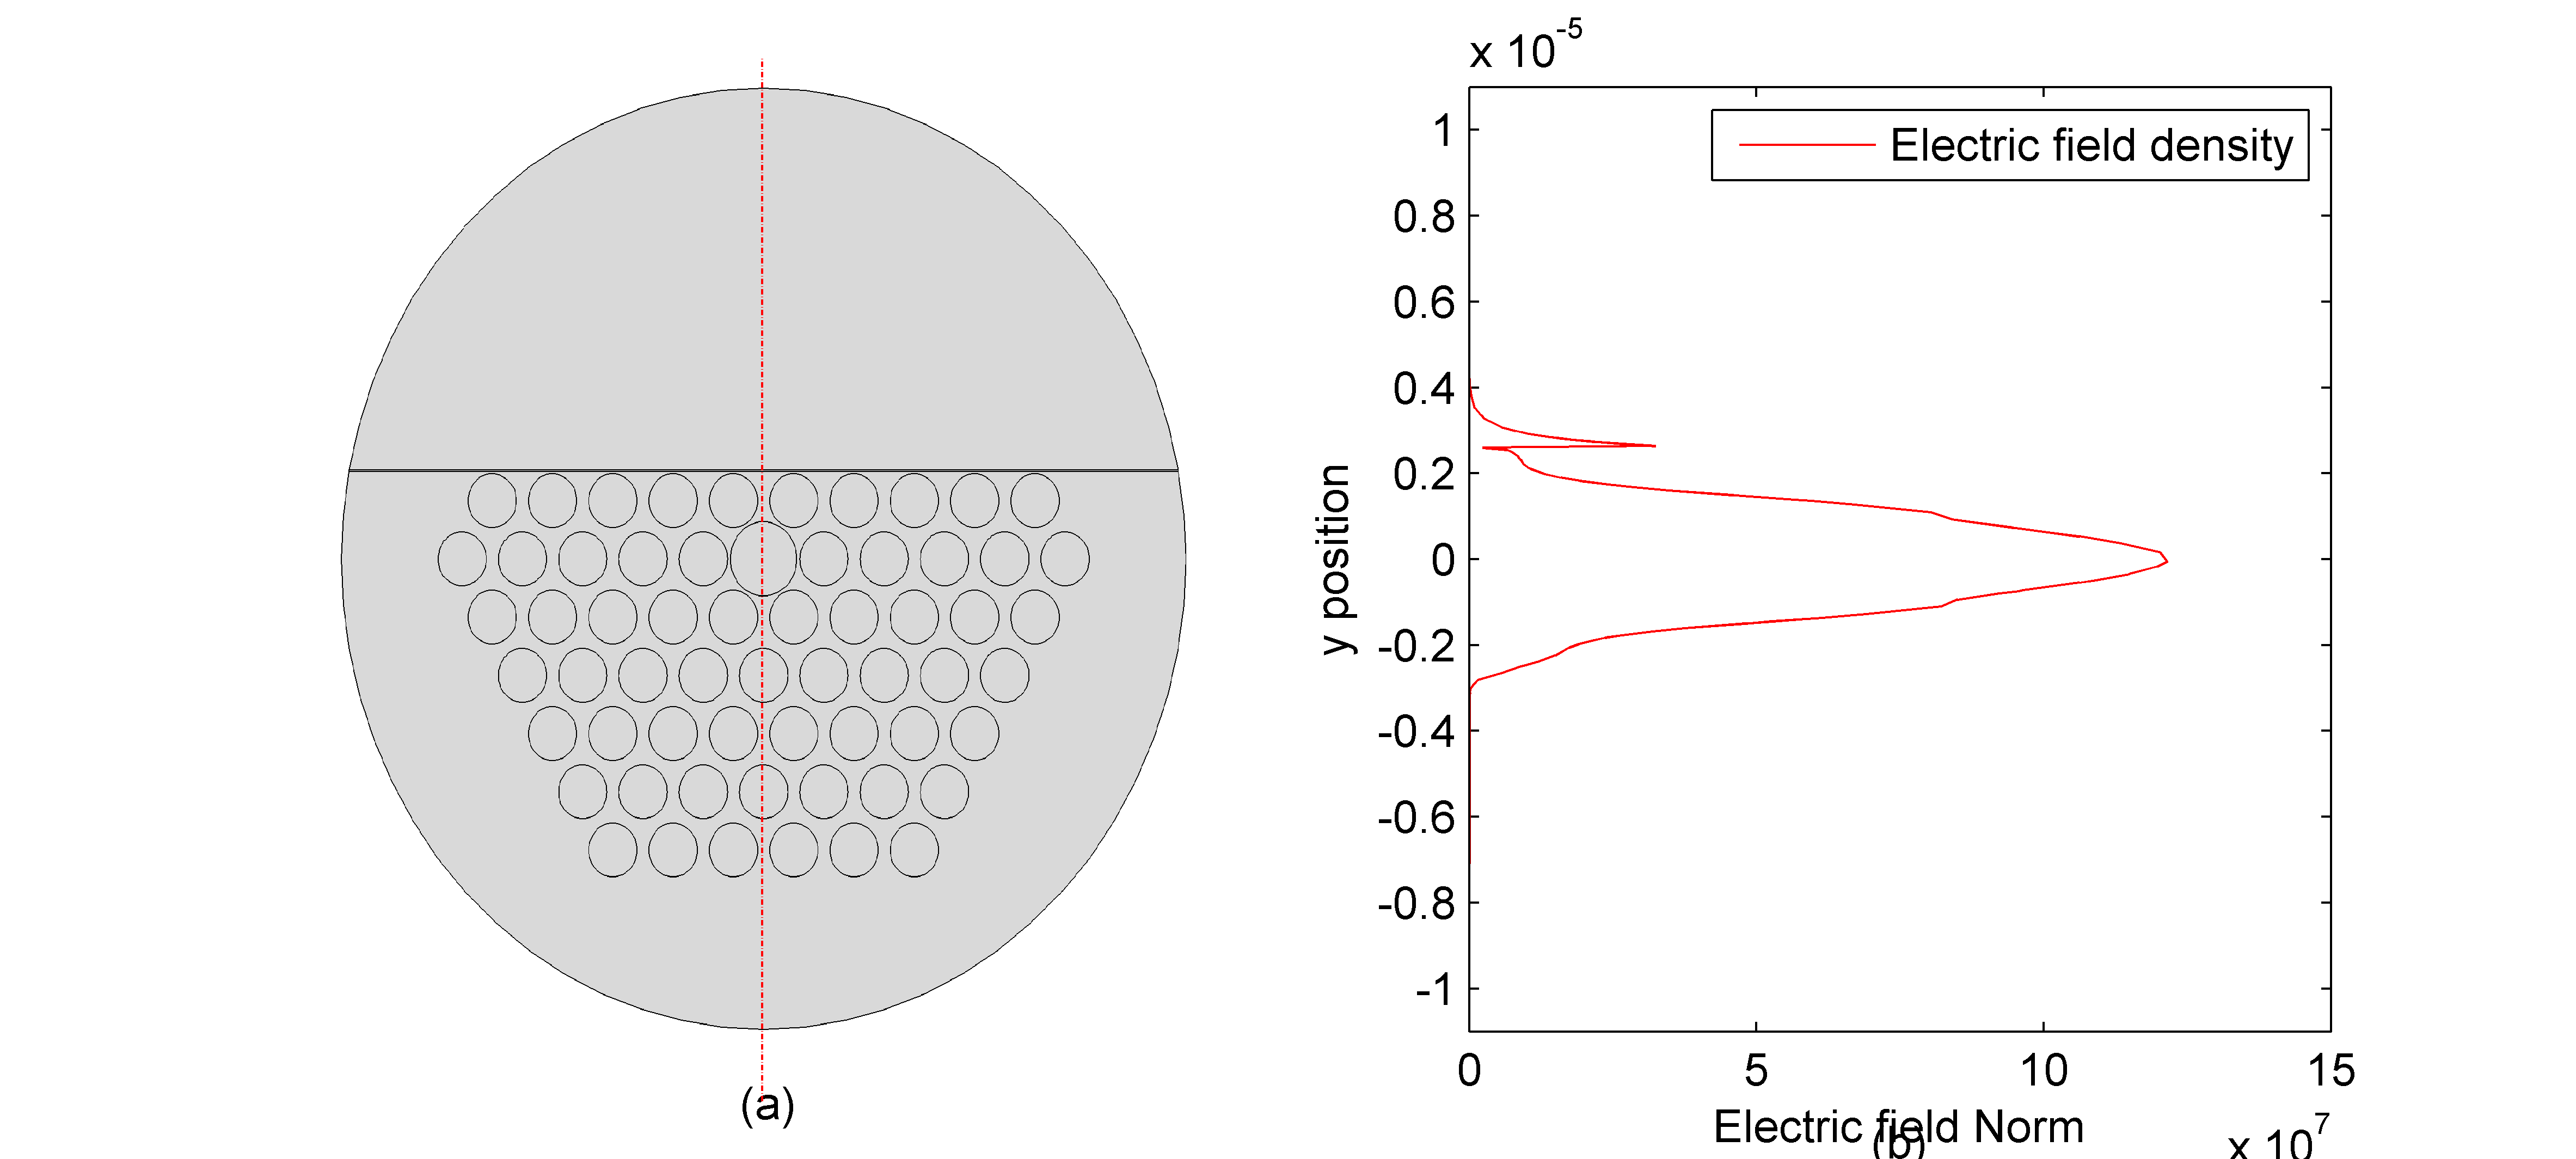
To study the resonance in detail, we investigate the electric field distribution when the environmental refractive index equals 1.33. Since only the component of the electric field normal to the metal surface can stimulate the plasmonic wave, in Fig. 3 we plot the variation of the electric field magnitude at the resonance wavelength with position along the vertical (y) axis. Close to the center, the electric field density decreases roughly symmetrically with radial distance. However, at y = 2.6 , corresponding to the plane of the metal surface, a sharp peak in the electric field is apparent. This is the result of surface plasmon resonance, for which the electric field is significantly enhanced by the plasmonic wave at the metal surface. As expected, the field decreases exponentially with distance above the surface.
The sensitivity of the fiber optical SPR sensor is evaluated by wavelength interrogation. The sensor relies on shifts in the resonance wavelength induced by changes in the refractive index at the fiber surface, which may arise from mass variations on the surface associated with biological interactions. The sensitivity of a fiber optical SPR sensor is thus defined as the ratio of the shift of the resonance wavelength to the change of the environmental refractive index:
| (3) |
Where is the shift of the resonance peak position in nm, and is the change of the environmental refractive index. To estimate the sensitivity near = 1.33, the loss spectra for = 1.33, 1.331 (=0.001) and 1.34 ( = 0.01) are shown in Fig. 4.
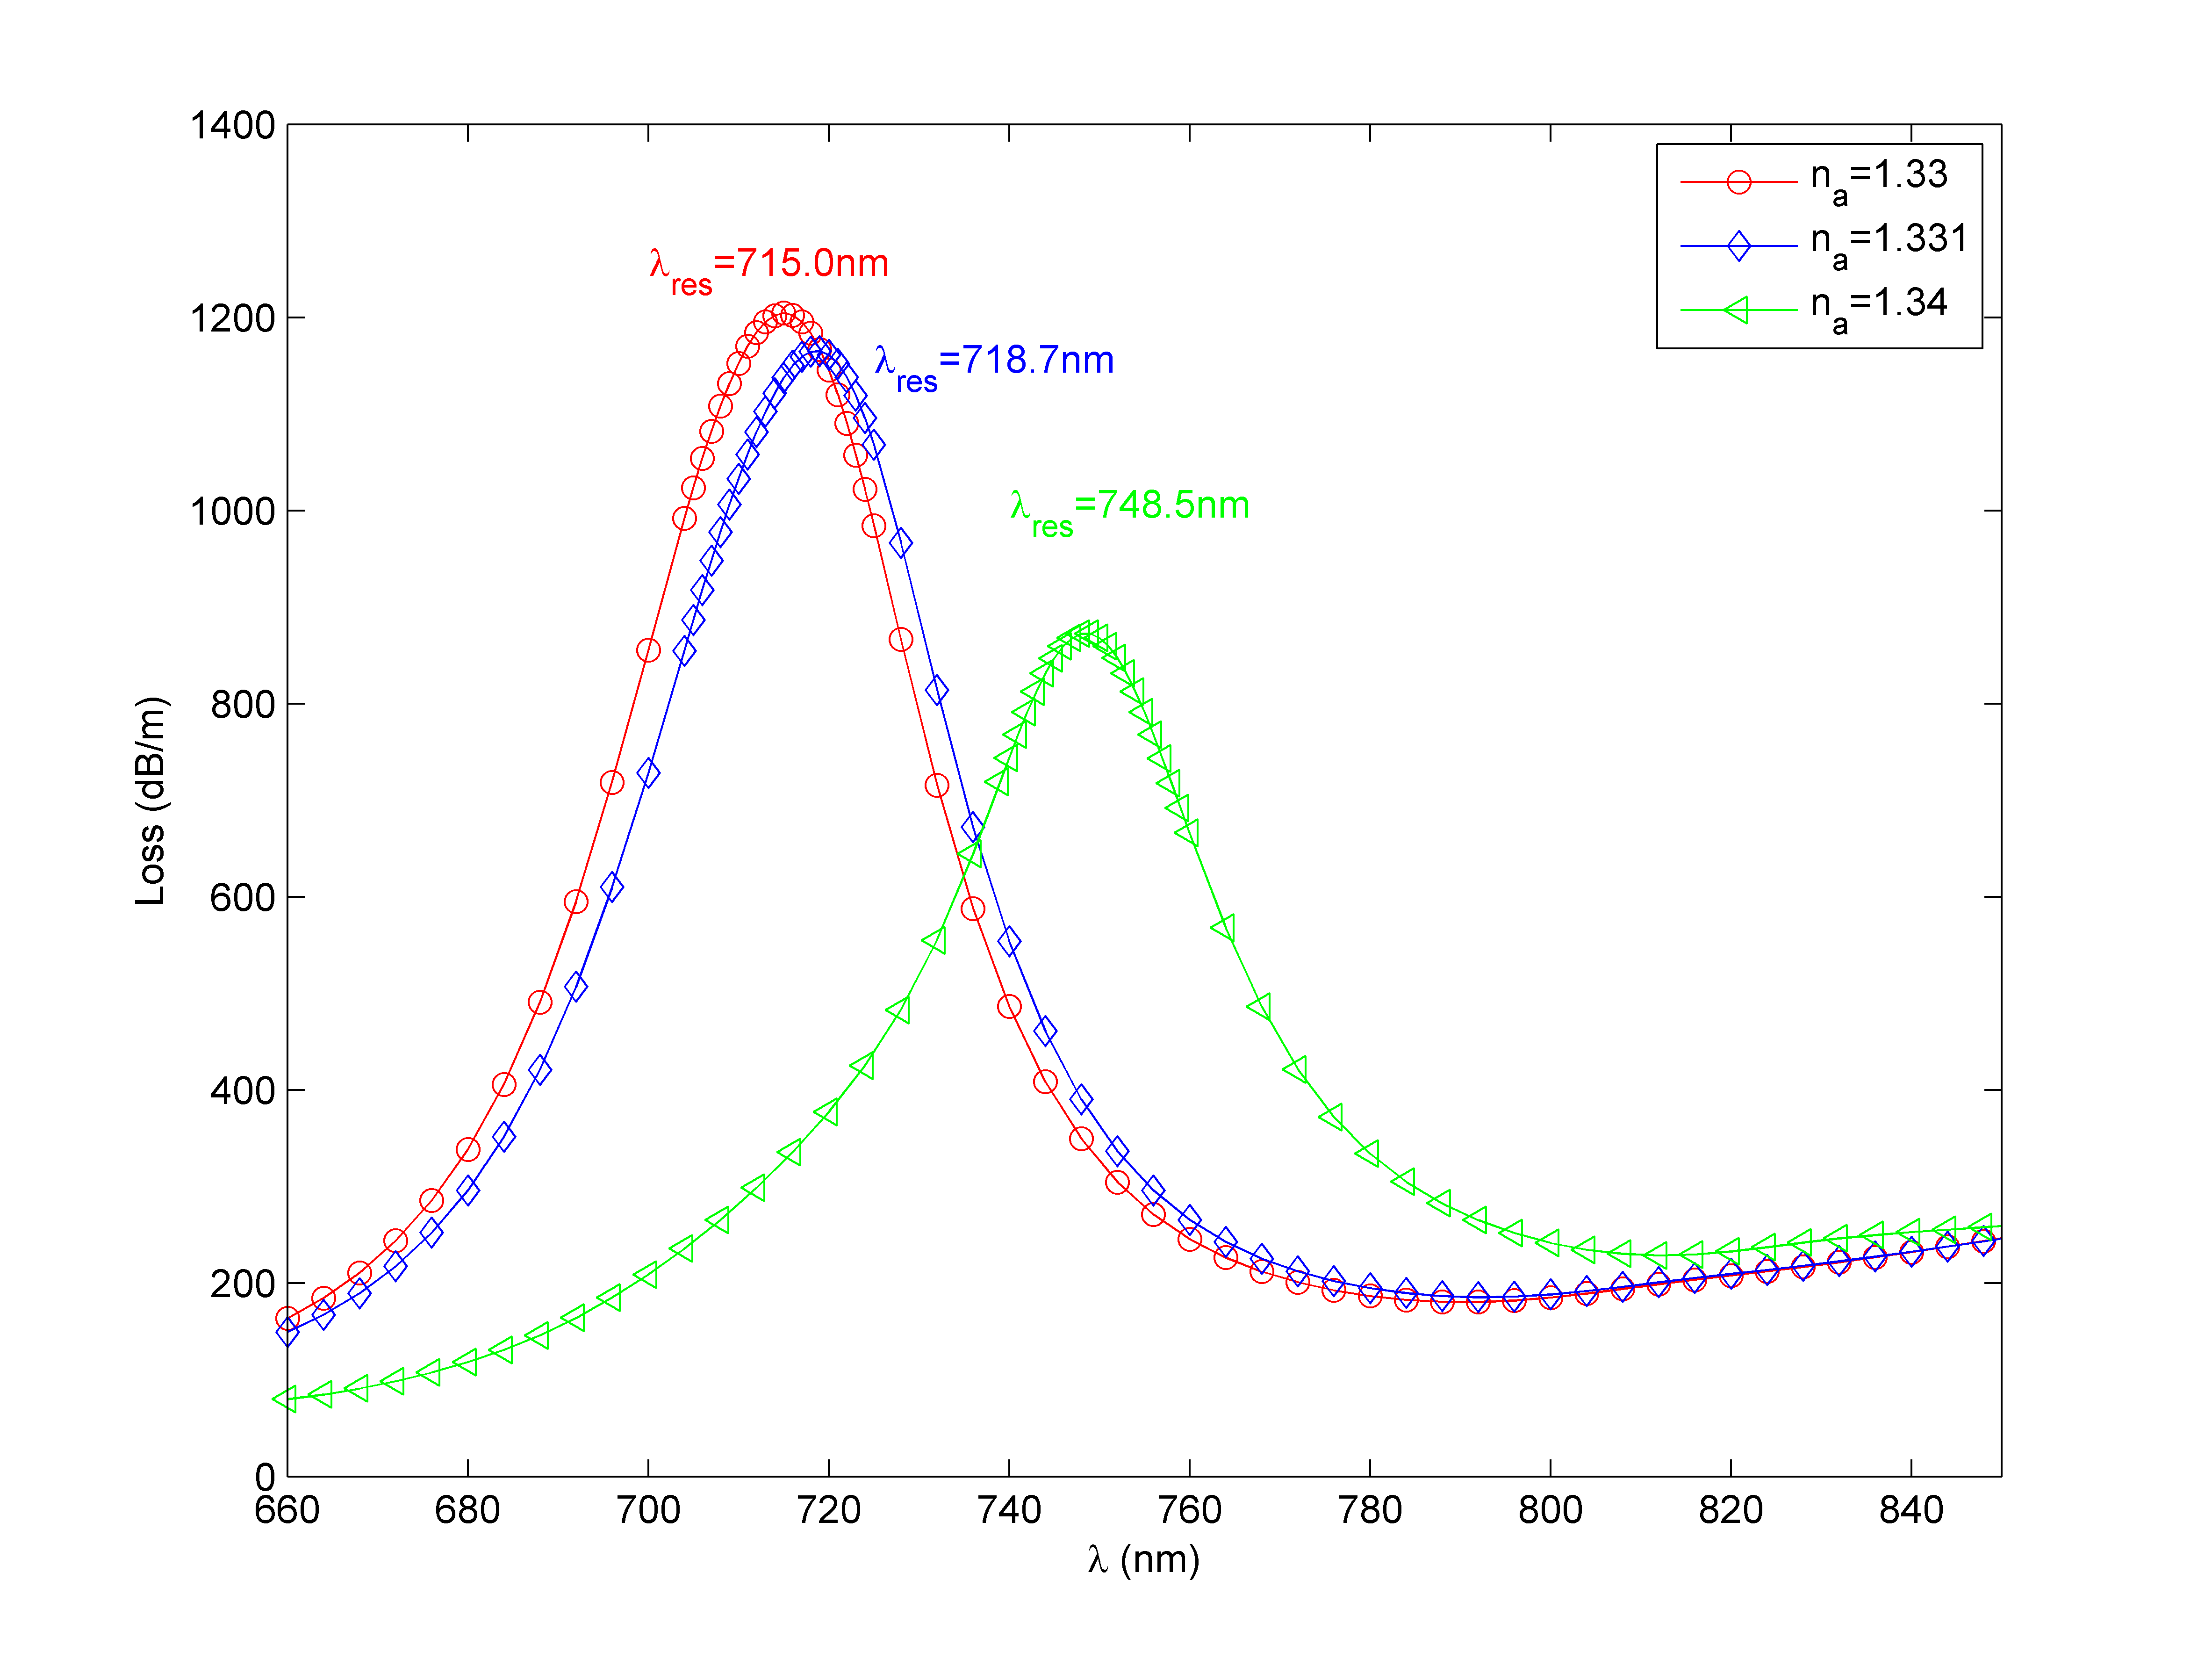
When = 0.01 (0.001), the estimated sensitivity is about 3350 (3700) nm/RIU. The precision of these values is limited by the resonant wavelength measurement, the resolution of which is interpolated to get nm. This numerical result is already much higher than previously reported values for similar models [8]. Moreover, we demonstrate below that sensitivity much higher than this value can be obtained by optimizing the choice of filling liquid.
From Eq. 2, the resonance wavelength in loss spectra is the same value as the peak position of the loss curve under wavelength interrogation. Therefore, we can skip the loss calculation and just focus on the coupling chart where the resonance wavelength can be read from the crossing point of the plasmonic mode and the core mode. Later, we will evaluate the sensitivity in this way based on the pair of environmental index values .
4 Investigation of varying the refractive index of the fiber SPR sensor filling liquid
To verify our hypothesis that the performance of a fiber SPR sensor is directly affected by the core mode and to optimize the choice of filling liquid, we present numerical modeling results in Fig. 5 for different values of the filling liquid refractive index: 1.46, 1.44, 1.42, 1.40, and 1.38.
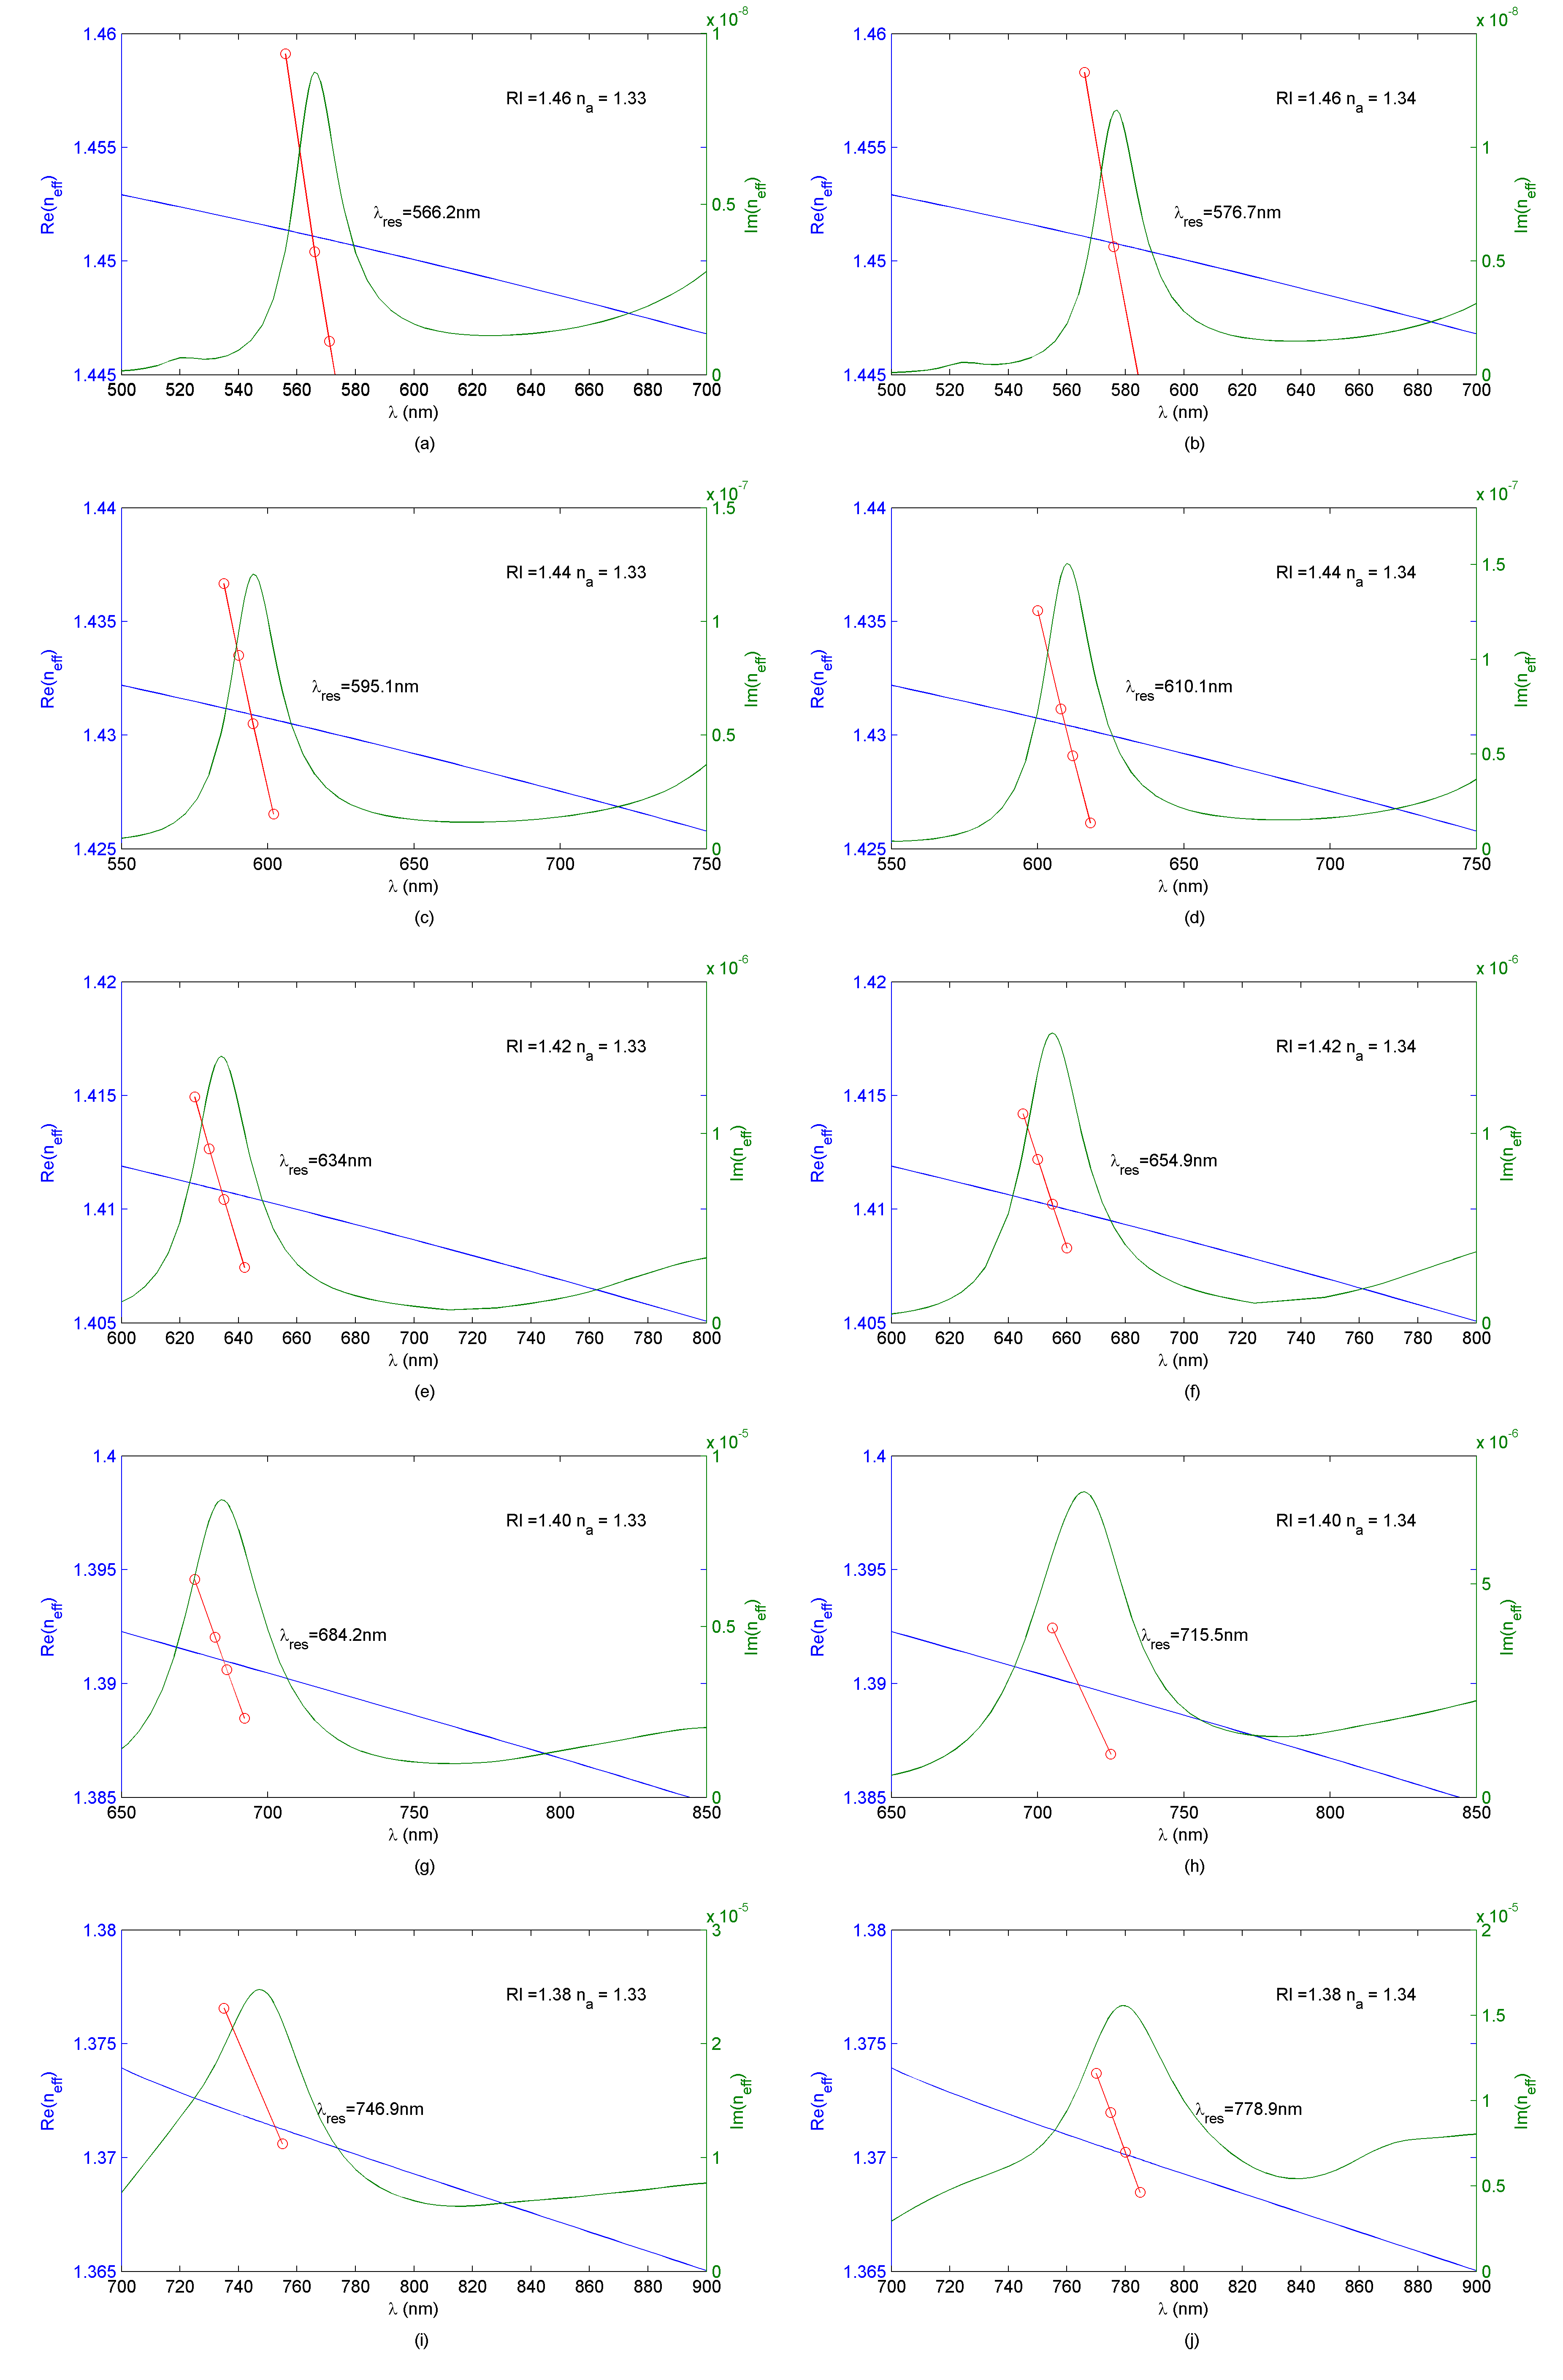
The effective refractive index of the guide mode is seen to vary with the refractive index of the filling liquid correspondingly. This mode index denotes the index of the average environment perceived by the propagating electromagnetic field. Obviously, the mode index will be influenced by the choice of filling liquid. Consequently, the phase matching point is moved. The resonance occurs at the crossing points of the plasmonic modes and the core modes, and the resonance wavelengths are labeled in Fig. 5.
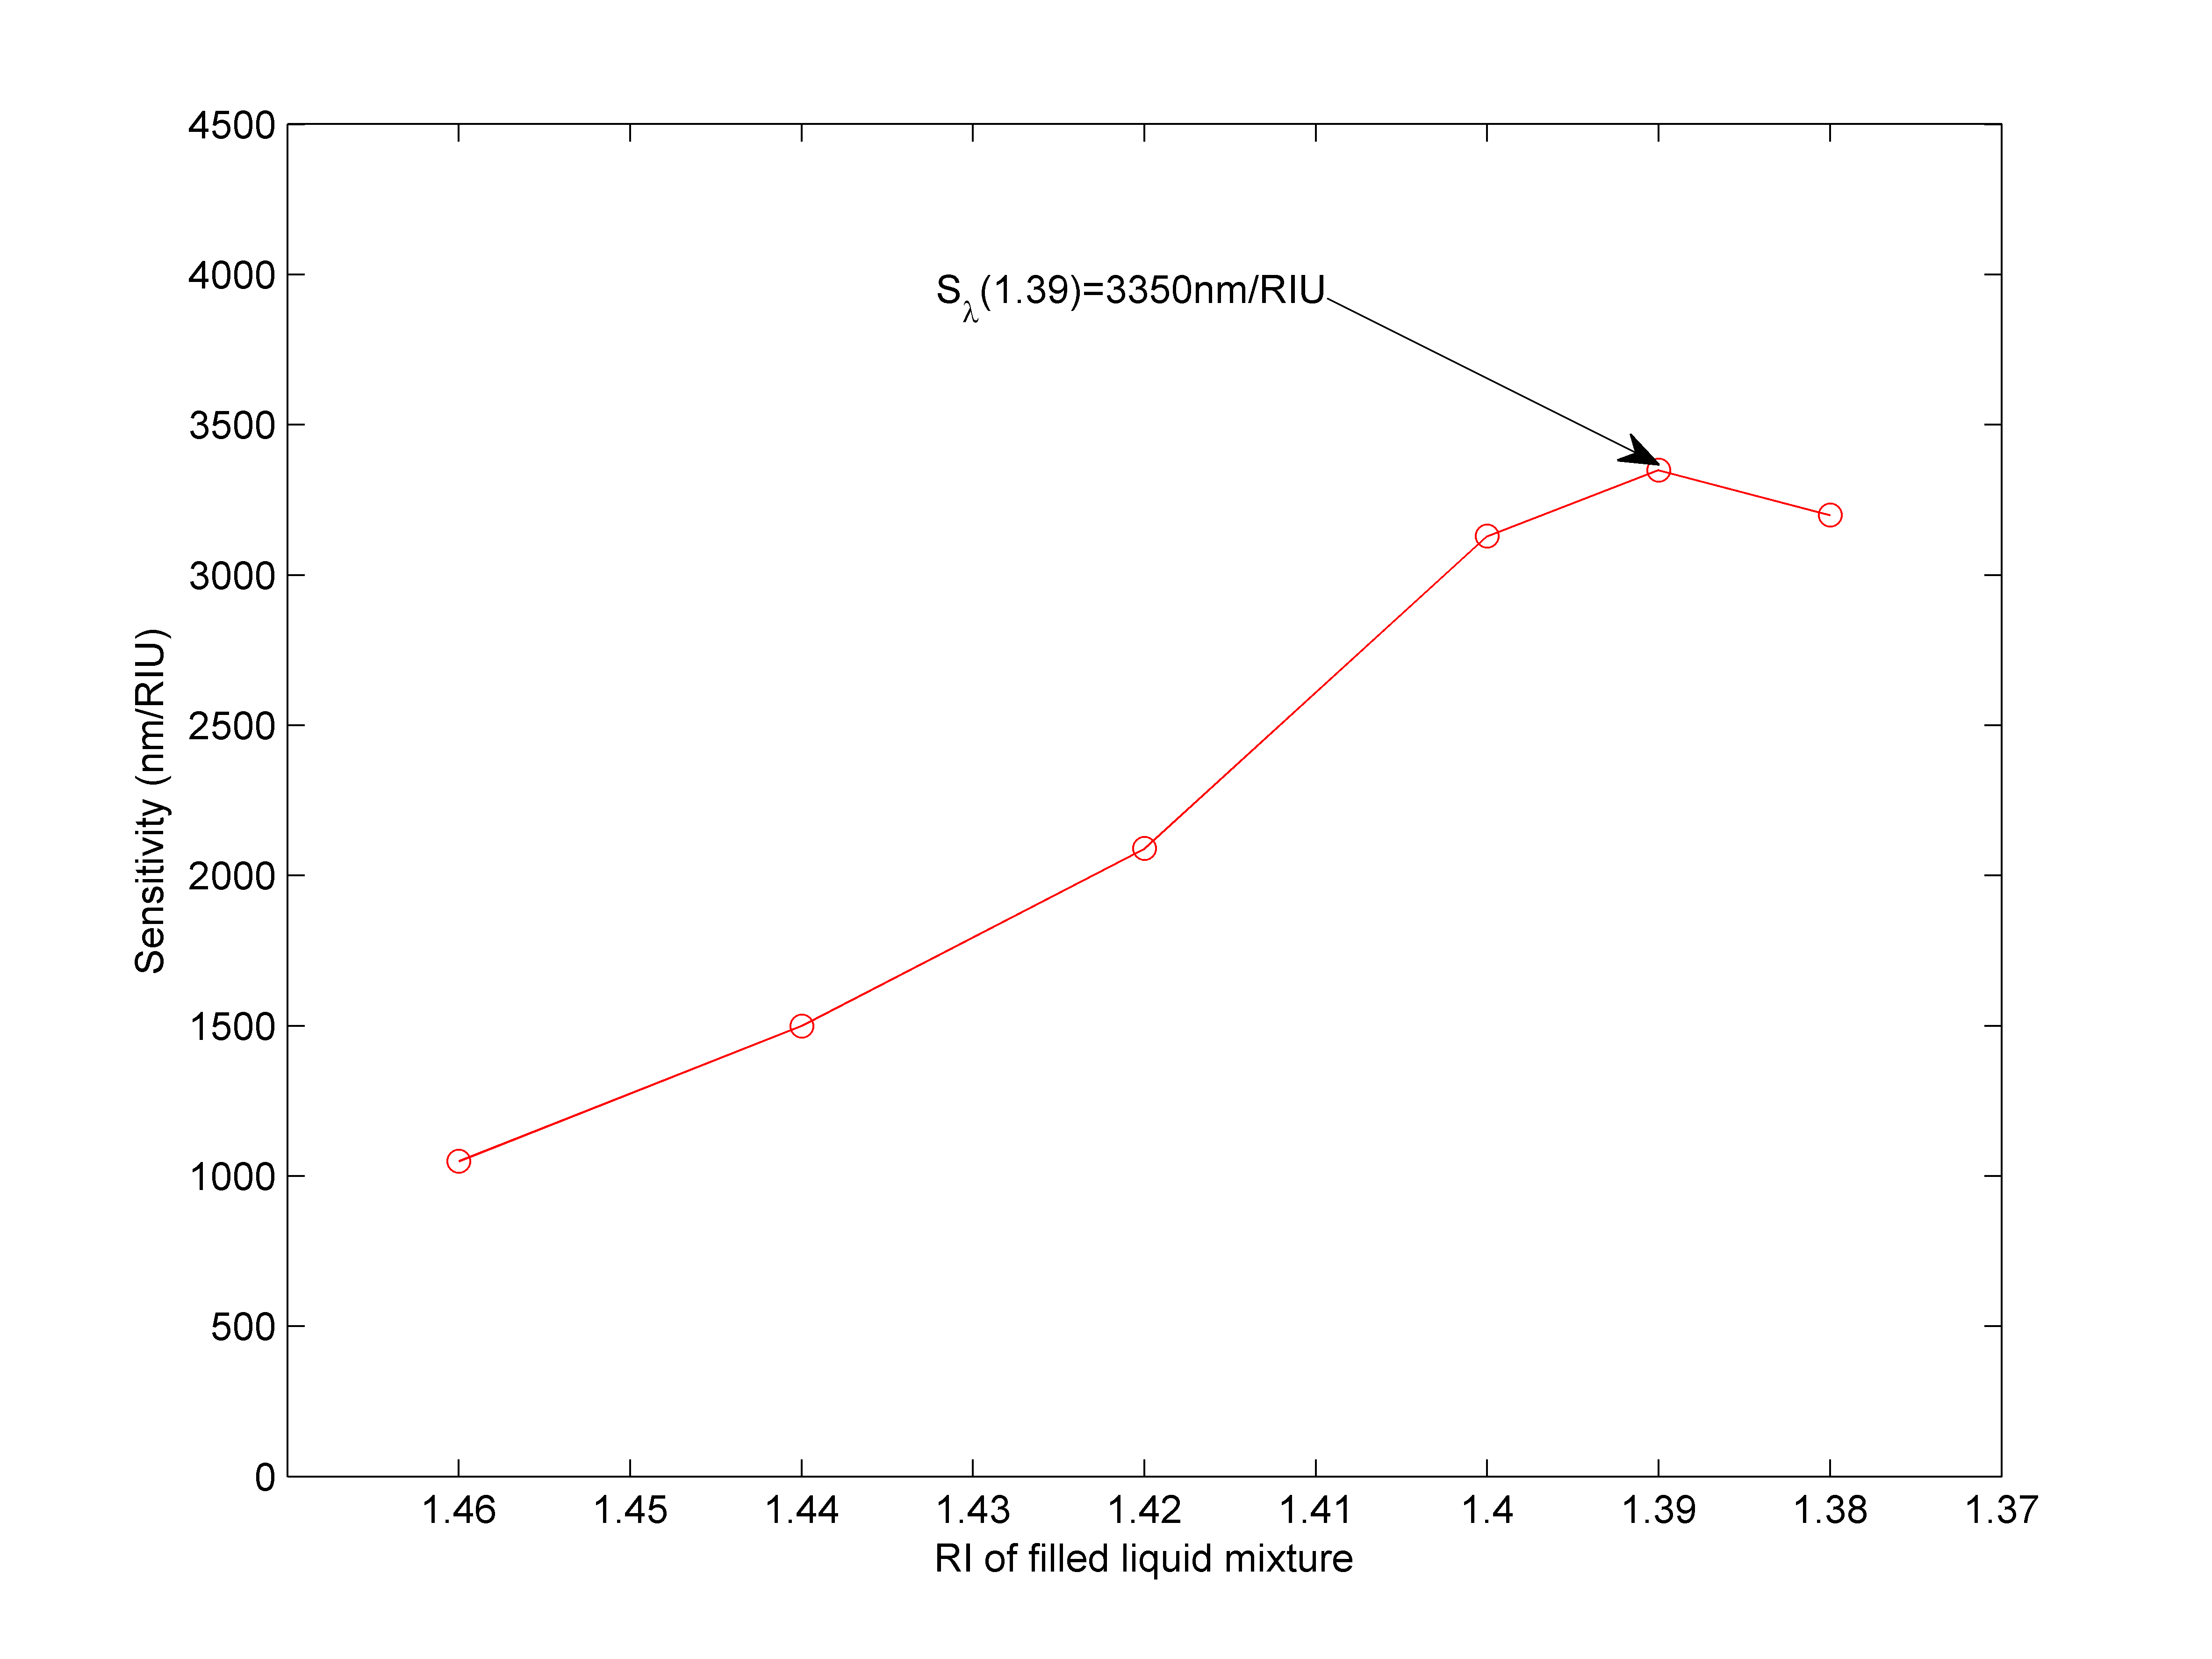
According to Eq. 3, the sensitivities of the fiber optical SPR sensors with different filling liquids were evaluated by comparing the resonance wavelengths for two different environmental refractive indices (1.33 and 1.34). Fig. 6 plots the sensitivity as a function of the liquid refractive index. As the liquid refractive index decreases (x-axis), the sensitivity of the fiber SPR sensor increases, reaching a maximum when the filled liquid RI = 1.39.
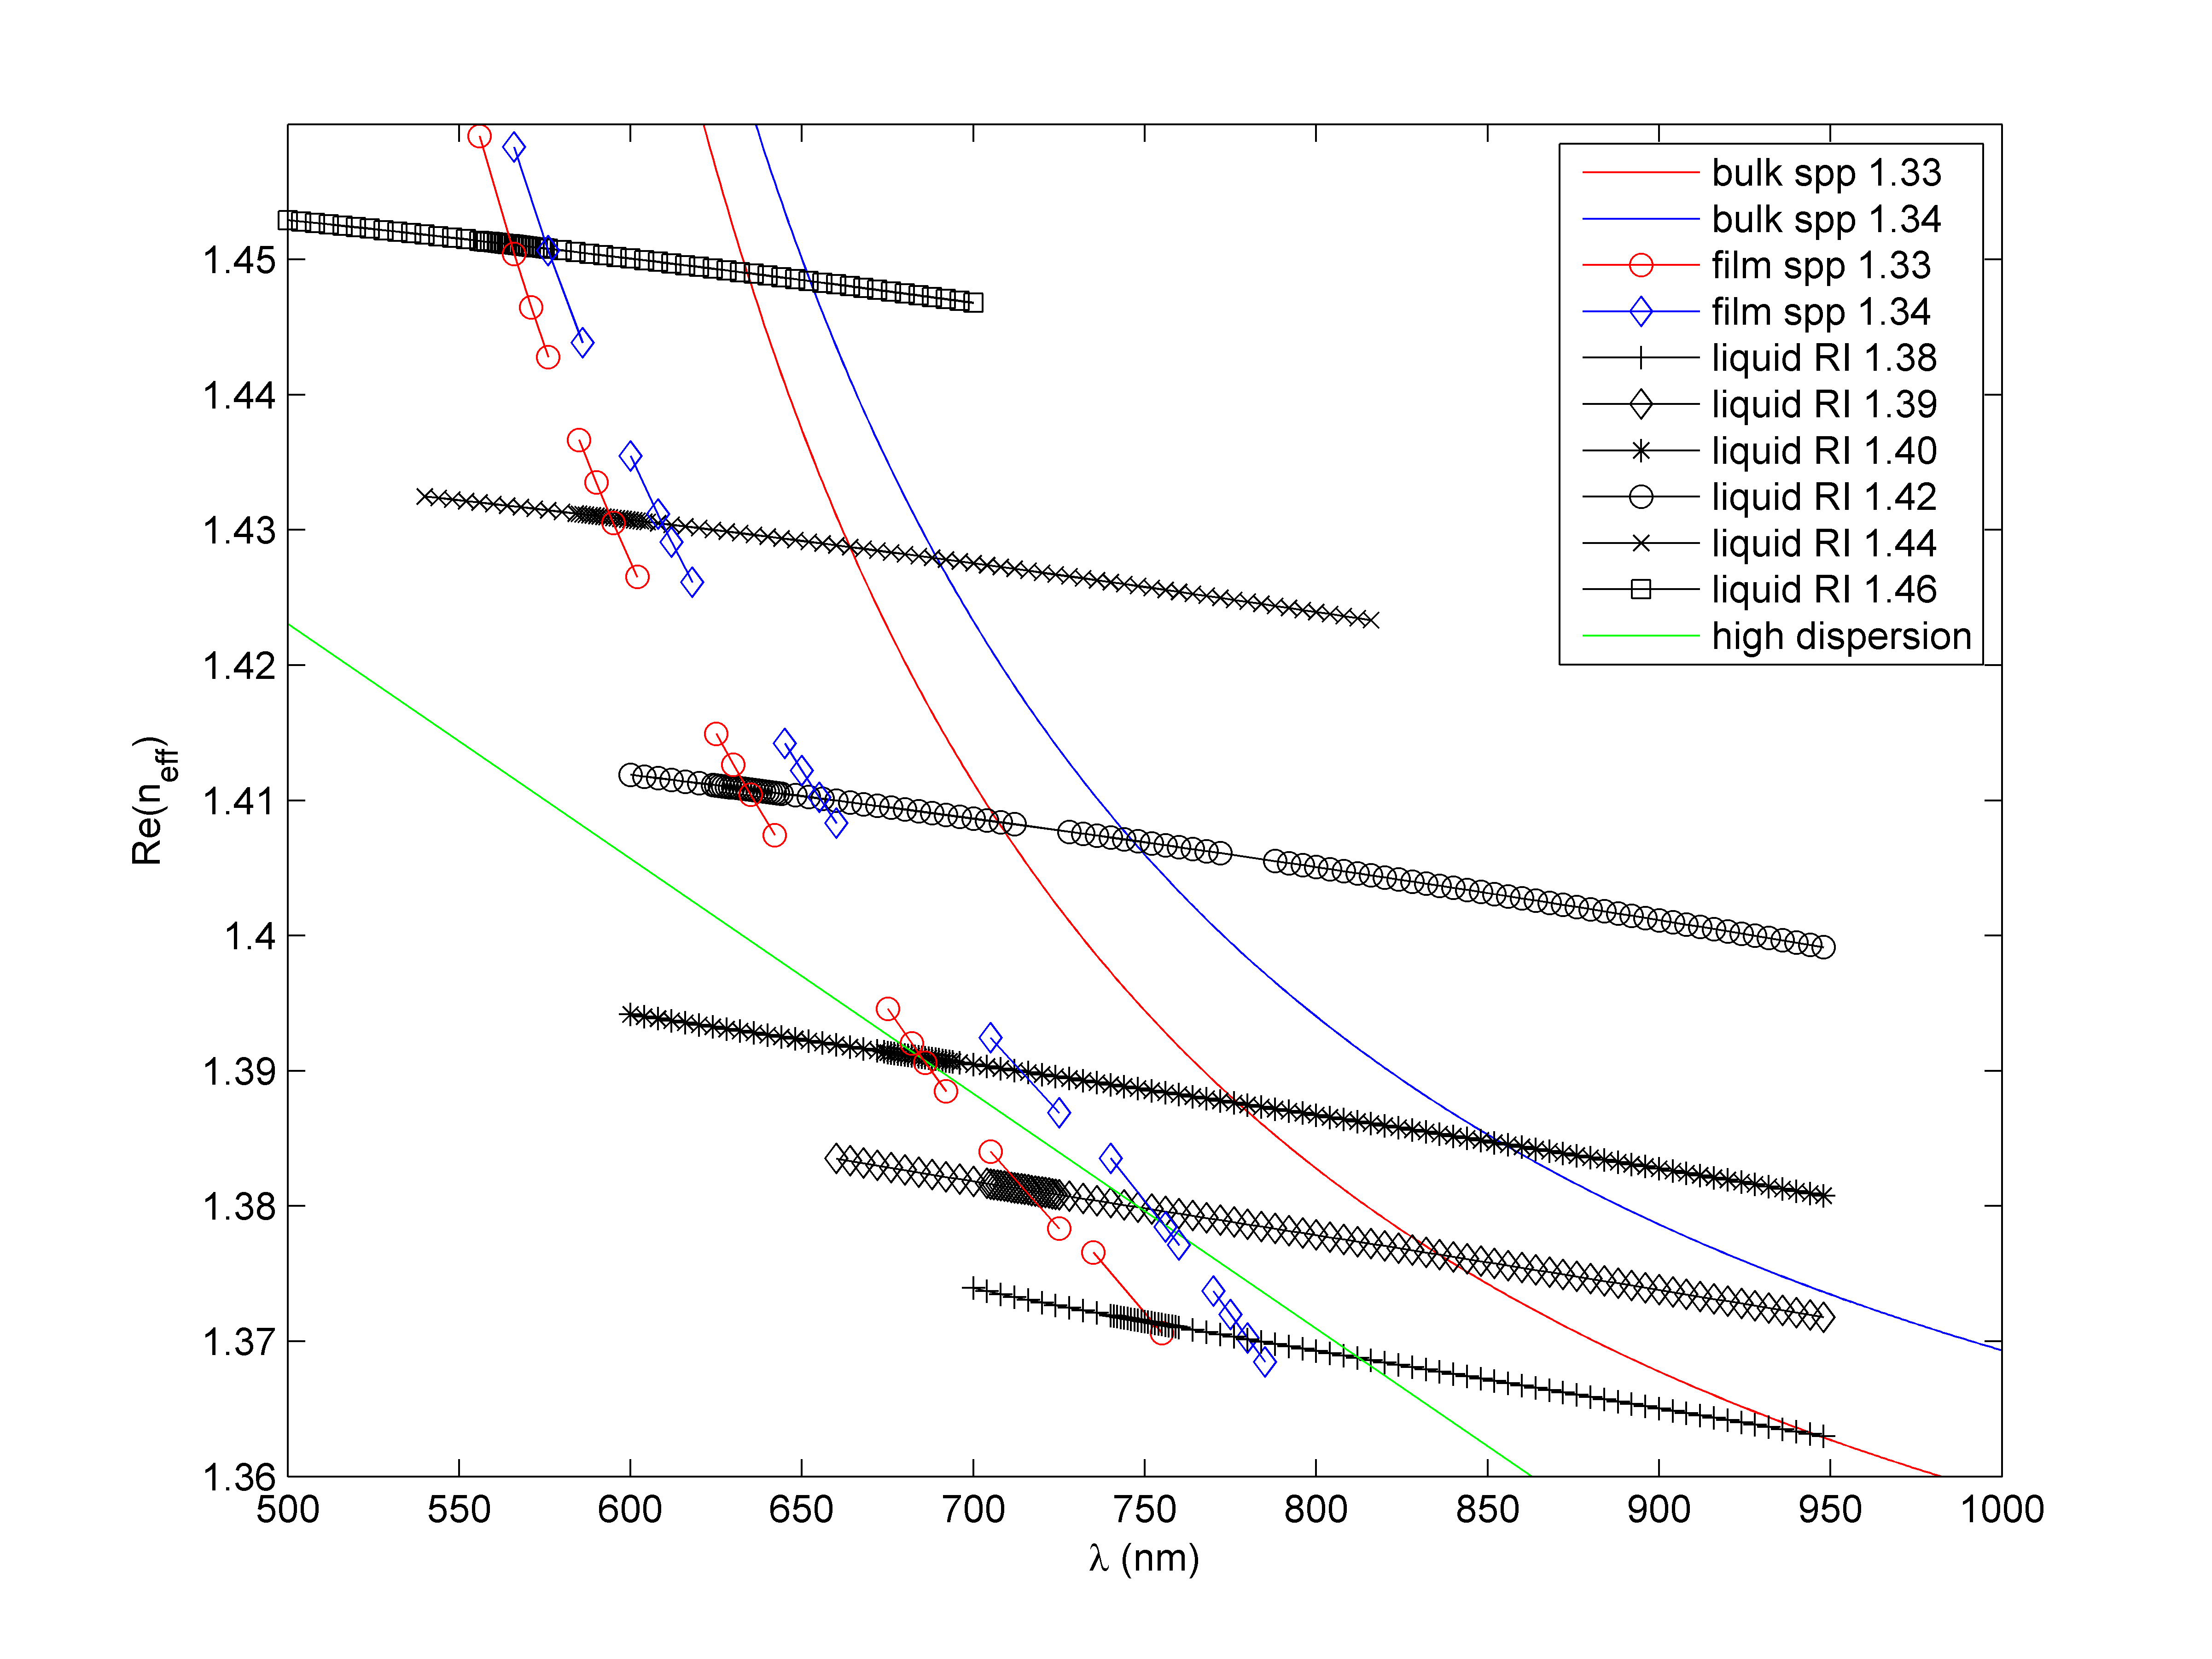
To clarify the relation of the mode index and the sensitivity, in Fig. 7 we combine all the previous results in a sigle simultaneous view. The black lines with symbols are the core mode for various choices of the filling liquid refractive index.The solid blue () and red () lines correspond to the real part of the plasmonic mode for a semi-infinite two-plane metal/dielectric model Raether1988Surfaceplasmonssmooth ; Pitarke2007Theorysurfaceplasmons :, in which the wave vector of the plasmonic mode is given by
| (4) |
Where spp refers to “surface plasmon polarition”, is the dielectric constant of gold, and is the dielectric constant of environment, the dispersion of this medium is ignored now. The effective refractive index of the plasmonic mode is given as
| (5) |
While the enviromental refractive index () decrease, the gap between these two curves increases. This indicates that if we maintain the plasmonic mode while suppressing the core mode, we will lower the points at which the plasmonic and core mode curves cross. These crossing points correspond to the resonance wavelengths. The result is that the difference in resonance wavelength between and 1.34 will increase. Accordingly, the sensitivity of the fiber SPR sensor will be improved.
These solid curves are theoretical results for an idealized model, with a different geometry to our sensor design. But the general trend holds for the numerical solution of our fiber optical SPR sensor model. The black lines with different markers in Fig. 7 are the core modes of the fiber optical sensors with different choices of filling liquid, while the red and blue points lines represent the numerical results for the plasmonic modes with environmental refractive index =1.33 (red) and 1.34 (blue). Although these plasmonic mode points are results from different sensor models with different core refractive indices, they fall on a continuous curve. This is because the central hole is some distance from the interface, so the influence of the liquid refractive index on the plasmonic mode is weak. More importantly, the shape of the curve mapped out by the numerically derived points is very similar to the analytical curves, despite a horizontal shift that is due to the different geometries of the analytical and numerical models: in our fiber sensor design the plasmonic wave is stimulated on a gold film, while in the analytical model the metal is a semi-infinite plane. Since it is water and silica on each side of the gold film, the sensor model is asymmetric, which result in no analytical solution Raether1988Surfaceplasmonssmooth ; Pitarke2007Theorysurfaceplasmons ; and our FEM result is the best choice for this asymmetric model.
As described above, the resonance is located at the crossing points of the plasmonic modes and the core modes. The sensitivity of the fiber SPR sensor is evaluated from the gap between these crossing points for the red and blue plasmonic curves. In Fig. 7, the gaps produced by the core mode cross with the plasmonic mode increase gradually as the refractive index of the filling liquid (greater than 1.39) is decreased. These numerical results demonstrate that the performance of the SPR sensor can be improved by lowering the fiber core mode refractive index.
Our method for decreasing the effective refractive index differs from those in earlier reports [4, 5]. In our design, the electric field is confined to the liquid-filled region. That is why we can successfully lower the crossing lines. However, while the RI of the filling liquid decreases, the electric field confinement will be worse, because part of the electromagnetic field will penetrate the high-refractive-index silica wall; the FHWM of the resonance peak also grows (see Fig. 5). This may be why the curves of the plasmonic modes are distorted and the sensitivity decreases for the case RI=1.38.
Furthermore, we note that choosing a liquid with high dispersion will significantly increase the sensor performance. We call this a “titling” method as it involves clockwise rotation of the fiber core mode curve (Fig. 7). We estimate the sensitivity in the dispersive case by observing where two neighbouring black lines (representing two dispersive points) cross the red and blue plasmonic curves, respectively. For example, if the refractive index of liquid is 1.40 at wavelength 684 nm and drops to 1.39 at wavelength 748.5 nm, we will obtain a sensitivity of 6450 nm/RIU, as illustrated by the green line in Fig. 7 (the green line). This is remarkable because we can obtain a large increase in sensitivity without change in the structure of the fiber sensor. Of cause, these two points serves as an example of high dispersive liquid.
To address the question of how much dispersion is required to obtain this effect, we use a simple model to estimate the required Abbe number of the liquid. The dispersion curve is extrapolated linearly based on the n=1.39 and 1.40 data points. The Abbe number is estimated as:
| (6) |
where , and are the refractive indices of the material at the wavelengths of the d-, F- and C- spectral lines (587.6 nm, 486.1 nm and 656.3 nm) respectively. This requirement is attainable, since methanol has an Abbe number of = 13.66 with refractive index 1.3172 at 750nm, while ethylene glycol has a Abbe number of Vd = 12.86 with refractive index 1.41856 at 750nm refractiveindexinfo . A mixture of methanol and ethylene glycol in a certain ratio should be able to simultaneously satisfy the optimal index and dispersion properties for achieving high sensitivity. Because the dispersion of a liquid mixture is complicated, we stop the expansion and emphasize the method.
5 Conclusion
By constructing a comprehensive visualization of mode coupling curves, we elucidate the fundamental physics underlying the optimization of a D-shaped fiber optical SPR sensor. A fiber sensor design is proposed based on an hollow core photonic crystal fiber with a liquid filled in the central hole. While the filling liquid satisfies the optimal index and high dispersion property simultaneously, the performance of the fiber optical SPR sensor can be improved significantly. Apart from having high sensitivity, this sensor design has the advantage of simplicity: the planar geometry of the gold film means that film deposition and verification should be straightforward, which is important for the feasibility of sensor applications.
Acknowledgements.
This work is supported by the National Science Foundations of China under Grants (No.61275125), the Research Foundation for the Doctoral Program of Higher Education of Ministry of Education (20124408110003), the Province-Ministry Industry-University-Institute Cooperation Project of Guangdong Province under Grant (No. 2010B090400328), the Shenzhen Science and Technology Project, the Shenzhen Nanshan District Science and Technology Project, the High-level Talents Project of Guangdong Province.References
- (1) Y. Yanase, A. Araki, H. Suzuki, T. Tsutsui, T. Kimura, K. Okamoto, T. Nakatani, T. Hiragun, M. Hide, Biosensors and Bioelectronics 25(5), 1244 (2010). DOI 10.1016/j.bios.2009.09.042
- (2) T. Srivastava, R. Das, R. Jha, Plasmonics pp. 1–7 (2012). DOI 10.1007/s11468-012-9421-x
- (3) R. Slavik, J. Homola, E. Brynda, Biosensors and Bioelectronics 17(6-7), 591 (2002). DOI 10.1016/S0956-5663(02)00013-1
- (4) F. Delport, J. Pollet, K. Janssen, B. Verbruggen, K. Knez, D. Spasic, J. Lammertyn, Nanotechnology 23(6), 065503 (2012). DOI 10.1088/0957-4484/23/6/065503
- (5) R. Verma, B.D. Gupta, Sensors and Actuators B: Chemical 177(0), 279 (2013). DOI 10.1016/j.snb.2012.10.135
- (6) M. Kanso, S. Cuenot, G. Louarn, Plasmonics 3, 49 (2008). DOI 10.1007/s11468-008-9055-1
- (7) A. Hassani, M. Skorobogatiy, J. Opt. Soc. Am. B 24(6), 1423 (2007). DOI 10.1364/JOSAB.24.001423
- (8) A. Hassani, M. Skorobogatiy, Opt. Express 14(24), 11616 (2006). DOI 10.1364/OE.14.011616
- (9) V.A. Popescu, N.N. Puscas, G. Perrone, J. Opt. Soc. Am. B 29(11), 3039 (2012). DOI 10.1364/JOSAB.29.003039
- (10) B. Shuai, L. Xia, Y. Zhang, D. Liu, Opt. Express 20(6), 5974 (2012). DOI 10.1364/OE.20.005974
- (11) D. Monzón-Hernández, J. Villatoro, D. Talavera, D. Luna-Moreno, Appl. Opt. 43(6), 1216 (2004). DOI 10.1364/AO.43.001216
- (12) L. Tong, L. Hu, J. Zhang, J. Qiu, Q. Yang, J. Lou, Y. Shen, J. He, Z. Ye, Opt. Express 14(1), 82 (2006). DOI 10.1364/OPEX.14.000082
- (13) Z. Chen, J. Tang, R. Fan, Y. Zhong, J. Zhang, S. Li, pp. 77,538K–77,538K–4 (2011). DOI 10.1117/12.885183
- (14) Y.L. Lo, C.H. Chuang, Z.W. Lin, Opt. Lett. 36(13), 2489 (2011). DOI 10.1364/OL.36.002489
- (15) M. Tian, P. Lu, L. Chen, C. Lv, D. Liu, Optics Communications 285(6), 1550 (2012). DOI 10.1016/j.optcom.2011.11.104
- (16) L. Xuejin, Y. Yongqin, H. Xueming, S. Kuiyan, Z. Li, Chinese Journal of Lasers 36(5), 1140 (2009)
- (17) Y. Yu, X. Li, X. Hong, Y. Deng, K. Song, Y. Geng, H. Wei, W. Tong, Opt. Express 18(15), 15383 (2010). DOI 10.1364/OE.18.015383
- (18) J. Pomplun, L. Zschiedrich, R. Klose, F. Schmidt, S. Burger, physica status solidi (a) 204(11), 3822 (2007). DOI 10.1002/pssa.200776414
- (19) H. Raether, Surface plasmons on smooth and rough surfaces and on grattings (Springer-Verlag Berlin, 1988)
- (20) J.M. Pitarke, V.M. Silkin, E.V. Chulkov, P.M. Echenique, Reports on Progress in Physics 70, 1 (2007). DOI 10.1088/0034-4885/70/1/R01
- (21) URL http://refractiveindex.info