The Evolving Radio Photospheres of Long-Period Variable Stars
Abstract
Observations with the Karl G. Jansky Very Large Array at 46 GHz (7 mm) have been used to measure the size and shape of the radio photospheres of four long-period variable stars: R Leonis (R Leo), IRC+10216 (CW Leo), Cygni ( Cyg), and W Hydrae (W Hya). The shapes of the stars range from nearly round to ellipticities of 0.15. Comparisons with observations taken several years earlier show that the photospheric parameters (mean diameter, shape, and/or flux density) of each of the stars have changed over time. Evidence for brightness asymmetries and non-uniformities across the radio surfaces are also seen in the visibility domain and in images obtained using a sparse modeling image reconstruction technique. These trends may be explained as manifestations of large-scale irregular convective flows on the stellar surface, although effects from non-radial pulsations cannot be excluded. Our data also allow a new evaluation of the proper motion of IRC+10216. Our measurement is in agreement with previous values obtained from radio wavelength measurements, and we find no evidence of statistically significant astrometric perturbations from a binary companion.
Subject headings:
stars: AGB and post-AGB – stars: atmospheres – stars: fundamental parameters – stars: imaging1. Introduction
Stars on the asymptotic giant branch (AGB) emit continuum radiation at centimeter and (sub)millimeter wavelength from a “radio photosphere” with a radius approximately twice that of the classical photospheric radius , defined by the line-free regions of the optical-infrared spectrum (Reid & Menten 1997; hereafter RM97). For Mira-type variables, is typically 1–2 AU. Just outside of this radius, at 1–, there exists a molecular layer (sometimes referred to as the “MOLsphere”; Tsuji 2000, 2001) that may be nearly opaque in the visible and infrared (Reid & Goldston 2002; Perrin et al. 2004; Tsuji 2008). The radio photosphere lies near the outskirts of this molecular layer, at .
The radio photosphere exists within a critical juncture between the stellar “surface” and the atmospheric regions several AU further out, where the stellar wind is launched. AGB star winds are generally assumed to be dust-driven. This requires the transport of gas from the warmer, dust-free regions of the photosphere to heights cool enough for dust grain formation and survival. The gas transport is believed to involve pulsations, convection, and/or shocks (e.g., Höfner 2008). Studying the characteristics of the radio photosphere and its temporal changes can therefore provide valuable diagnostic information on the relative importance of these different processes. In cases where radio photospheres can be spatially resolved, such observations can also be used to help test the increasingly sophisticated two- and three-dimensional (3D) models of AGB star atmospheres that are becoming available (Woitke 2006; Freytag & Höfner 2008; Freytag, Liljegren, & Höfner 2017).
Spatially resolved imaging observations are possible for AGB stars within 200 pc using the most extended configurations of the Very Large Array (VLA) and the Atacama Large Millimeter/submillimeter Array (ALMA). Reid & Menten (2007; hereafter RM07) published the first resolved 7 mm images of the radio photospheres of three oxygen-rich AGB stars [R Leo, Mira ( Ceti), and W Hya] obtained with the VLA, and Menten et al. (2012; hereafter M12) published similar observations for the carbon star IRC+10216 (CW Leo). These observations revealed an intriguing result: two of the four stars observed (R Leo and W Hya) exhibited statistically significant deviations from sphericity, while Mira and IRC+10216 appeared approximately spherical. However, in 2014 observations from the VLA and ALMA, Matthews et al. (2015) found that Mira too appeared “squashed” (see also Vlemmings et al. 2015; Wong et al. 2016). These results further hinted that Mira’s shape has evolved with time.
Deviations from sphericity in AGB stars could have several possible causes, either intrinsic or extrinsic. These include rotational flattening (e.g., if the star were spun up by mass accretion or an in-spiraling companion; e.g., Livio 1994), tidal forces from a companion (e.g., Huggins et al. 1990), magnetic effects (e.g., Szymczak et al. 1998), non-radial pulsations (e.g., Tuthill et al. 1994; Stello et al. 2014; Wood 2015), or manifestations of irregular convective flows resulting from the interactions between large-scale convective cells and the stellar pulsation (Freytag et al. 2017). Crucial to distinguishing between these possibilities is determining whether the observed shapes are static or variable.
To explore this topic further, we present here new 7 mm imaging observations of four nearby AGB stars, including the three stars previously imaged by MR07 and M12. Our study includes the first resolved imaging of the radio photosphere of an S-type star to allow comparison of its properties with M- and C-type stars and to provide a benchmark for future studies.
2. Sample Selection
The targets for the current investigation include two M-type (oxygen-rich) stars previously observed by RM07 (R Leo and W Hya), the carbon star IRC+10216 (previously imaged by M12), and the S-type111S-type stars contain similar amounts of carbon and oxygen. star Cyg. The centimeter-wavelength emission of Cyg was studied at 8.4 GHz, 14.9 GHz, and 22.4 GHz by RM97, but its radio photosphere has never been resolved. Table 1 summarizes some key properties of the sample. R Leo, Cyg, and IRC+10216 are all Mira-type (long-period) variables. W Hya is often classified as a semi-regular variable, although it has just a single dominant pulsation period and its properties are generally similar to those of a Mira.222See https://www.aavso.org/vsot$_$whya for discussion.
| Name | (J2000.0)∗ | (J2000.0)∗ | Spectral | SiO | Date of | |||
|---|---|---|---|---|---|---|---|---|
| (km s-1) | (pc) | Class | (days) | Masers? | Observation | |||
| (1) | (2) | (3) | (4) | (5) | (6) | (7) | (8) | (9) |
| Oxygen-rich | ||||||||
| R Leo | 09 47 33.4879 | 11 25 43.665 | 95 | M6e-9e | 303.5 | Yes | 23-Feb-2014 | |
| W Hya | 13 49 01.9981 | 28 22 03.488 | +42.0 | 110 | M7.5e-9e | 414.7 | Yes | 24-Feb-2014 |
| S-type | ||||||||
| Cyg | 19 50 33.9244 | 32 54 50.610 | +8.9 | 135 | S6.2e-10.4e | 409.3 | Yes | 13-Mar-2014 |
| Carbon-rich | ||||||||
| IRC+10216 | 09 47 57.4443(7) | 13 16 43.815(10) | 130 | C9.5e | 630.0 | No | 22-Feb-2014 | |
Note. — Units of right ascension are hours, minutes, and seconds. Units of declination are degrees, arcminutes, and arcseconds. Explanation of columns: (1) star name; (2) & (3) right ascension and declination; (4) systemic velocity relative to the Local Standard of Rest (LSR); (5) adopted distance in parsecs; (6) spectral type; (7) pulsation period in days; (8) indication of whether or not the star has SiO maser emission; (9) date of observation. Adopted distances for R Leo, W Hya, and Cyg are based on the period luminosity relation of Feast et al. (1989) using the data of Haniff et al. (1995); the value for IRC+10216 is based on the mean of literature values (see M12). Spectral types are from Baudry et al. 1990 and Cohen 1979. The period of IRC+10216 is taken from M12; for the other three stars, periods were estimated based on fits to visible light curve data from the American Association of Variable Star Observers (AAVSO) using the VStar software developed by D. Benn (https://www.aavso.org/vstar). Fits were performed using data from the three pulsation cycles bracketing the date of the VLA observations.
3. Observations
Continuum observations of the four target stars (Table 1) were conducted at a central frequency of 46 GHz ( mm) using the Karl G. Jansky Very Large Array (VLA)333The VLA of the National Radio Astronomy Observatory (NRAO) is operated by Associated Universities, Inc. under cooperative agreement with the National Science Foundation. in its most extended (A) configuration (0.68 km to 36.4 km baselines). Observations of each star were obtained during a single 3-hour session. Data were recorded with 2-second integration times. Antenna pointing corrections were evaluated hourly using observations of a strong point source at X-band (8 GHz). 3C286 was observed once per session to serve as a bandpass calibrator and to allow absolute calibration of the flux density scale.
Two different observing strategies were employed, depending on whether or not the target star has known SiO maser emission. For the stars with SiO masers (see Table 1), emission from the strong SiO =1, =1-0 line at 43.1 GHz was used to calibrate the atmospheric phase variations, as was done previously by Reid & Menten (1990) using H2O masers and by RM97 using SiO masers. A 3-bit observing mode with dual circular polarizations was used, and the WIDAR correlator was configured in a standard “continuum” mode, with 4 baseband pairs tuned to contiguously cover an 8-GHz frequency window centered near 46 GHz. Each baseband pair contained 16 subbands, each with a bandwidth of 128 MHz and 128 spectral channels. This frequency range included the SiO =1 and =2, =1-0 maser transitions as well as several other weaker SiO lines. Each star was observed during two blocks of roughly 0.75 to 1 hour duration each, bracketed by observations of a neighboring complex gain calibrator (see Table 3).
For IRC+10216, which is not an SiO maser emitter, the same 3-bit correlator set-up was used as described above, with a center frequency of 44 GHz. However, to allow calibration of the atmospheric phases, rapid switching was performed performed between the target and a nearby gain calibrator (see Table 2) with a duty cycle of approximately 95 seconds (55 seconds on target, 40 seconds on a calibrator). The gain calibrator scans alternated between J1002+1216 and J0943+1702 (lying 3.78 deg and 3.92 deg, respectively, from IRC+10216). Weather conditions during our observations were clear and dry, with wind speeds of 2.8 m s-1. Carilli & Holdaway (1997) have shown that this combination of duty cycle, calibrator separation, and stable weather conditions is generally sufficient to result in near diffraction-limited seeing at 7 mm in the VLA A configuration (see also below).
4. Data Reduction
Data processing was performed using the Astronomical Image Processing System (AIPS; Greisen 2003). The data were loaded directly into AIPS from archival science data model files via the Obit software package (Cotton 2008). The default calibration (‘CL’) table was subsequently regenerated to update the gain and opacity information, and antenna positions were updated to the best available values.
After flagging visibly corrupted data, a requantizer gain correction was applied using the AIPS program TYAPL. A fringe fit was then performed using a 1-minute segment of data on 3C286 to correct the instrumental delays. Delay solutions were determined separately for the four independent basebands. Bandpass calibration was performed in the standard manner, and the absolute flux density scale was calculated by adopting the latest time-dependent flux density values for 3C286 from Perley & Butler (2013), giving a flux density as a function of frequency of the form: , where is the frequency expressed in GHz and is in Jy.
Following this step, different calibration procedures were followed depending on whether or not observations of SiO maser emission were obtained. These two cases are described in turn in the following subsections.
| Source | (J2000.0) | (J2000.0) | Flux Density (Jy) | (GHz) | Date |
|---|---|---|---|---|---|
| J0935+0915a | 09 35 13.6411 | 09 15 07.813 | 0.1280.003 | 41.9395 | 23 February 2014 |
| … | … | … | 0.1170.003 | 49.8595 | … |
| J0943+1702b | 09 43 17.2243 | 17 02 18.969 | 0.1350.003 | 40.0400 | 22 February 2014 |
| … | … | … | 0.1150.003 | 47.9600 | … |
| J1002+1216b | 10 02 52.8452 | 12 16 14.587 | 0.1000.003 | 40.0400 | 22 February 2014 |
| … | … | … | 0.0960.002 | 47.9600 | … |
| J1339-2620c | 13 39 19.8907 | 26 20 30.496 | 0.3790.006 | 40.0395 | 24 February 2014 |
| … | … | … | 0.3620.009 | 47.9595 | … |
| J2010+3322d | 20 10 49.7063 | 33 22 13.627 | 0.1880.002 | 41.9395 | 13 March 2014 |
| … | … | … | 0.1540.002 | 49.8595 | … |
Note. — Units of right ascension are hours, minutes, and seconds, and units of declination are degrees, arcminutes, and arcseconds. Explanation of columns: (1) source name; (2) & (3) right ascension and declination (J2000.0); (4) derived flux density in Jy; values are quoted for the lowest and highest frequency subbands from each observation; (5) frequency at which the flux density in the fourth column was computed; (6) date of observation.
4.1. Calibration of Stars with Maser Emission
For target stars where SiO maser emission was observed within the band, the calibration approach of Reid & Menten (1990; see also RM97) was adapted for use with the new wide bandwidth VLA correlator (see Matthews et al. 2015). In these cases, self-calibration on the bright maser emission allows improvement of the calibration of the atmospheric phases, effectively allowing achievement of nearly perfect “seeing” in the stellar continuum measurements.
Following bandpass calibration and calculation of the absolute flux density scale as described above, calibration of the frequency-independent portion of the complex gains was performed for the observed calibrator sources following the standard approach for high-frequency data and their flux densities were computed (see Table 3). Amplitude and phase corrections computed from the phase calibration source(s) were then applied to the data from the target star, allowing the removal of any slow (hour timescale), instrumental gain drifts. Additionally, corrections to the positions of the stars to account for their proper motions were applied based on the values from van Leeuwen (2007). This ensured that the stellar emission was located close to the phase center of subsequent images.
After these initial calibration steps, the spectral channel containing the strongest SiO =1, =1-0 maser emission from the target star was split from the main data set, and several iterations of phase-only self-calibration were performed until convergence was reached. Based on these solutions, phase corrections appropriate for each of the 64 subbands across the full 8-GHz continuum band were derived using the AIPS task SNP2D.
Following application of the above corrections, a second round of self-calibration was performed on the reference channel, solving for both amplitudes and phases. To prevent drift in the amplitude scale, the gains were normalized during this step. After these corrections were applied to the full data set, the data were averaged in time to 10-second records and spectral channels 1-3 and 125-128 at the edges of each subband were flagged because of their significantly higher noise levels. Spectral channels known to contain line emission or radio frequency interference were also flagged. Next, the data were Hanning-smoothed in frequency to suppress Gibbs ringing artifacts caused by the narrow SiO maser lines. At this stage, the AIPS task REWAY was used to compute optimized weights for the visibility data, and lastly, the data were further averaged in frequency to produce 8 spectral channels per subband.
4.2. Calibration of Data without Maser Emission
For the IRC+10216 data set, calibration of the frequency-independent portion of the complex gains was performed in the standard manner using observations of the calibrators J0943+1702 and J1002+1216. First, phase-only corrections were solved for and applied, followed by amplitude and phase corrections. The typical residual rms scatter in the phase solutions was 6 deg for all antennas.
Subsequent steps were the same as for the sources with SiO lines, with the exception that flagging of line emission was unnecessary, as no significant line emission was found within the observing band (39.98-48.02 GHz). Prior to imaging (Section 4.3), a positional offset was applied to compensate for proper motion and place the star at the phase center.
The self-calibration procedure used for the stars with SiO maser emission (Section 4.1) destroys absolute position information. However, the calibration technique used for IRC+10216 preserves the positional accuracy and allowed us to measure the absolute position of the star and improve the characterization of its proper motion. This analysis is described in the Appendix.
4.3. Imaging the Data
Initial imaging and deconvolution of the visibility data were performed using the CLEAN deconvolution algorithm as implemented in the AIPS IMAGR program (but see Section 5.4.2). For the CLEAN images presented here, we used a Briggs robustness parameter of =0, a cell size of 5 mas, and a circular restoring beam (see Table 3). Corrections were applied during imaging for the frequency dependence of the primary beam and the expected spectral index of the sources (=1.86; RM97). Imaging was also attempted using a multi-scale CLEAN algorithm, but differences in the resulting images were insignificant.
| Star | PA | RMS noise | |||
|---|---|---|---|---|---|
| (mas) | (mas) | (degrees) | (mas) | (Jy beam-1) | |
| R Leo | 42 | 34 | 38 | 16.4 | |
| W Hya | 82 | 34 | 70 | 21.1 | |
| Cyg | 42 | 37 | 39 | 13.6 | |
| IRC+10216 | 41 | 36 | 38 | 15.7 |
Note. — Images summarized here were produced using the CLEAN deconvolution method with robust weighting (=0) (see Section 4.3). and are the major and minor axes, respectively, of the dirty beam, measured at FWHM. The position angle (PA) of the beam was measured east from north. The images used for the present analysis were produced using circular restoring beams with FWHM diameters equal to the geometric mean of the dirty beam, except for W Hya, where a circular beam with FWHM 70 mas was adopted because of the significant beam elongation.
| Star | Optical Phase | PA | ||||||
|---|---|---|---|---|---|---|---|---|
| (mas) | (mas) | (degrees) | (mJy) | (AU) | (K) | |||
| (1) | (2) | (3) | (4) | (5) | (6) | (7) | (8) | (9) |
| Uniform Elliptical Disk Fits to Visibilities (New Data) | ||||||||
| R Leo | 0.23 | 543 (0.4) | 452 (0.5) | 1095 (1.1) | 0.170.06 | 5.80.9 (0.02) | 4.70.2 | 2016340 |
| W Hya | 0.61 | 714 (1.0) | 653 (0.4) | 05 (1.8) | 0.090.07 | 9.01.4 (0.03) | 7.50.3 | 1645280 |
| Cyg | 0.75 | 392 (1.3) | 362 (1.1) | 13311 (9.5) | 0.07 | 2.20.3 (0.02) | 5.10.2 | 1327210 |
| IRC+10216 | 0.41a | 884 (1.2) | 754 (1.1) | 705 (0.43) | 0.150.06 | 11.41.7 (0.01) | 10.60.4 | 1580260 |
| Elliptical Gaussian Fits to Images (New Data) | ||||||||
| R Leo | 0.23 | 342 (0.2) | 291 (0.2) | 1016 (3) | 0.150.06 | 6.00.9 (0.04) | … | … |
| W Hya | 0.61 | 422 (0.2) | 392 (0.2) | 149 (8) | 0.070.06 | 9.21.4 (0.04) | … | … |
| Cyg | 0.75 | 221 (0.4) | 221 (0.4) | 17156 (56) | 0.00.09 | 2.20.3 (0.03) | … | … |
| IRC+10216 | 0.41a | 614 (0.3) | 524 (0.2) | 745 (1) | 0.15 | 12.01.8 (0.06) | … | … |
| Uniform Elliptical Disk Fits to Visibilities (Previous Epochsb) | ||||||||
| R Leo | 0.55 | 6110 | 396 | 12 | 0.360.14 | 4.10.2 | 4.60.5 | 1630410 |
| W Hya | 0.25 | 6910 | 467 | 8318 | 0.330.14 | 8.00.4 | 6.20.6 | 2380550 |
| Cyg | 0.09 | … | … | … | … | 4.5c | … | … |
| IRC+10216 | 0.79a | 872 | 80 1 | 225 | 0.080.02 | 12.20.1 | 10.90.1 | 1660 |
Note. — Pulsation phases for R Leo, W Hya, and Cyg were computed by fitting visual light curve data from the AAVSO database (see Notes to Table 1). For IRC+10216, the phase was estimated from the infrared data of Shenavrin, Taranova, & Nadzhip (2011) through an extrapolation based on the period and date of maximum light derived by M12 (630 days and JDmax = 2452554, respectively). Quoted uncertainties on all quantities include formal, systematic, and calibration errors (see Text for details). Uncertainties in derived quantities do not account for uncertainties in the distance. For measured quantities, the value in parentheses indicates the contribution to the error budget from formal fit uncertainties. For a uniform disk, and are the major and minor axis sizes of the disk, respectively; for a Gaussian fit they represent the the FWHM dimensions of the elliptical Gaussian, after deconvolution with the size of the dirty beam. For a resolved source, measured from a Gaussian fit is expected to be 0.625 times the value measured from a uniform disk fit. Explanation of columns: (1) star name; (2) optical pulsation phase; (3) FWHM diameter of the major axis i mas; (4) FWHM diameter of the minor axis in mas; (5) position angle of the major axis in degrees, measured east from north; (6) ellipticity, defined as ; (7) 46 GHz flux density in mJy; (8) mean diameter of the radio photosphere in AU, derived using the geometric mean angular diameter; (9) brightness temperature, which for a uniform disk is defined as where is the speed of light, is the Boltzmann constant, and all quantities are expressed in cgs units.
| Star | Elapsed Time | PA | |||
|---|---|---|---|---|---|
| (days) | (mas) | (mas) | (degrees) | (mJy) | |
| (1) | (2) | (3) | (4) | (5) | (6) |
| R Leo | 4868 | ||||
| W Hya | 4862 | ||||
| Cyg | 8811 | … | … | … | |
| IRC+10216 | 2918 |
Note. — Observed changes in stellar parameters between the current observing epoch (this paper) and earlier epochs, when available. Values are based on the fits to the visibility data summarized in Table 4. Parameters with statistically significant changes are highlighted in boldface. For Cyg, a 20% uncertainty in the flux density was assumed for the earlier epoch.
5. Results
5.1. Measured Radio Photosphere Parameters for the Target Stars
5.1.1 Evidence for Deviations from Circular Symmetry
To measure the size, shape, and flux densities of the radio photospheres of the four stars in our sample, we have fitted two-dimensional (2D) uniform elliptical disk models to the visibility data using the AIPS task OMFIT. The results are presented in Table 4. The quoted uncertainties include contributions from the formal fitting uncertainties (Condon 1997), as well as from calibration and systematic errors (see Appendix of Matthews et al. 2015 for details). The dominant source of uncertainty in the derived flux densities is the absolute calibration uncertainty, which we assume to be 15% at 7 mm.444https://science.nrao.edu/facilities/vla/docs/manuals/oss/performance/fdscale. As a consistency check, we also determined the stellar parameters of the sample based on elliptical Gaussian fits to the CLEAN images (Section 4.3) using the AIPS task JMFIT. In all cases the parameters derived from the two fitting methods agree to within uncertainties. (For resolved sources, the FWHM sizes derived from Gaussian fits are expected to be a factor of 0.625 times smaller than those from a uniform disk fit).
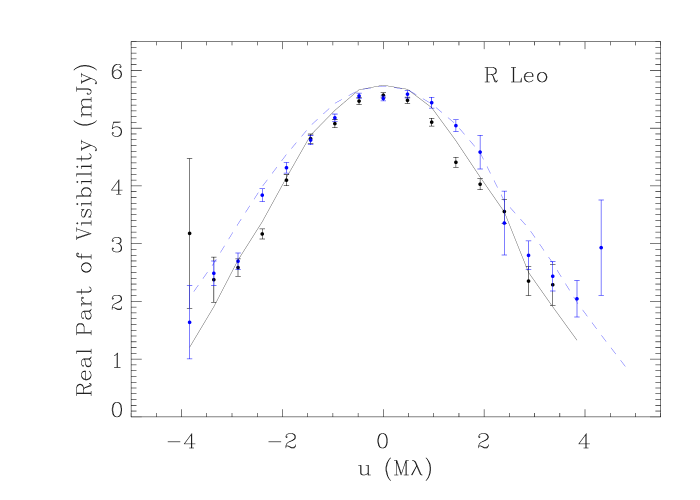
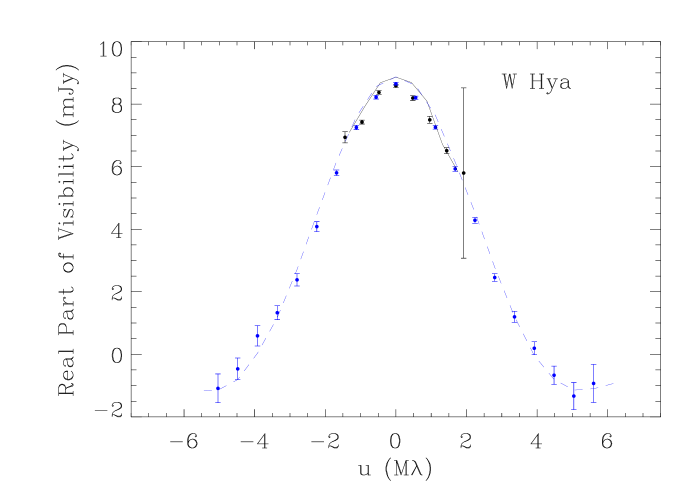
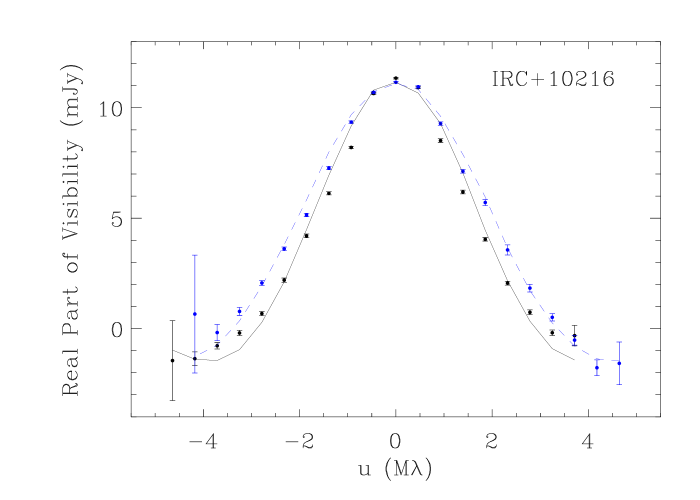
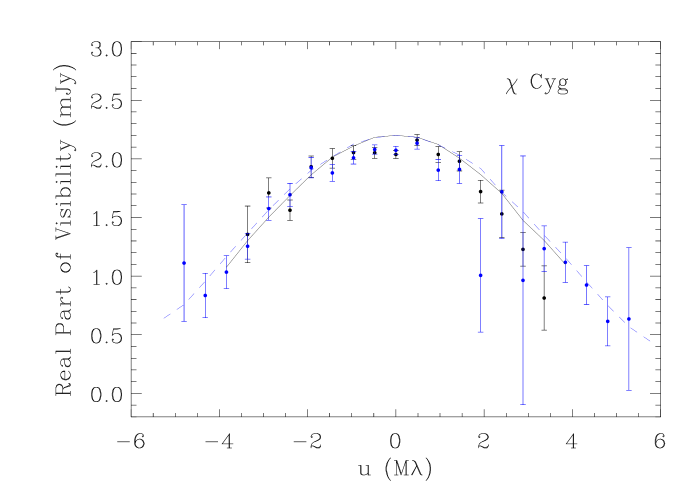
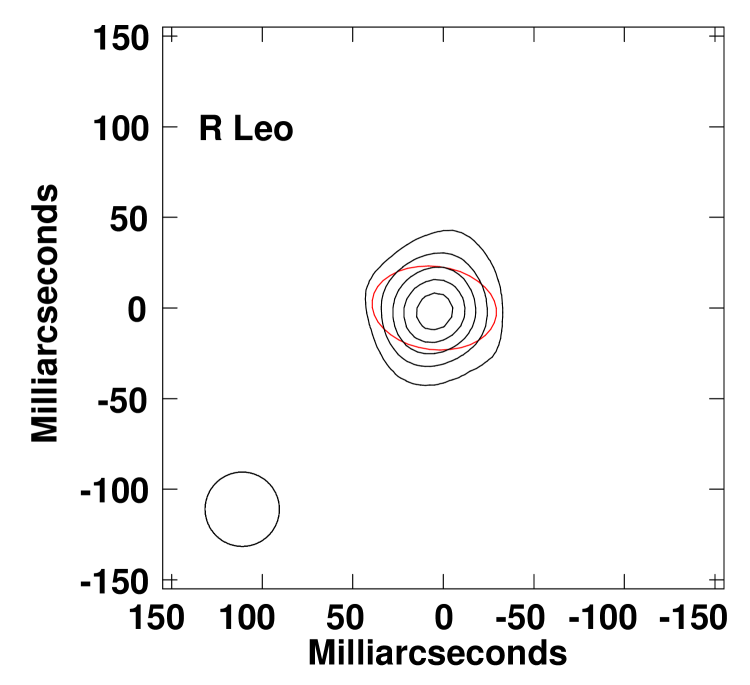
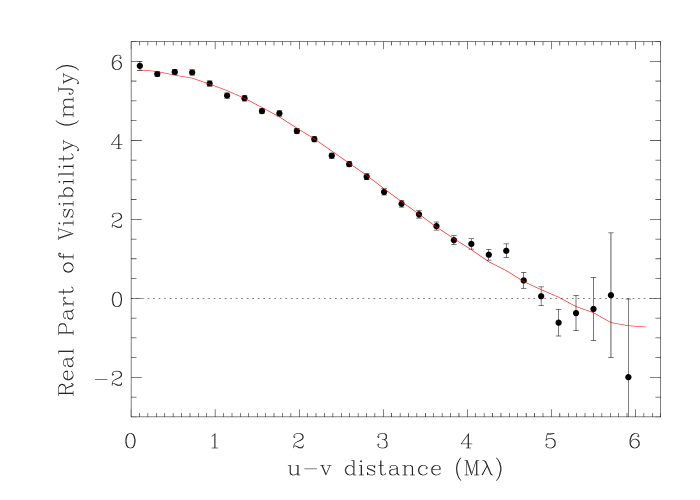
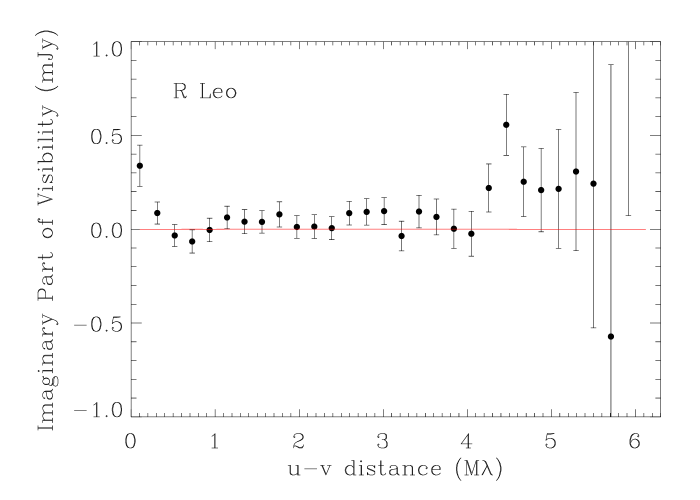
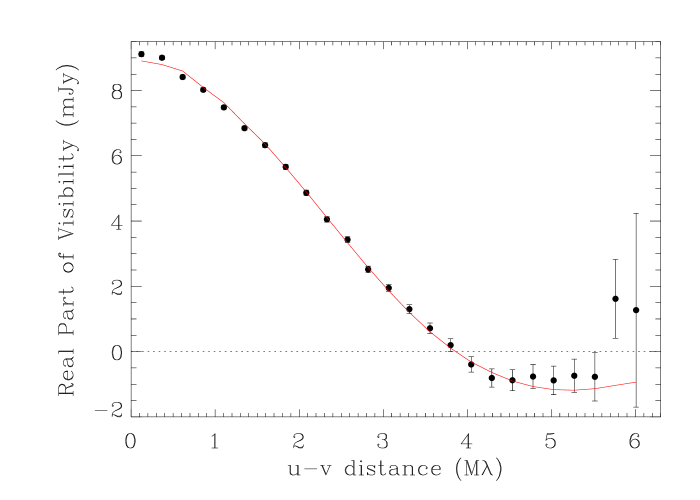
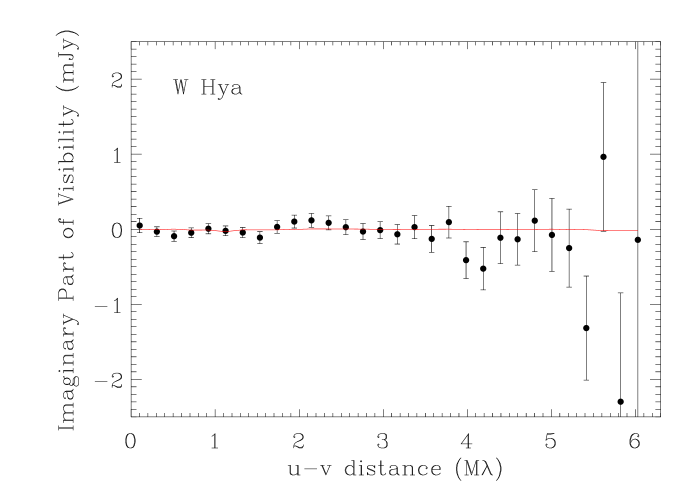
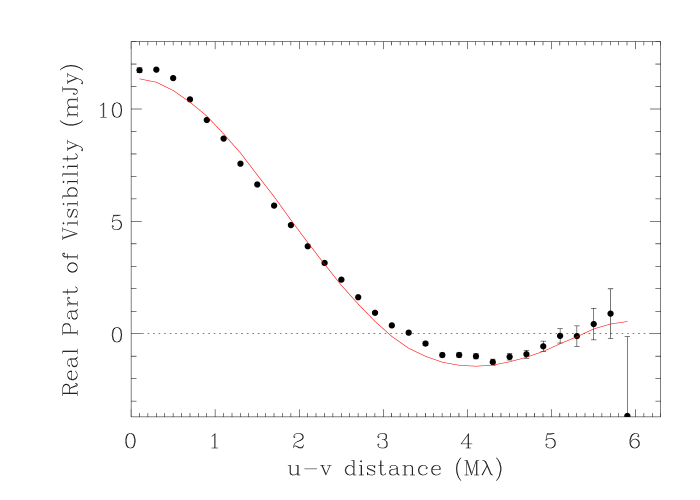
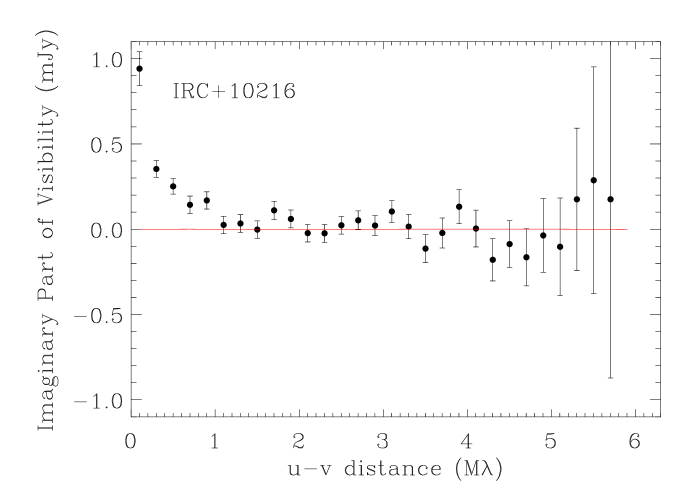
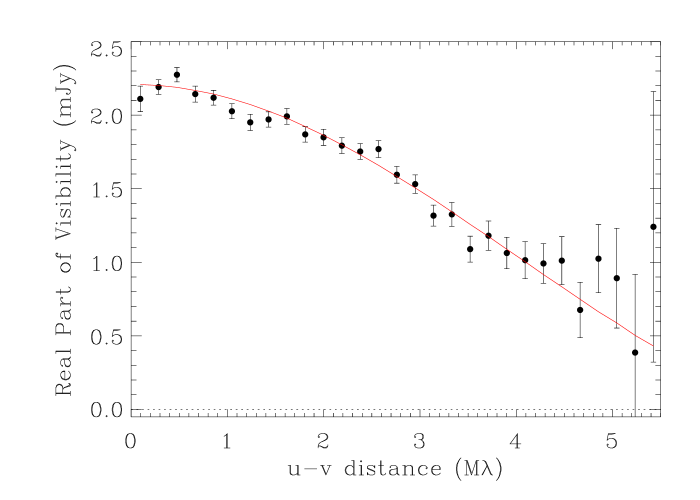
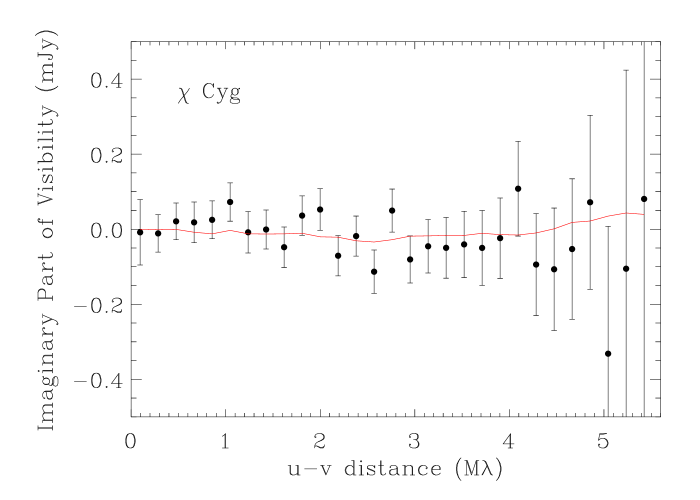
Based on the fit results in Table 4, the shapes of three of the stars in the current sample show deviations from circular symmetry. To further illustrate this effect, in Figure 1 we plot radial brightness cuts along the major and minor axis of each star in the visibility domain. To produce these profiles, the visibility data were rotated to place the major and minor axis, respectively, of each stellar disk along the rotated -axis of the visibility plane. The data used to form each plotted point along the -direction were then constrained to a narrow strip along the -axis (M).
Both R Leo and IRC+10216 exhibit statistically significant differences between their major and minor axis brightness profiles, indicative of a non-zero ellipticity. On the other hand, Cyg shows no statistically significant deviation from circular symmetry. These results are all consistent with the 2D uniform elliptical disk fits presented in Table 4. In the case of W Hya, the ability to compare the major and minor axis brightness profiles in Figure 1 is limited by the relatively low spatial resolution along the major axis of the dirty beam (see Table 3).
5.1.2 Evidence for Secular Shape Changes
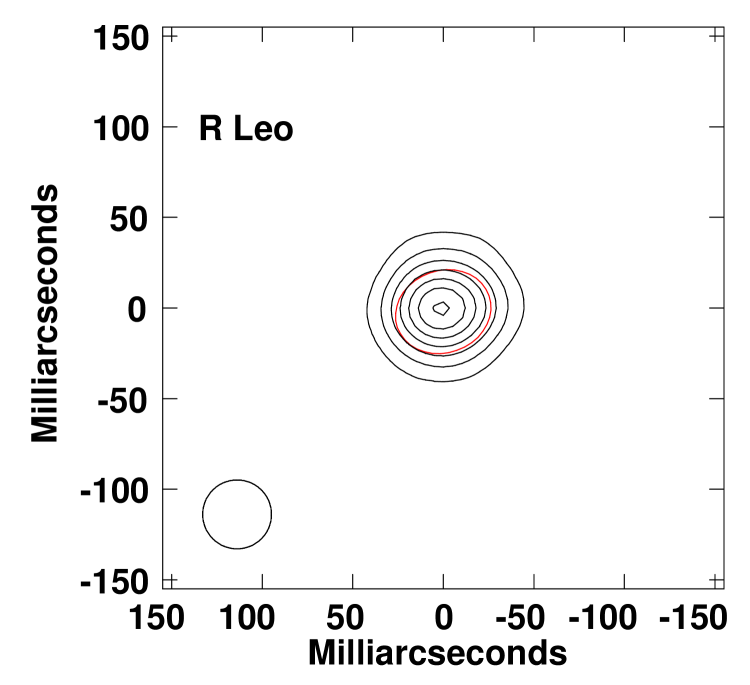
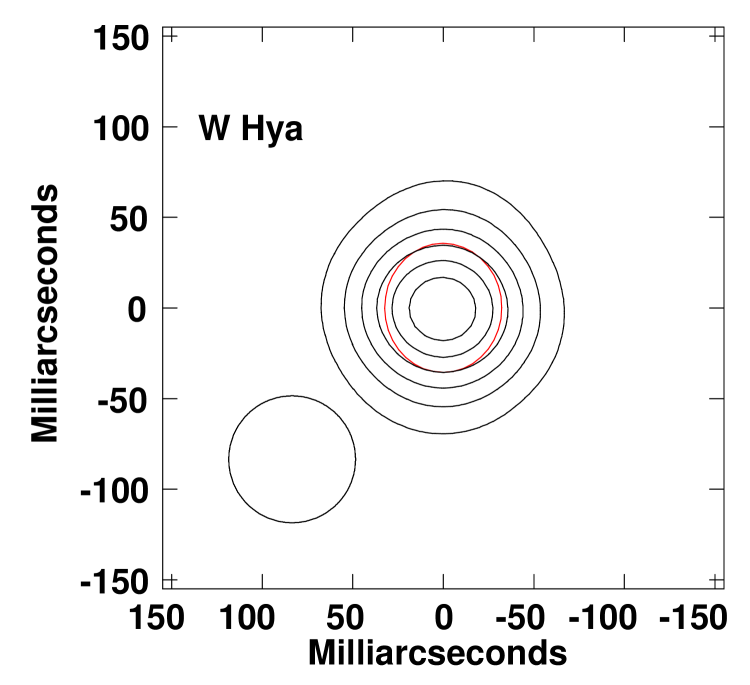
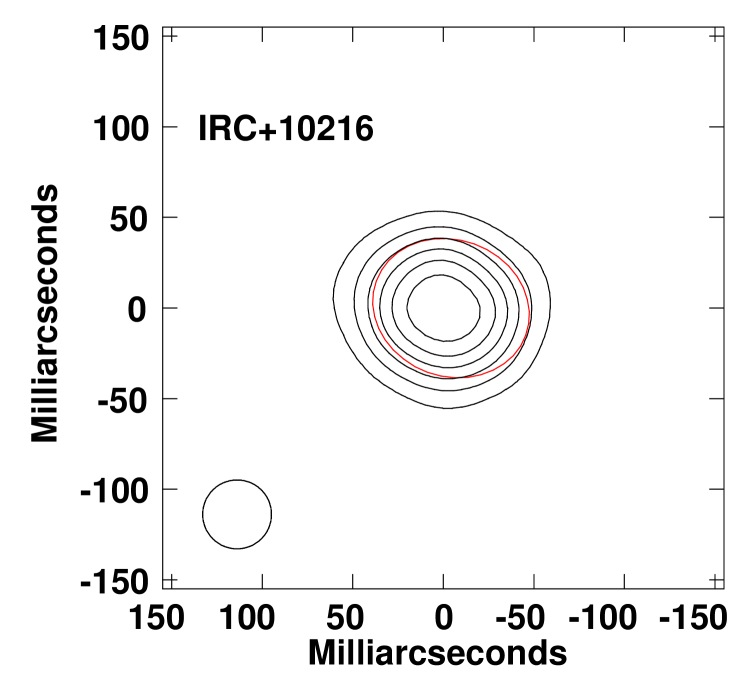
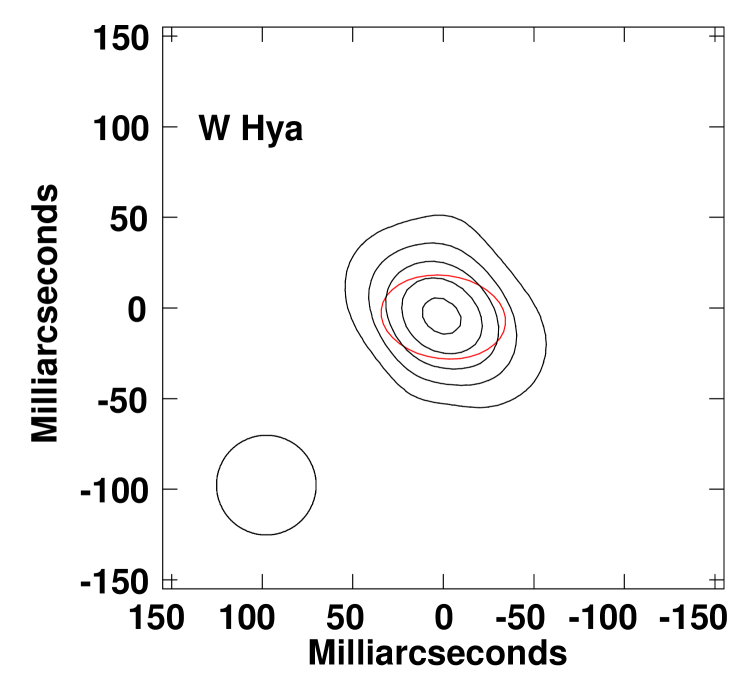
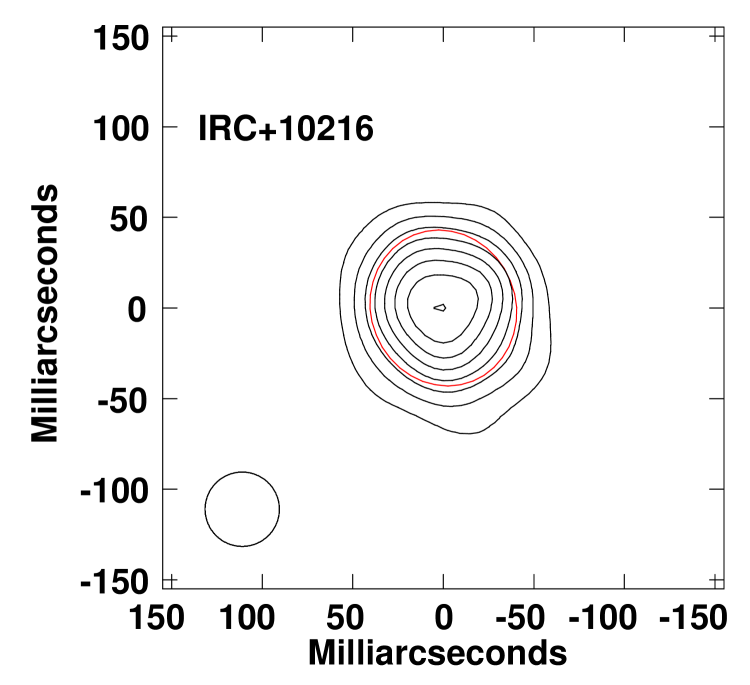
In Figure 2 we present contour images of each of the four observed stars (top row), with the results of the uniform elliptical disk fits to the visibility data (Table 4) overplotted as red ellipses. Along the bottom row of this figure we show comparable plots for the three previously observed stars based on the data from RM07 and M12. For each individual star, the data from the two epochs are contoured identically.
An examination of Figure 2, as well as the fit results in Tables 4 and 5, show that there appear to be statistically significant changes in the size, shape, and/or orientation of the radio photospheres of all three of the stars that have been imaged previously (R Leo, W Hya, and IRC+10216). In addition, both R Leo and Cyg appear to have undergone changes in flux density compared with earlier measurements. While Cyg was not previously observed at 7 mm, an extrapolation of its flux density from longer wavelength measurements taken in January 1990, assuming a spectral index of 1.86 (RM97), predicts a 7 mm flux density a factor of two larger than we measure from our recent observations. In the subsection that follows, we present additional discussion of the results for each individual star.

5.2. Results for Individual Stars
5.2.1 R Leo
R Leo is one of two stars for which RM07 measured a significant deviation from sphericity, with an ellipticity of 0.640.14. Our new radio observations find a somewhat rounder, though still elongated shape, with a different orientation compared with the earlier data (Table 5). An ellipticity 0.11 has also been reported previously for the optical photosphere of R Leo at variability phase =0.71 by Lattanzi et al. (1997), and a comparison with the earlier measurements by Tuthill et al. (1994) suggests that the elongation of the optical photosphere also changes orientation over time.
Our new measurement of the 46-GHz flux density of R Leo is 50% higher than the previous measurement of RM07. Based on 8.4-GHz measurements, RM97 found that radio photosphere fluxes tend to vary by 15% over the course of a pulsation cycle. However, at 46 GHz, flux density changes of order 50% over multi-year timescales have also been seen in measurements of Mira (Matthews & Karovska 2006; Matthews et al. 2015), suggesting that either the stars are more variable at higher frequencies, or that intra-cycle changes of larger amplitude are occurring, possibly due to changes in radio opacity (e.g., O’Gorman et al. 2015).
Despite the significant change in the radio flux density of R Leo between epochs, the observed shape change of the star, and the fact that the observations were conducted at different pulsation phases, the inferred mean diameter of R Leo is comparable during the two epochs. In contrast, at optical wavelengths, Burns et al. (1998) found that the size of R Leo changes by as much as 50% over the course of the stellar pulsation cycle. At these shorter wavelengths, the large changes are most likely primarily due to opacity changes and/or changes in the temperature structure of the outer atmosphere than physical motions of the surface.
Several authors have also previously published measurements of the size of R Leo based on observations in the near-infrared. For example, at 2.16m, Perrin et al. (1999) found a diameter of 28.180.05 mas at a phase =0.24, consistent with Wittkowski et al. (2016), who measured 29.61.3 mas at =0.6. Several other near-infrared diameter measurements in the literature are in general agreement with these values (e.g., Mennesson et al. 2002; Monnier et al. 2004; Fedele et al. 2005). A comparison with these various measurements suggests that the radio photosphere of R Leo is 1.7 times the extent of photosphere as measured at 2 m. Using mid-infrared data, Paladini et al. (2017) also recently reported evidence of a non-zero differential phase in R Leo that they attribute to variable asymmetries.
5.2.2 W Hya
RM07 previously measured a significant ellipticity of the radio photosphere of W Hya (0.33). In contrast, our new data reveal a nearly spherical shape, with only a slight hint of elongation along the north-south direction. The mean diameter that we measure for W Hya from our latest measurements is 20% larger than that found by RM07. The pulsation phase of our new measurement (=0.61) corresponds to the phase where measurements at optical wavelengths have previously shown other AGB stars to exhibit their maximum diameters (Burns et al. 1998; Young et al. 2000). However, in the visible band, this effect is likely the result of opacity changes rather than bulk motions of the atmosphere (Young et al.). Long-term monitoring at radio and/or mm wavelengths will be needed to determine whether discernible size changes are linked with the pulsation cycle, or instead occur on unrelated timescales and reflect other types of secular changes in the atmosphere (e.g., non-radial distortions or large-scale changes in the surface brightness).
Studies at other wavelengths have found evidence for fluctuating degrees of spherical symmetry in the atmosphere of W Hya. For example, for the optical photosphere, Lattanzi et al. (1997) reported that the major axis exceeded the minor axis by 20%, although no such effect was seen by Ireland et al. (2004). The mid-infrared measurements by Zhao-Geisler et al. (2015) suggest a minor-to-major axis ratio of 0.4-0.6 (see also Zhao-Geisler et al. 2011 and references therein), and Monnier et al. (2004) also reported deviations from a uniform (circular) disk at a wavelength of 2.2m.
The position angle of the (slight) elongation of W Hya measured from our VLA observations is nearly north-south, which agrees to within uncertainties with the magnetic field axis determined by Szymczak et al. (1998) from OH maser observations and with the axis along which Vlemmings et al. (2011) measured a velocity gradient in the SO line at 215 GHz. However, the earlier measurements of RM07 found the radio photosphere to be elongated almost east-west, suggesting that its shape and orientation are variable and not linked to any preferred axis or to the magnetic field.
Recently Vlemmings et al. (2017) measured the radio photosphere of W Hya in the submillimeter range (0.7 mm) using ALMA and reported a size of mas along a PA of 65.70.3 deg. While it is expected that the size of the radio photosphere should be smaller at shorter wavelengths because of opacity effects, the position angle and degree of flattening are also significantly different from our 7 mm JVLA measurements. The ALMA data were obtained at a pulsation phase of 0.3 in 2015 December, approximately 22 months after our JVLA observation. This suggests that the photospheric shape and/or brightness pattern may have changed on these timescales, but future contemporaneous observations at different frequencies would be useful for ruling out opacity-dependent effects and/or changes linked with the stellar pulsation cycle.
5.2.3 Cyg
The S-type star Cyg has not been previously resolved at radio wavelengths, so we cannot compare its radio size and shape to previous epochs. However, the 46-GHz flux density we measure for this star is roughly a factor of two smaller than predicted by the radio photosphere model of RM97 (their equation 7), and it lies below the extrapolation of the longer wavelength measurements of RM97 to 7 mm. Our current observations were obtained at an optical phase of 0.75, close to the phase where the bolometric flux is predicted to be at a minimum (Lacour et al. 2009), compared with RM97, at the time of whose observations the phase was 0.09.
The mean shape of Cyg in our new observations is found to be nearly spherical (but see also Section 5.4.2), with a mean diameter intermediate between the range of values observed for other M-type Miras (Table 5; MR07; Matthews et al. 2015). Thus from this single data point we find no evidence of a significant difference between the radio sizes of S-type versus M-type Miras. (In contrast, the carbon star IRC+10216 is nearly twice as large as the M-type Miras; see Section 5.2.4).
Previous measurements of the size of Cyg at 1.6m and a pulsation phase of =0.79 were made by Lacour et al. (2009), who derived a photospheric diameter of 21.490.11 mas and a size for the molecular layer of 27.350.13 mas. These authors inferred a temperature of 203232 K for the molecular layer, notably warmer than the brightness temperature of 1327210 K that we derive from our radio data (Table 5). On the other hand, at 2.2m, Perrin et al. (2004) derived a diameter and temperature for the molecular layer of 30.780.10 and 173753 K, respectively, at =0.76. Part of the apparent discrepancy likely stems from the fact that the results of Lacour et al. were derived taking into account limb darkening, whereas Perrin et al. argued that limb-darkened models do not provide a satisfactory fit to AGB star data.
5.2.4 IRC+10216
For the carbon star IRC+10216, we find no statistically significant changes in the mean diameter, degree of flattening, or in the 7 mm flux density compared to previous radio observations (see Tables 4 and 5 and M12). However, our new measurements do suggest a change in the position angle of the flattening.
The radio diameter of IRC+10216 (10.6 AU) is significantly larger than the three M- and S-type three stars in the sample (which range from 4.7-7.5 AU; see Table 4). Indeed, its 7 mm radio size is intermediate between that of M-type AGB stars measured to date and the red supergiant Betelgeuse (17.5 AU, assuming =200 pc; Lim et al. 1998; O’Gorman et al. 2015). However, the measured radio brightness temperature of IRC+10216, K, is significantly cooler than that of Betelgeuse at this wavelength, where 3450850 K (Lim et al.).
It is presently unclear whether the large radio size of IRC+10216 compared with the M-type sample is a general property of carbon stars or is instead related to its cool temperature and high luminosity (see also Section 5.4.1) and/or to its advanced evolutionary state. Radio opacity is tightly linked with the ionization of Na and K (RM97), and the physical radius of carbon stars as measured in the radio may on average be rather different from oxygen-rich AGB stars owing to the different physical conditions in their atmospheres. On the other hand, IRC+10216 is also a highly evolved AGB star that is thought to be close to transitioning into a protoplanetary nebula (e.g., Skinner et al. 1998; Osterbart et al. 2000), and this too may impact its radio size. Additional resolved imaging observations of carbon stars at millimeter wavelengths are needed to address the question of whether IRC+10216 is typical of its class.
Because of its optically thick and constantly evolving dust envelope, IRC+10216 does not have a well-defined photosphere at optical and infrared wavelengths (Stewart et al. 2016). Therefore, in contrast to the M- and S-type AGB stars that have been resolved, we cannot readily compare its radio size with a photospheric size measured at other wavelengths. However, based on the radio diameter and brightness temperature , one may derive a bolometric luminosity for the star based on the Stefan-Boltzmann relation: where is the Stefan-Boltzmann constant. We find , where we assume the solar luminosity to be 3.83 erg s-1. Adopting the stellar effective temperature of 2200 K from Cohen (1979), we then find a predicted stellar diameter of 5.5 AU. This implies that that radio photosphere of IRC+10216 is roughly twice the size of its “classical” photospheric diameter, the same ratio as seen in M-type AGB stars.
Both the brightness temperature and the bolometric luminosity that we derive for IRC+10216 agree with the values derived by M12 to within uncertainties. The uncertainty in is, however, quite large and is dominated by calibration uncertainties in the absolute flux density.
5.3. Discussion: the Possible Origins of Secular Shape Changes of Radio Photospheres
Our new data provide the first compelling evidence that the shapes of the radio photospheres of AGB stars may not only be non-spherical, but may evolve over time. Previously, Mira was shown to have a non-spherical shape, with tentative evidence that it had evolved over 14 years (Matthews et al. 2015). Our new data suggest this phenonemon is likely to be common, at least for M-type AGB stars. Furthermore, these results allow us to exclude several possible explanations for the origin of the non-spherical shapes of radio photospheres (see Section 1), including stellar rotation, tidal effects, and magnetic fields. In each of these cases, any induced ellipsoidal shape and/or its axis of elongation would be expected to be stable over timescales of many decades and therefore cannot readily explain the shape changes observed in a span of 8-14 years.
Because we have just two epochs of observations separated by several years (Table 5), we presently have very limited information on how rapidly the shapes and sizes of radio photosphere may change. Furthermore, although in all cases the observations in the two epochs were obtained at different phases of the stellar pulsation cycle, we do not yet have sufficient information to determine whether changes in parameters including shape, radius, or temperature of the radio photosphere are discernible over the course of a single cycle. To date, our best insight into this question comes from the case of Mira, where Matthews et al. (2015) found that the ellipticity and position angle of the photosphere appeared to be stable on timescales of at least 8 months—a significant fraction of the stellar pulsation period.
Recent 3D hydrodynamic simulations of AGB star atmospheres by Freytag et al. (2017; see also Freytag & Höfner 2008) make predictions that provide a possible framework for the interpretation of our data. In these models, the dynamics of the atmosphere is governed by the interaction between long-lived giant convective cells (Schwarzchild 1975) with shorter-lived granules and strong radial pulsations. Such cells may be responsible for the elevation of material in different parts of the atmosphere and lead to temperature changes within the radio photosphere. Associated shock waves may also lead to temperature fluctuations within the radio photosphere. Interestingly, even though the aforementioned models adopt spherically symmetric flows with purely radial, fundamental mode pulsations, the resulting stars clearly manifest non-spherical shapes and non-radial structures, with discernible changes in the shape and surface brightness of the star occurring over time. Specifically, these models predict that the large-scale convective cells, which are expected to play such an important role in governing the atmospheric dynamics, should be stable on timescales of order one year, comparable to the timescale over which the shape of Mira’s radio photosphere appeared to be relatively stable. Future monitoring observations with a cadence of a few weeks or less will be important for testing whether this trend is seen in other stars and/or is reproduced during additional Mira observing epochs. Meanwhile, further evidence for the role in giant convective cells in the radio properties of our sample is discussed below (Section 5.4).
Non-radial pulsations are another potential explanation for the non-spherical shapes of radio photospheres, although their occurrence in AGB stars is not well-established. For example, Stello et al. (2014) have suggested that while non-radial pulsations may be present in semi-regular variables, they appear to be absent from Miras (but cf. Tuthill et al. 1994). On the other hand, Freytag & Höfner (2008) have noted that the distinction between radial and non-radial pulsations may become blurred, since the type of pulsations present in their hydrodynamic models combine changes in volume with changes in the shape of the star—despite initial starting conditions with spherical symmetry and fundamental mode pulsations.
5.4. Evidence for Non-Uniform Brightness of the Radio Surfaces
5.4.1 Visibility Plane Analysis
Figure 3 presents another representation of the - data, this time showing the azimuthally averaged real and imaginary parts of the visibility amplitude versus projected baseline length for each of the four stars in the present sample. The overplotted red lines show the best-fitting uniform elliptical disk model, based on the parameters from Table 4. These plots are helpful for highlighting not only ellipticity, but also deviations in the stellar surface brightness from a uniform circular or elliptical disk. Based on Figure 3 all four stars show at least some hints of deviations from this simple model, suggesting asymmetries in shape and/or the presence of brightness non-uniformities across the stellar surface. For W Hya and R Leo, this is most evident in the imaginary part of the visibilities. Similar effects have been seen previously on the radio surface of Mira (Matthews et al. 2015; Vlemmings et al. 2015; Wong et al. 2016) and in recent ALMA 0.7 mm observations of W Hya (Vlemmings et al. 2017).
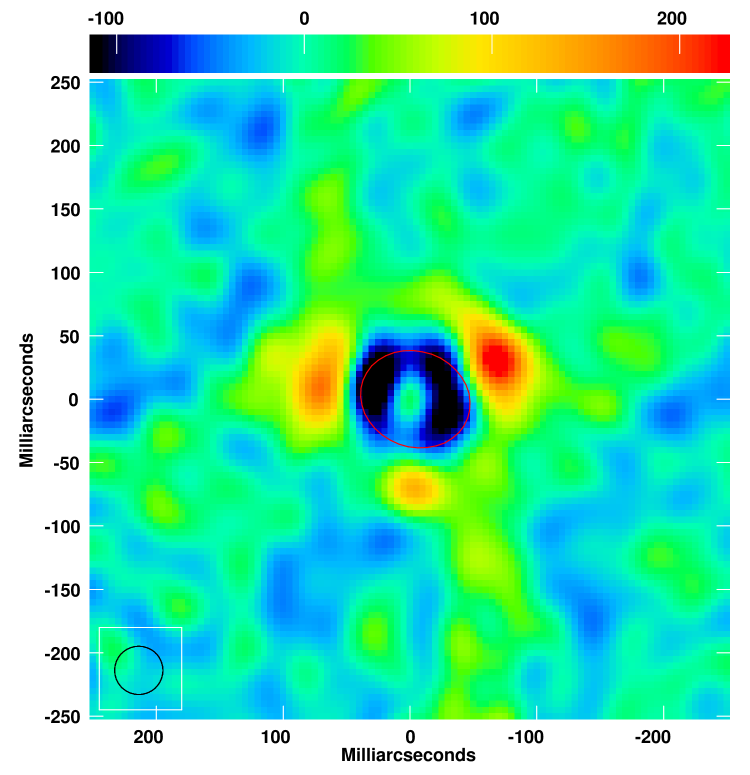
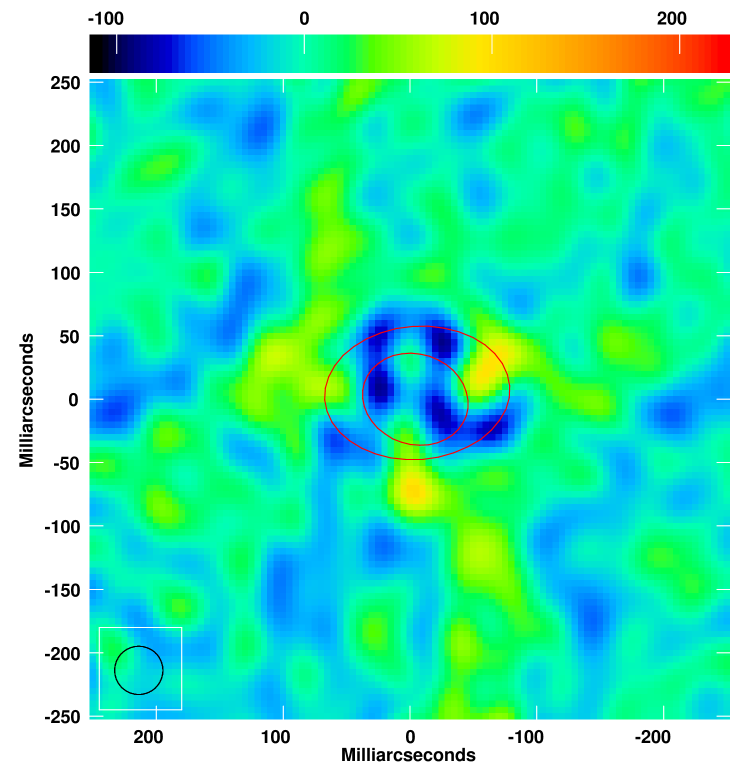
Based on the visibility plots in Figure 3, the most pronounced deviations from a uniform brightness elliptical disk are seen in the case of IRC+10216, which is also the star in our sample with the largest angular extent. To explore its properties further, we present in Figure 4 a CLEAN image of the star made after subtraction of the best-fitting uniform elliptical disk model from the observed visibilities. The residual image reveals an oversubtraction across the nominal stellar disk (deisgnated by a red ellipse), leaving a clumpy, ring-like distribution of negative residuals (10–12) visible around the periphery of the star. Outside of this there is a ring of positive residual emission that extends well beyond the disk radius defined by the uniform elliptical disk model. These positive residuals include three bright clumps (with significance 9–17). The individual clumps are only 1-2% of the peak brightness, and the possibility that they are spurious artifacts cannot yet be excluded. However, the overall evidence for the presence of extended emission appears to be significant and cannot readily be explained by calibration or imaging artifacts.
To provide a better representation of the brightness distribution of IRC+10216, we have attempted fits using a variety of more complex models to the data. In addition to a uniform elliptical disk, each of these new models included one or more additional brightness components, including a thin elliptical ring, up to three circular or elliptical Gaussians, and/or up to three point sources.
| Comp. | E offset (mas) | N offset (mas) | (mas) | (mas) | PA (deg) | (mJy) |
|---|---|---|---|---|---|---|
| Uniform elliptical disk | 0.09 | 0.180.08 | 84.40.3 | 71.30.3 | 72.00.4 | 10.620.04 |
| Thin elliptical ring | 5.330.83 | 5.900.79 | 146.32.0 | 105.12.1 | 94.31.1 | 1.280.04 |
Note. — Quoted error bars include only the formal fitting uncertainties.
We find that a significant improvement in the quality of the fit is achieved by a model that includes just one additional brightness component, namely a geometrically thin elliptical ring. Parameters of this model are summarized in Table 6. A residual map, made after subtraction of the model from Table 6 from the IRC+10216 visibility data, is shown in Figure 5. The residuals in the map are significantly reduced relative to Figure 4, although some residual clumps visible across the disk of the star suggest that the radio surface may be intrinsically non-uniform. Despite this, we find that the addition of one or more components (point sources or Gaussians) to the elliptical disk+ring model provides only marginal improvement in the residuals while increasing the number of free parameters. We conclude that the star likely has a mottled surface, but based on the present data we cannot uniquely model it with a small number of brightness components.
For the simple two-component model presented in Table 6, all parameters were allowed to vary freely. Despite this, we find that all of the parameters of the uniform elliptical disk in this revised model (with the exception of the flux density) agree to within uncertainties with the original disk-only model fit presented in Table 5. (As we are interested in relative quantities, we ignore here the contribution of absolute flux calibration uncertainty and various systematic effects to the error budget).
The two-component model that we find to well represent the brightness distribution of IRC+10216 is qualitatively similar to the one recently derived for the red supergiant Betelgeuse by O’Gorman et al. (2017) using 338 GHz observations from ALMA, although for Betelgeuse, one circular and one elliptical Gaussian component were also included in the published model. For both stars the “ring” comprises 10% of the total combined flux of the disk+ring, although in the case of IRC+10216, the ratio of the major axis diameter of the elliptical ring to the disk is larger than the Betelgeuse case (1.7 compared to 1.2). The latter difference may be a consequence of the different wavelength bands used for the respective measurements, but may also reflect an intrinsic difference between the structure and temperature profile of the radio-emitting atmospheres of the two stars.
We exclude contamination from line emission as a likely explanation for the “ring” component to the IRC+10216 atmosphere. While IRC+10216 is known to exhibit weak, thermally excited (i.e., non-masing) line emission from various molecules within our observing band, including HC3N (Chau et al. 2012), the HC3N emission is expected to arise predominately from the circumstellar envelope at distances of hundreds of AU from the star (Claussen et al. 2011), and we find no evidence for any line emission detected in our VLA data set. Furthermore, we have confirmed that evidence for the “ring” persists across our entire 8 GHz observing band. Additional resolved imaging of ultra-high-luminosity red giants is needed to test whether this property is common among such stars.
O’Gorman et al. (2017) argued that in the case of Betelgeuse, the presence of the ring cannot be attributed to limb-brightening because it is not located near the limb of the main disk. A similar argument applies to IRC+10216. One possible alternative is that the ring comprises gas elevated beyond the nominal radio photosphere by giant convective cells (e.g., Lim et al. 1998). We also note the models of Freytag et al. (2017) predict that the coolest and most luminous AGB stars should have increasingly ill-defined “surfaces” (cf. their Figure 8), and the amorphous and extended appearance of IRC+10216’s photosphere at 7 mm wavelengths qualitatively resembles their model predictions for a star with .
5.4.2 Results of Sparse Model Imaging
The model fits to the visibility data for our sample stars reveal indications of departures from uniform brightness models (Section 5.4.1). However, because the stars are only marginally resolved by the VLA at 7 mm wavelengths, it is difficult to quantitatively characterize these deviations in the - plane, and more complex models are generally not well-constrained (with the exception of IRC+10216; see above). Furthermore, it is challenging to identify signatures of possible non-uniformities in the image plane. This stems from a combination of the relatively low contrast of these expected features (10-20% contrast relative to the background; e.g., Freytag et al. 2017; Paladini et al. 2018) and the need to distinguish real features from artifacts caused by the limited - sampling or other limitations inherent to the CLEAN imaging algorithm (see, e.g., Cornwell, Braun, & Briggs 1999; Akiyama et al. 2017a,b).
The CLEAN deconvolved image data presented in Figure 2, produced using Briggs weighting with robustness =0, are adequate for displaying the overall shapes of the stellar isophotes and their degree of ellipticity, but these images do not readily enable identification of possible stellar surface features (e.g., spots or cool regions) or brightness asymmetries. A CLEAN deconvolution using uniform weighting (essentially equivalent to Briggs weighting with ) can produce images with a slightly improved ( 20%) angular resolution, but at the cost of higher image noise, reduced surface brightness sensitivity, and a more complex dirty beam pattern (Briggs, Schwab, & Sramek 1999), all of which degrade the overall image fidelity.


One alternative strategy is to impose a modest degree of “super-resolution”, through the use of a CLEAN restoring beam whose FWHM is smaller than the FWHM of the dirty beam. Following Fish et al. (2016) we define super-resolution as , where is the maximum baseline length of the interferometer and . However, higher levels of super-resolution in CLEAN (1) may produce spurious clumps and undesirable image artifacts (e.g., Akiyama et al. 2017a,b), particularly in cases where the dirty beam is highly elliptical (e.g., as is the case for W Hya) or has significant sidelobes (Fish et al.).
To circumvent these issues, we employ a new imaging technique known as sparse modeling (Honma et al. 2014), in which images are computed directly by solving the observing equation with convex regularization functions (see Honma et al. 2014 and Akiyama et al. 2017a for details). In typical radio interferometric data sets, the sampling of the - plane is often highly incomplete, making image reconstruction an under-determined problem (Honma et al.). Standard radio interferometric imaging techniques, such as CLEAN, compensate by using “zero padding” to replace unsampled grid points in the - plane and to infer the solution using the inverse Fourier transformed image (the so-called “dirty residual map”). However, this results in degradation of the shape of the beam and an increase in sidelobe levels. The sparse modeling approach instead can derive a unique solution from an infinite number of possible images by utilizing a convex sparse regularization function. The latest algorithm utilizes two convex regularization function of the brightness distribution, its -norm and Total Variation (TV) [or the improved variant Total Squared Variation (TSV)]. These regularizers penalize sparsity in the brightness distribution and its gradient, respectively (Akiyama et al. 2017a,b; Kuramochi et al. 2018). This technique can be used to achieve resolutions as high as 30% of the diffraction limit while maintaining image fidelity.
Using the latest sparse modeling code implementation of Kuramochi et al. (2018), we reconstructed images using +TSV regularization (Kuramochi et al.) and the MFISTA algorithm described in Akiyama et al. (2017a). We computed a grid of 16 images for each of our sample stars, spanning a range of four values for the regularization parameters =[10, 1, 0.1, 0.01] for -norm and =[1e6, 1e5, 1e4, 1e3] for TSV, respectively (see Kuramochi et al. for a definition of these parameters). We adopted a field-of-view of 260 mas with a 100100 pixel gridding. For each star, we also created additional grids of images from model - data representing the best-fitting uniform elliptical disk model to the visibility data (see Table 4), both with and without the addition of realistic Gaussian noise. These model data were generated using the AIPS tasks OMFIT and UVMOD.
To determine the best image, we use a combination of the “leave-one-out” cross-validation errors (LOOE; Obuchi & Kabashima 2016; Obuchi et al. 2017) and a visual comparison between the sparse model stellar images and the corresponding sparse model elliptical disk images for each value of and . When LOOE is large, the data and the elliptical disk models are virtually indistinguishable (i.e., the images are not significantly super-resolved). On the other hand, attempting to over-resolve the data can lead to spurious image artifacts despite small LOOE values. However, because these artifacts tend to appear nearly identical in both the real images and the uniform elliptical disk images, such images can be readily rejected as providing a poor representation of the true source brightness distribution.
Based on the application of the above criteria, we present in Figure 6 our best sparse model images for each of the four program stars. In each case, we also show the corresponding uniform elliptical disk model image, with and without noise. For R Leo, our images appear to reveal a clear asymmetry in the radio photosphere. W Hya and Cyg also exhibit subtle deviations from a purely symmetric shape, and for Cyg we see that the uniform elliptical disk fit over-predicts the intensity near the center of the star (see also Figure 1). For IRC+10216, a uniform elliptical disk model predicts a flatter intensity gradient across the star than observed, consistent with the negative residual seen in the IRC+10216 CLEAN image shown in Figure 4 and with the radial intensity cuts shown in Figure 1).
The degree of super-resolution that we are able to achieve for each star varies depending on the SNR as well as the - coverage and other factors that will be explored in future work. For IRC+10216, we obtain only a marginal improvement in resolution over CLEAN (97% of the diffraction limit), but results are significantly better for R Leo, W Hya, and Cyg, where we achieve images with 75%, 60%, and 55% of the diffraction limit, respectively. These preliminary results suggest that sparse model imaging algorithm appears to be a promising tool for aiding in the interpretation of stellar imaging data at radio and millimeter wavelengths.
6. Summary
We have used the JVLA to image the radio photospheres of four nearby, long-period variable stars at 7 mm wavelengths. Through fits to the visibility data we find that all four stars are clearly resolved and exhibit shapes that range from nearly spherical to an ellipticity of 0.17.
A comparison to measurements taken during previous observational epochs several years earlier shows that in all cases some of the photospheric properties (mean diameter, shape, orientation, and/or flux density) appear to have changed with time. These secular changes help to rule out several possible causes for the non-spherical shapes of radio photospheres, including tidal effects, magnetic fields, or binary companions. Instead, the most probable explanation for these shapes appears to be manifestations of large-scale convective flows and/or pulsation.
We have shown that the sparse modeling imaging technique provides a means to achieve a modest degree of super-resolution in the images of radio photospheres obtained with the VLA. Sparse model images for the four program stars provide further evidence for irregular photospheric shapes and non-uniform brightnesses across the radio surfaces. Sparse model imaging thus appears to be a promising new tool for aiding the interpretation of stellar imaging data at radio and (sub)millimeter wavelengths.
The radio photosphere of the carbon star IRC+10216 has a diameter nearly twice as large as that of the other three M- and S-type stars in our sample. Based on fits to the real and imaginary parts of the visibilities, IRC+10216 also exhibits a pronounced deviation from a pure uniform elliptical disk. The data can be well-fitted by a combination of a uniform elliptical disk plus a more extended component (modeled as a ring-like structure) comprising 10% of the total flux.
As described in the Appendix, our JVLA observations of IRC+10216 also permit a new measurement of the star’s proper motion. Our results are in agreement with previous values obtained from radio wavelength measurements and do not support recent claims of observable astrometric signatures from a binary companion.
Appendix A The Absolute Position and Proper Motion of IRC+10216
As described in Section 4.2, the use of self-calibration on the stellar line emission to improve calibration of the complex gains precludes measuring the absolute position of three of our target stars. However, the calibration technique adopted for IRC+10216 preserves the absolute positional information, enabling a measurement of the proper motion of the star.
To measure the absolute position of IRC+10216, we produced a CLEAN image of the star with the same parameters as given in Table 4, but without applying any a priori positional shifts. This image was then fitted with a single-component Gaussian using the AIPS task JMFIT, yielding the position quoted in Table 1. Following M12, we estimate uncertainties of 10 mas in both the RA and DEC coordinates.
The first constraints on the proper motion of IRC+10216 were obtained by Becklin et al. (1969), who obtained upper limits of 30 mas yr-1 by using a comparison between their own measurement on a red-sensitive photographic plate (epoch 1969.274) with another from a 1954 Palomar Sky Survey plate. Using radio wavelength measurements, Menten et al. (2006) and M12 subsequently confirmed a proper motion of the star toward a northeasterly direction.
More recently, Sozzetti et al. (2017) reported astrometric measurements of IRC+10216 based on archival (1995-2001) -band (800 nm) data. They found an east-west component of the proper motion, , comparable to within uncertainties with that derived by M12, but reported a significantly different north-south component, , and postulated that this difference may be due to the effects of a binary companion and its so-called variability-induced motion (VIM) on the apparent motion of the star.
Figure 7 presents the previous proper motion measurements of IRC+10216 from Becklin et al. (1969), Menten et al. (2006), and M12, along with a measurement from our current data. We adopt the convention that offsets to the east and to the north are positive, and following M12, we take 1987.419 as the reference epoch. The lines on the figure represent weighted least-squares fits to the and offsets, respectively, of the combined data. From this we find a proper motion of (, )=(33.840.7, 10.00.7) mas yr-1. These values agree with the determination of M12 to within uncertainties. Our determination also agrees with Sozzetti et al. (2017), but we find significant disagreement in the component of motion, where the latter authors report =30.222.02 mas yr-1 based on a single-star fit to the data and =25.431.69 mas yr-1 based on a “VIM+acceleration” model, intended to account from perturbations from a suspected binary companion. A possible explanation for this discrepancy in the component of motion is that the 800 nm data analyzed by Sozzetti et al. are not sampling the stellar photosphere, but instead material in the circumstellar envelope whose emission morphology observed at optical and infrared wavelengths is known to exhibit temporal changes unrelated to orbital motions (Osterbart et al. 2000; Stewart et al. 2016).
The time elapsed between our recent measurement and the previous high-precision radio measurement of M12 (8 yr) is slightly larger than the time span of the measurements presented by Sozzetti et al. (2017). However, we find no evidence for excursions of the motion of the star compared with an extrapolation of the data between 1969-2006. Radio measurements to date therefore show no evidence for wobble caused by a companion with a significance greater than , or 1 mas yr-1.

References
- (1) Akiyama, K., Kuramochi, K., Ikeda, S. et al. 2017a, ApJ, 838, 1
- (2) Akiyama, K., Ikeda, S., Pleau, M., et al., 2017b, AJ, 153, 159
- (3) Baudry, A., Mazurier, J. M., Perié, J. P., Requième, Y., & Rousseau, J. M. 1990, A&A, 232, 258
- (4) Becklin, E. E., Frogel, J. A., Hyland, A. R., Kristian, J., & Neugebauer, G. 1969, ApJ, 158, L133
- (5) Briggs, D. S., Schwab, F. R., & Sramek, R. A. 1999, in Synthesis Imaging in Radio Astronomy II, edited by G. B. Taylor, C. L. Carilli, and R. A. Perley, ASP Conference Series, 180, (ASP: San Francisco), 127
- (6) Burns, D., Baldwin, J. E., Boysen, R. C. et al. 1998, MNRAS, 297, 462
- (7) Carilli, C. L. & Holdaway, M. A. 1997, VLA Scientific Memo No. 173
- (8) Chau, W., Zhang, Y., Nakashima, J.-I., Deguchi, S., & Kwok, S. 2012, ApJ, 760, 66
- (9) Claussen, M. J., Sjouwerman, L. O., Rupen, M. P., Olofsson, H., Schöier, F. L., Bergman, P., & Knapp, G. R. 2011, ApJL, 739, L5
- (10) Cohen, M. 1979, MNRAS, 186, 837
- (11) Condon, J. J. 1997, PASP, 109, 166
- (12) Cornwell, T., Braun, R., & Briggs, D. S. 1999, in Synthesis Imaging in Radio Astronomy II, edited by G. B. Taylor, C. L. Carilli, and R. A. Perley, ASP Conf. Series, (ASP: San Francisco), 180, 151
- (13) Cotton, W. D. 2008, PASP, 120, 439
- (14) Feast, M. W., Glass, I. S., Whitelock, P. A., & Catchpole, R. M. 1989, MNRAS, 241, 375
- (15) Fedele, D., Wittkowski, M., Paresce, F., Scholz, M., Wood, P. R., & Ciroi, S. 2005, A&A, 431, 1019
- (16) Fish, V. L., Akiyama, K., Bouman, K. L., et al. 2016, Galaxies, 4, 54
- (17) Freytag, B. & Höfner, S. 2008, A&A, 483, 571
- (18) Freytag, B., Liljegren, S., & Höfner, S. 2017, A&A, 600, 137
- (19) Greisen, E. W. 2003, Information Handling in Astronomy—Historical Vistas, ed. A. Heck (Dordrecht: Kluwer), 109
- (20) Haniff, C. A., Scholz, M., & Tuthill, P. G. 1995, MNRAS, 276, 640
- (21) Honma, M., Akiyama, K., Uemura, M., & Ikeda, S. 2014, PASJ, 66, 95
- (22) Huggins, P. J., Mauron, N., & Wirth, E. A. 1990, MNRAS, 396, 1805
- (23) Ireland, M. J., Tuthill, P. G., Bedding, T. R., Robertson, J. G., & Jacob, A. P. 2014, MNRAS, 350, 365
- (24) Kuramochi, K., Akiyama, K., Ideda, S., et al. 2018, ApJ, in press, arXiv:1802.05783
- (25) Lacour, S., Thiébaut, E., Perrin, G., et al. 2009, ApJ, 707, 632
- (26) Lattanzi, M. G., Munari, U., Whitelock, P. A., & Feast, M. W. 1997, ApJ, 485, 328
- (27) Lim, J., Carilli, C. L., White, S. M., Beasley, A. J., & Marson, R. G. 1998, Nature, 392, 575
- (28) Livio, M. 1994, in Theory of Accretion Disks - 2, edited by W. J. Duschl, J. Frank, F. Meyer, E. Meyer-Hofmeister, and W. M. Tscharnuter, NATO Advanced Science Institutes Series C, 417, 411
- (29) Matthews, L. D. & Karovska, M. 2006, ApJ, 637, L49
- (30) Matthews, L. D., Reid, M. J., & Menten, K. M. 2015, ApJ, 808, 36
- (31) Mennesson, B., Perrin, G., Chagnon, G., et al. 2002, ApJ, 579, 446
- (32) Menten, K. M., Reid, M. J., Kamiński, T., & Claussen, M. J. 2012, A&A, 543, 73 (M12)
- (33) Menten, K. M., Reid, M. J., Krügel, E., Claussen, M. J., & Sahai, R. 2006, A&A, 453, 301
- (34) Monnier, J. D., Millan-Gabet, R., Tuthill, P. G., et al., 2004, ApJ, 605, 436
- (35) Obuchi, T., Ikeda, S., Akiyama, K., & Kabashima, Y. 2017, PLoSO, 12, id. 0188012
- (36) Obuchi, T. & Kabashima, Y. 2016, JSMTE, 5, 3304
- (37) O’Gorman, E., Harper, G. M., Brown, A., Guinan, E. F., Richards, A. M. S., Vlemmings, W., & Wasatonic, R. 2015, A&A, 580, A101
- (38) O’Gorman, E., Kervella, P., Harper, G. M., Richards, A. M. S., Decin, L., Montargès, M., & McDonald, I. 2017, A&A, 602, L10
- (39) Osterbart, R., Balega, Y. Y., Blöcker, T., Men’shchikov, A. B., & Weigelt, G. 2000, A&A, 357, 169
- (40) Paladini, C., Baron, F., Jorissen, A., et al. 2018, Natur, 553, 310
- (41) Paladini, C., Klotz, D., Sacuto, S., et al., 2017, A&A, 600, A136
- (42) Perley, R. A. & Taylor, G. B. 2003, VLA Calibration Manual
- (43) (http://www.vla.nrao.edu/astro/calib/manual/index.shtml)
- (44) Perley, R. A. & Butler, B. J. 2013, ApJS, 204, 19
- (45) Perrin, G., Coudé du Foresto, V., Ridgway, S. T., Mennesson, B., Ruilier, C., Mariotti, J.-M., Traub, W. A., & Lacasse, M. G. 1999, A&A, 345, 221
- (46) Perrin, G., Ridgway, S. T., Mennesson, B., et al. 2004, A&A, 426, 279
- (47) Reid, M. J. & Goldston, J. E. 2002, ApJ, 568, 931
- (48) Reid, M. J. & Menten, K. M. 1990, ApJ, 360, L51
- (49) Reid, M. J. & Menten, K. M. 1997, ApJ, 476, 327 (RM97)
- (50) Reid, M. J. & Menten, K. M. 2007, ApJ, 671, 2068 (RM07)
- (51) Schwarzschild, M. 1975, 195, 137
- (52) Shenavrin, V. I., Taranova, O. G., & Nadzhip, A. E. 2011, ARep, 55, 31
- (53) Skinner, C. J., Meixner, M., & Bobrowsky, M. 1998, MNRAS, 300, 29
- (54) Smith, B. J., Price, S. D., & Moffett, A. J. 2006, AJ, 131, 612
- (55) Sozzetti, A., Smart, R. L., Drimmel, R., Giacobbe, P., & Lattanzi, M. G. 2017, MNRAS, 471, L1
- (56) Stello, D., Compton, D. L., Bedding, T. R. et al. 2014, ApJ, 788, L10
- (57) Stewart, P. N., Tuthill, P. G., Monnier, J. D., Ireland, M. J., Hedman, M. M., Nicholson, P. D., & Lacour, S. 2016, MNRAS, 455, 3102
- (58) Szymczak, M., Cohen, R. J., & Richards, A. M. S. 1998, MNRAS, 297, 1151
- (59) Tsuji, T. 2000, ApJ, 540, L99
- (60) Tsuji, T. 2001, in Galaxies and their Constituents at the Highest Angular Resolutions, IAU Symposium 205, edited by R. T. Schilizzi, 316
- (61) Tsuji, T. 2008, A&A, 489, 1271
- (62) Tuthill, P. G., Haniff, C. A., Baldwin, J. E., & Feast, M. W. 1994, MNRAS, 266, 745
- (63) van Leeuwen, F. 2007, A&A, 474, 653
- (64) Vlemmings, W. H. T., Humphreys, E. M. L., & Franco-Hernández, R. 2011, ApJ, 728, 149
- (65) Vlemmings, W., Khouri, T., O’Gorman, E., De Beck, E., Humphreys, E., Lankhaar, B., Maercker, M., Olofsson, H., Ramstedt, S., Tafoya, D., & Takigawa, A. 2017, NatA, 1, 848
- (66) Vlemmings, W. H. T., Ramstedt, S., O’Gorman, E., Humphreys, E. M. L., Wittkowski, M., Baudry, A., & Karovska, M. 2015, A&A, L4
- (67) Wittkowski, M., Chiavassa, A., Freytag, B., Scholz, M., Höfner, S., Karovicova, I., & Whitelock, P. A. 2016, A&A, 587, A12
- (68) Woitke, P. 2006, A&A, 452, 537
- (69) Wong, K. T., Kamiński, T., Menten, K. M., & Wyrowski, F. 2016, A&A, 590, 127
- (70) Wood, P. R. 2015, MNRAS, 448, 3829
- (71) Young, J. S., Baldwin, J. E., Boysen, R. C., et al. 2000, MNRAS, 318, 381
- (72) Zhao-Geisler, R., Köhler, R., Kemper, F., Kerschbaum, F., Mayer, A., Quirrenbach, A., & Lopez, B. 2015, PASP, 127, 732
- (73) Zhao-Geisler, R., Quirrenbach, A., Köhler, R., Lopez, B., & Leinert, C. 2011, A&A, 530, A120
- (74)