Sun’s Seismic Radius as Measured from the Fundamental Modes of Oscillations and its Implications for the TSI Variations
Abstract
In this letter, we explore the relationship between the solar seismic radius and total solar irradiance (TSI) during last two solar cycles using the uninterrupted data from space-borne instruments onboard SoHO and SDO. The seismic radius is calculated from the fundamental (f) modes of solar oscillations utilizing the observations from SoHO/MDI and SDO/HMI, and the total solar irradiance measurements are obtained from SoHO/VIRGO. Our study suggests that the major contribution to the TSI variation arises from the changes in magnetic field while the radius variation plays a secondary role. We find that the solar irradiance increases with decreasing seismic radius, however the anti-correlation between them is moderately weak. The estimated maximum change in seismic radius during a solar cycle is about 5 kilometers, and is consistent in both solar cycles 23 and 24. Previous studies suggest a radius change at the surface of the order of 0.06 arcsecond to explain the 0.1% variation in the TSI values during the solar cycle, however our inferred seismic radius change is significantly smaller, hence the TSI variations can not be fully explained by the temporal changes in seismic radius.
1 Introduction
The solar radius is one of the most fundamental parameters for the precise understanding of Sun’s properties. Its accurate measurement is important for determining the Sun’s composition, structure as well as the rotation rate (Bahcall et al., 2001). Radius measurements at different wavelengths further enable a better understanding of the solar atmosphere (Thuillier et al., 2017; Menezes & Valio, 2017). Several authors have investigated the possible relationship between the variability of solar radius and the total energy output or total solar irradiance (TSI) (Sofia et al., 1979; Fröhlich & Eddy, 1984; Pap et al., 2001). It is well known that the ultimate source of solar energy is nuclear reactions taking place in the center of the Sun and the rate of these reactions is almost constant on the time scales of millions of years. On the other hand, TSI measurements from space clearly show variability on a time scale of minutes to a 11-year solar cycle, thus there would be some intermediate factors that are responsible for both relatively shorter and longer time-scale. It is suggested that the solar radius variation could be one of the factors that might be responsible for the TSI variation, thus the time-dependent radius measurements should be considered while modeling the TSI variability. In order to quantify the relation between them, Sofia (1998) argued that 0.1% change in TSI could be explained by the radius change of 0.06 arcsecond.
In general, two terms are in use for the solar radius; the physical or true radius and the seismic or acoustic radius. While the former has records dating back to 18th century (Vaquero et al., 2016, and references therein), the concept of seismic radius is only a couple of decades old (Schou et al., 1997). The measurements of physical radius are primarily made using solar limb measurements during planetary transits or the solar disk occultation; however its precise value is still a matter of debate with differences of several tenths of an arcsecond (e.g., Emilio et al., 2015; Rozelot et al., 2015, and references therein). These differences are mainly attributed to the type of measurement techniques and the instrument calibration. Similar to physical radius, the seismic radius measurements also vary marginally with the analysis method.
The seismic radius is determined by calibrating the radius in a solar model to match the observed frequencies. Hence, it gives the value at a layer that defines the surface in the Solar model. Several authors used solar models to estimate the true radius and obtained much smaller values (Brown & Christensen-Dalsgaard, 1998; Antia, 1998; Tripathy & Antia, 1999). In addition, the near-surface uncertainties in the solar models also contribute to different values. Analytically, it is estimated from the solar oscillation data by applying different methods. In most studies, the global frequencies of surface-gravity or fundamental (f) modes are used to quantify the values of seismic radius (Schou et al., 1997; Antia et al., 2000; Dziembowski et al., 2001; Antia & Basu, 2004; Dziembowski & Goode, 2005). It was suggested that the f-mode frequencies are modified by the changes in both magnetic field and the solar seismic radius. Since the change in seismic radius is estimated assuming that the fractional change in radius is uniform in the range of sensitivity of the method, its value corresponds to the change at a radius where the f modes are concentrated. Although most of the studies were mainly aimed at determining the precise value of the solar radius, the obtained values were significantly smaller than the true radius. While abovementioned studies primarily utilized modes in the intermediate-degree range, Kholikov & Hill (2008) analyzed spherical harmonic coefficient time series of low-degree p modes in the range = 0 – 3 and calculated autocorrelation function to infer the acoustic radius. González Hernández et al. (2009) exploited the method of acoustic holography and analyzed the propagation of wave packets to infer the variation in seismic radius in cycle 23 by applying the technique of acoustic holography. Although these studies provide different quantative estimates of change in the seismic radius with time, they converge to a single conclusion that its variation is anti correlated with the phase of the solar cycle. Moreover, some of these studies exclude the effect of strong magnetic field in the determination of seismic radius and hence display a strong negative correlation between seismic radius and the solar activity.
Our aim in this paper is to study the temporal variation in seismic radius during last two solar cycles as determined by the f-mode frequencies. It is well accepted that the seismic radius measurements obtained from f modes do not represent the true solar radius but provide its value at a depth of several megameters below the photosphere. Here we discuss the relative variation of the seismic radius instead of its true value. We must emphasize that these variations represent the changes in the thermal structure of upper convection zone only. We further compare the seismic radius changes with the variation in TSI. The paper is organized as follows: we briefly describe data and the method in Section 2. The results are discussed in Section 3 followed by a summary in Section 4.
2 Data and Analysis
2.1 Time series of mode frequencies
We use f-mode frequencies in the spherical harmonic degree 300 from the medium- program of Solar and Heliospheric Observatory (SoHO)/Michelson Doppler Imager (MDI; Scherrer et al., 1995) and Solar Dynamics Observatory (SDO)/Helioseismic and Magnetic Imager (HMI; Scherrer et al., 2012), covering a period of about 21 years, i.e. nearly two solar cycles (23 – 24), starting from mid 1996 to mid 2017. In total, 74 MDI (May 1, 1996 – April 24, 2011) and 36 HMI (April 30, 2010 – June 3, 2017) data sets are used. Note that there are 5 overlapping sets between MDI and HMI from April 30, 2010 to April 24, 2011. Each data set is produced from 72 day long time series and the frequency table consists of centroid frequencies and splitting coefficients where each multiplet is represented by a polynomial expansion
| (1) |
where ’s are orthogonal polynomials of degree and is the number of coefficients used in determining frequencies. In this paper, we use frequency tables for = 18. The remaining symbols in equation (1) have their usual meanings. Note that the frequencies from both the instruments were calculated by using the same approach, hence these are not biased by any computational method. Since we are interested in f-mode frequencies, we analyze = 0 modes only.
It is worth mentioning that the historic fits to the MDI data suffered from an artificially introduced 1-year periodicity due to the orbital period of the Earth (Schou et al., 2002). In this work, we use improved frequency data from MDI (Larson & Schou, 2015, 2018), which include improvements in a number of geometric corrections made during spherical harmonic decomposition; updated routines for generating window functions, detrending time series, filling gaps; horizontal displacement at the solar surface, and distortion of eigenfunctions by differential rotation (Larson & Schou, 2015). As a result, the periodicity in the historic MDI f-mode frequencies (e.g., discussed in Jain & Bhatnagar, 2003) has been attenuated significantly in the improved frequencies, which are used in this paper.
2.1.1 Combining time series from SoHO/MDI and SDO/HMI
Since both MDI and HMI do not cover the period of two solar cycles independently, one of the major tasks in this study is to combine frequency data from two missions, which use different spectral lines in the solar photosphere. The MDI observations are in the Ni I 6768 Å line as opposed to HMI observations in Fe I 6173 Å line; the formation height of Fe I line is lower in atmosphere than the Ni I line. While mode amplitudes tend to decrease with increasing height, the oscillation frequencies and life-time of the modes are independent of the spectral line used in observations (Jain et al., 2006). Although the same peak-bagging method is used to calculate the frequencies from both missions, different instruments may also introduce some instrument-related bias. Thus, it is important to examine the differences between mode frequencies from both missions. For this purpose, we use 5 overlapping 72-d sets from MDI and HMI covering the observation for about a year, i.e., from mid-2010 to mid-2011. Each set is represented by a unique data set identifier number, which corresponds to the day number relative to the MDI epoch of 1993 Jan 1 00:00:00_TAI.
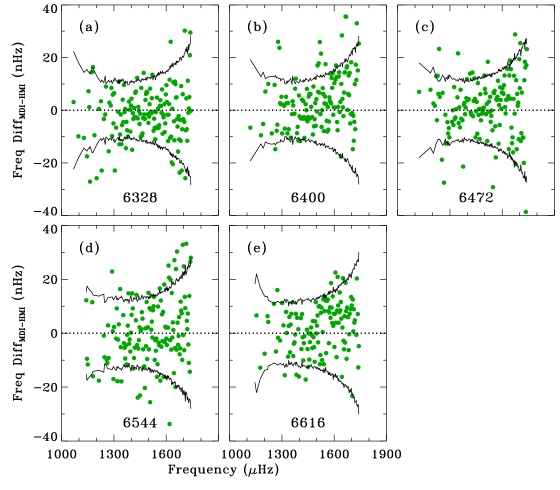
The frequency differences for individual modes in all five sets are shown in Figure 1 (a – e). In each case, it is seen that the difference in frequencies (shown by symbols) for most modes are less than the mean error (shown by solid lines). The mean frequency shifts with reference to the average frequency of 112 modes available in all 10 data sets are plotted in Figure 1(f). It is evident that there are small differences in the mean shifts for individual epochs, however majority of these lie within 1 error. This close agreement between frequencies from simultaneous observations from both missions allows us to combine two data series to form an uninterrupted long data series for about two solar cycles. Since duty cycles for the gap-filled timeseries of HMI were higher than the MDI, we prefer to use HMI frequencies for the overlapping period. Hence the MDI frequencies for the period 1996 May 1 – 2010 April 29 and the HMI frequencies from 2010 April 30 to 2017 June 3 are used in this study.
2.2 Seismic solar radius and the TSI time series
The variation in seismic radius with time is estimated from the following relation (Dziembowski et al., 2001),
| (2) |
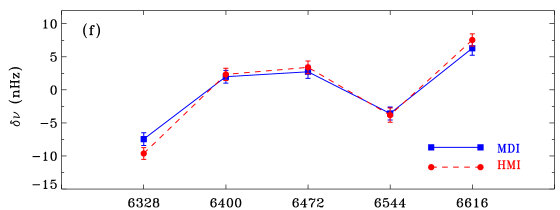
where is the change in seismic radius inferred from a set of modes and measures the contribution from surface term. The first term on the right represents the radius contribution () and the second term is surface contribution (). The mode inertia, , used here is taken from the standard solar model ‘BS05’ (Bahcall & Serenelli, 2005). The values of and for each epoch are obtained using the least-square method applied to Equation 2. Since each mode is trapped at a different layer (e.g., Sofia et al., 2005), the estimation of seismic radius depends on the choice of modes. Thus, we use 72 f modes in the range of 216 to 299 which are present in all epochs. This criterion of selecting modes is important to infer the true variation in mean seismic radius in all data sets. The temporal variation of calculated average fractional frequency shifts, , is plotted in Figure 2(a). It is evident that a 1-year periodicity still exists in frequency timeseries, hence it is removed from the timeseries of each mode before fitting Equation 2 for each epoch. The estimated , and the per degree of freedom in Figures 2(b), 2(c) and 2(d), respectively. The values fluctuate around 0.2 for all epochs (except near edges due to smoothing) indicating that there are some uncertainties involved in the fitting of Equation 2 and these are comparable for both instruments. We have also shown the scaled variations of 10.7 cm radio flux (; Tapping, 2013), a proxy for magnetic field, and the TSI from SoHO/VIRGO (Fröhlich et al., 1997) in panels (b) and (c), respectively.
3 Results and Discussion
It is clear from Figure 2(a – b), both and vary in phase with the solar activity while , as shown in Figure 2(c), is in anti-phase. Although the solar irradiance increases with decreasing seismic radius or the seismic radius shrinks with increasing magnetic activity, the anti-correlation between them is moderately weak. The shrinkage is believed to be caused by an increase in the radial components of small scale-magnetic field located a few megameters below the surface while depends on a variety of contributions from the near-surface layers. We checked the strength of this correlation/anti-correlation by calculating the Pearson’s linear correlation coefficient, ; 0.99 between and , 0.99 between and , and 0.55 between and TSI. These results are in qualitative agreement with the previous studies (Dziembowski et al., 2001; Antia & Basu, 2004). It should be noted that previous studies were based on the MDI frequencies for first few years of cycle 23 only with a strong 1-year periodicity. The contributions from and to are plotted in Figure 3 (left) for selected epochs; two for MDI and two for HMI. It is evident that largely depends on while has a little contribution. In right panels, we show the variation of measured and calculated values of , the difference between them. In all cases, we see an increase in with , which also increases values.
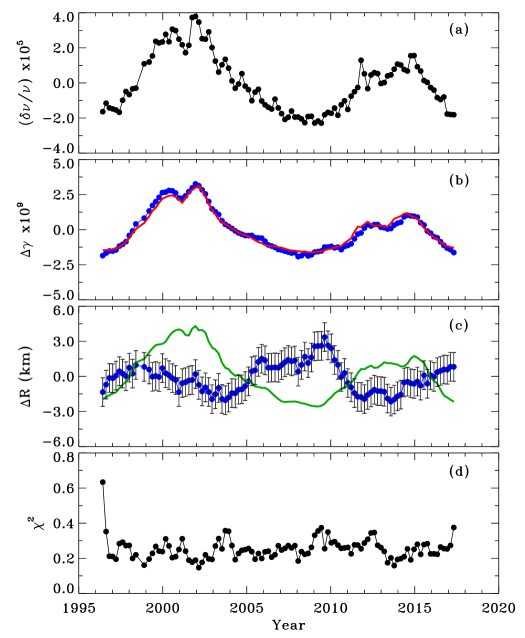
In order to quantify the relation between and TSI, we display the change in TSI (TSI) from its minimum value as a function of corresponding change in the seismic radius in Figure 4. The anti-correlation between these two quantities is clearly visible, however the scatter is significantly large for cycle 23 while there is a systematic trend in cycle 24. These findings are confirmed by calculating , which increases from 0.51 for cycle 23 to 0.83 for cycle 24. This indicates that the relationship between and TSI was weak in cycle 23. Note that the solar activity in cycle 24 is significantly reduced as compared to cycle 23 and the TSI increased by 0.075% from the activity minimum to the maximum. The robustness of the TSI variation per unit change in seismic radius is checked by fitting a straight line. The best-fit line is obtained by minimizing the chi-square error statistics. The value for cycle 24 (0.79) is significantly smaller than that for cycle 23 (8.17) while for all data sets the is 9.71. This again suggests that and TSI had a stable relation in cycle 24. Further for the 0.1% TSI increase from minimum to maximum in an average solar cycle, the corresponding change in the seismic radius is about 10 km. This is estimated from the best fit values for cycle 24. The reason for poor correspondence between and TSI in cycle 23 is not clear.
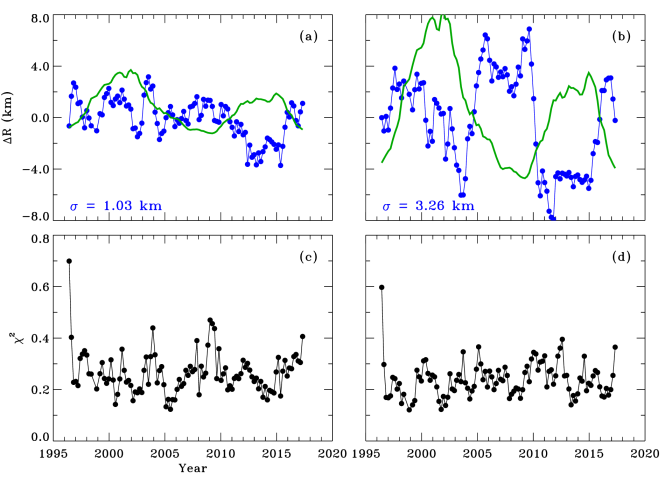
It was suggested by Sofia et al. (2005) that the seismic radius change in shallower layer should be larger than that in the deeper layer. Note that we are here analyzing depths within a few megameters below the photosphere. In order to verify the argument by Sofia et al., we repeated the analysis for f-modes in two different frequency ranges. The modes in low- range (1480 Hz 1630 Hz) travel relatively deeper than the modes in high- range (1630 Hz 1740 Hz). To maintain consistency we ensured that both frequency ranges cover same number of modes; i.e., 36. The temporal variations of in these frequency ranges are displayed in Figure 5. One can easily visualize that R in Figure 5(b) is larger than in Figure 5(a). For low- range, the correlation coefficients are and corresponding to cycles 23 and 24, respectively, and these values changed to and for high- range. This again suggests that the TSI variability had a consistent trend with seismic radius in cycle 24. The standard deviation, , for low- and high- ranges are 1.03 km and 3.26 km, respectively and the maximum variation in both cases is about 2.5. The values plotted in lower panels of Figure 5 further indicate that the goodness of fit is not very different in both cases.
In order to calculate radius change very close to the surface, one has to use very high- modes, however the helioseismic analysis using global modes, at present, has limitations for such studies. It needs to be improved to characterize mode parameters at high degrees because the ridges in – diagrams are not well separated and mode widths are also large (Korzennik et al., 2013). There are ongoing efforts on the ridge-fitting approach over the traditional mode-fitting method and we hope to extend this analysis to higher degrees with different mode sets. It must be emphasized that the change in seismic radius may be caused by the variation of sound speed, temperature or the changes in the superadiabatic superficial layers. Dziembowski & Goode (2005) have argued that the decrease in turbulent pressure or temperature with increasing magnetic activity, or both effects may cause shrinking. Furthermore, based on a model of variability of the solar interior with all observational constraints, Sofia et al. (2005) had suggested an increase in seismic radius variation by a factor of approximately 1000 from a depth of 5 Mm to the surface, however our study based on measured frequencies do not support this. In addition, direct measurements of the solar radius at the surface also contradict this argument.
4 Summary
Based on the analysis of global f-mode frequencies from MDI and HMI, we demonstrate that the solar irradiance increases with decreasing seismic radius or the seismic radius decreases with increasing magnetic activity, however these quantities are weakly anti-correlated. We show evidence that the major contribution to the TSI variation comes from the changes in magnetic field while the radius variation plays a secondary role. It must be noted that our results provide information on the changes in thermal structure of the outer convection zone only. Although this approach does not provide a precise value of the solar radius at the surface, it is a powerful diagnostic tool to infer changes in the seismic radius at a few megameter below the surface. This can also be useful in estimating changes in turbulent pressure or temperature with the changing magnetic activity. Based on Figure 4, we estimate that the seismic radius changed by approximately five kilometers during solar cycles 23 and 24. The change in seismic radius obtained in this study is much smaller than the previous studies where authors have suggested a radius change of the order of 45 km to explain the 0.1% variation in the TSI values (Sofia, 1998).
References
- Antia (1998) Antia, H. M. 1998, A&A, 330, 336
- Antia & Basu (2004) Antia, H. M., & Basu, S. 2004, in ESA Special Publication, Vol. 559, SOHO 14 Helio- and Asteroseismology: Towards a Golden Future, ed. D. Danesy, 301
- Antia et al. (2000) Antia, H. M., Basu, S., Pintar, J., & Pohl, B. 2000, Sol. Phys., 192, 459
- Bahcall et al. (2001) Bahcall, J. N., Pinsonneault, M. H., & Basu, S. 2001, ApJ, 555, 990
- Bahcall & Serenelli (2005) Bahcall, J. N., & Serenelli, A. M. 2005, ApJ, 626, 530
- Brown & Christensen-Dalsgaard (1998) Brown, T. M., & Christensen-Dalsgaard, J. 1998, ApJ, 500, L195
- Dziembowski & Goode (2005) Dziembowski, W. A., & Goode, P. R. 2005, ApJ, 625, 548
- Dziembowski et al. (2001) Dziembowski, W. A., Goode, P. R., & Schou, J. 2001, ApJ, 553, 897
- Emilio et al. (2015) Emilio, M., Couvidat, S., Bush, R. I., Kuhn, J. R., & Scholl, I. F. 2015, ApJ, 798, 48
- Fröhlich & Eddy (1984) Fröhlich, C., & Eddy, J. A. 1984, Advances in Space Research, 4, 121
- Fröhlich et al. (1997) Fröhlich, C., Crommelynck, D. A., Wehrli, C., et al. 1997, Sol. Phys., 175, 267
- González Hernández et al. (2009) González Hernández, I., Scherrer, P., & Hill, F. 2009, ApJ, 691, L87
- Jain & Bhatnagar (2003) Jain, K., & Bhatnagar, A. 2003, Sol. Phys., 213, 257
- Jain et al. (2006) Jain, K., Hill, F., González Hernández, I., et al. 2006, in ESA Special Publication, Vol. 624, Proceedings of SOHO 18/GONG 2006/HELAS I, Beyond the spherical Sun, 127.1
- Kholikov & Hill (2008) Kholikov, S., & Hill, F. 2008, Sol. Phys., 251, 157
- Korzennik et al. (2013) Korzennik, S. G., Rabello-Soares, M. C., Schou, J., & Larson, T. P. 2013, ApJ, 772, 87
- Larson & Schou (2015) Larson, T. P., & Schou, J. 2015, Sol. Phys., 290, 3221
- Larson & Schou (2018) —. 2018, Sol. Phys., 293, 29
- Menezes & Valio (2017) Menezes, F., & Valio, A. 2017, ArXiv e-prints, arXiv:1712.06771
- Pap et al. (2001) Pap, J., Rozelot, J. P., Godier, S., & Varadi, F. 2001, A&A, 372, 1005
- Rozelot et al. (2015) Rozelot, J. P., Kosovichev, A., & Kilcik, A. 2015, ApJ, 812, 91
- Scherrer et al. (1995) Scherrer, P. H., Bogart, R. S., Bush, R. I., et al. 1995, Sol. Phys., 162, 129
- Scherrer et al. (2012) Scherrer, P. H., Schou, J., Bush, R. I., et al. 2012, Sol. Phys., 275, 207
- Schou et al. (1997) Schou, J., Kosovichev, A. G., Goode, P. R., & Dziembowski, W. A. 1997, ApJ, 489, L197
- Schou et al. (2002) Schou, J., Howe, R., Basu, S., et al. 2002, ApJ, 567, 1234
- Sofia (1998) Sofia, S. 1998, in Solar Electromagnetic Radiation Study for Solar Cycle 22, ed. J. M. Pap, C. Frohlich, & R. K. Ulrich, 413
- Sofia et al. (2005) Sofia, S., Basu, S., Demarque, P., Li, L., & Thuillier, G. 2005, ApJ, 632, L147
- Sofia et al. (1979) Sofia, S., O’keefe, J., Lesh, J. R., & Endal, A. S. 1979, Science, 204, 1306
- Tapping (2013) Tapping, K. F. 2013, Space Weather, 11, 394
- Thuillier et al. (2017) Thuillier, G., Zhu, P., Shapiro, A. I., et al. 2017, A&A, 603, A28
- Tripathy & Antia (1999) Tripathy, S. C., & Antia, H. M. 1999, Sol. Phys., 186, 1
- Vaquero et al. (2016) Vaquero, J. M., Gallego, M. C., Ruiz-Lorenzo, J. J., et al. 2016, Sol. Phys., 291, 1599