On the Nature of Localization in Ti doped Si
Abstract
Intermediate band semiconductors hold the promise to significantly improve the efficiency of solar cells, but only if the intermediate impurity band is metallic. We apply a recently developed first principles method to investigate the origin of electron localization in Ti doped Si, a promising candidate for intermediate band solar cells. Although Anderson localization is often overlooked in the context of intermediate band solar cells, our results show that in Ti doped Si it plays a more important role in the metal insulator transition than Mott localization. Implications for the theory of intermediate band solar cells are discussed.
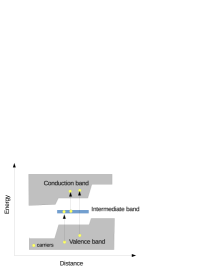
Introduction.—Intermediate-band solar cells (IBSCs) have been proposed as a candidate for the third generation of photovoltaics Luque and Martí (1997, 2010); Okada et al. (2015). Unlike conventional solar cell materials, intermediate-band photovoltaics are doped with deep-level impurities that induce a partially filled intermediate band located between the valence and the conduction band as shown in Fig. 1. This provides an extra channel for the promotion of an electron from the valence to the conduction band by absorbing two low energy photons instead of one photon with energy greater than the band gap. The extra two-photon channel leads to an increase of photocurrent without decreasing the photovoltage, which could greatly enhance the efficiency of solar cells Luque and Martí (1997).
However, the deep-level impurity band also introduces electron-hole pair recombination centers, which normally lead to the increase of nonradiative Shockley-Reed-Hall (SRH) processesShockley and Read (1952); Hall (1952) that are detrimental to the efficiency of the solar cell. When an electron or hole is captured by a deep-level impurity state the change in charge around the impurity causes local atomic displacements. According to the microscopic theory of Lang and Henry Lang and Henry (1975) these in turn strongly increase the capture cross-section of excited conduction electrons and valence holes into the intermediate band. Based on this theory, Luque et al. Luque et al. (2006) argued that if the intermediate band becomes delocalized due to a large density of impurities, the charge of the trapped electron or hole will spread out. This in turn could suppress the atomic displacements and therefore the nonradiative recombinations. Consequently, a central question is how many impurities are needed to induce an insulator-metal transition in the intermediate band. From a general perspective this question is not only relevant for the efficiency of intermediate band solar cells, but is in fact a fundamental question in condensed matter physics.
In 1977 Anderson and Mott shared one third each of the Nobel prize in physics in part for their study of the localization of electrons in semiconductors. Although they shared this Nobel prize they each had a distinct argument why the electrons become localized Anderson (1958); Mott (1968). In Mott’s model the localization of electrons, or rather the lack thereof, is controlled by the screening of the impurity potentials due to the long-range Coulomb interaction. When an impurity is isolated, it tightly traps the doped carriers. However, when the impurity concentration increases the electrons from one impurity screen the potential of a neighboring impurity thereby causing the electrons to be delocalized. We note here that Mott localization should not be confused with Mott-Hubbard localization Imada et al. (1998), in which intra-atomic Coulomb repulsion causes localization by opening a Mott gap. In Anderson’s model the localization of electrons occurs purely due to the impurities being disordered. Most studies on IBSCs consider only Mott’s criterion for localization Martí et al. (2008); Luque and Martí (2010); Luque et al. (2012); Olea et al. (2008, 2009, 2010, 2012); Sánchez et al. (2009); Gonzalez-Díaz et al. (2009); Winkler et al. (2011); Zhou et al. (2013a, b); Pastor et al. (2013); Hu et al. (2014); Dong et al. (2015); Okada et al. (2015); Flores and Menéndez-Proupin (2016); Liu et al. (2016). On the other hand Anderson localization in the context of IBSCs is examined less, either via approximate models Luque et al. (2006) or phenomenological fits Winkler et al. (2011) and rarely via first principles calculations Carnio et al. (2017). Unbiased first principles calculations that take into account the material specifics can provide a unique perspective to investigate the relative importance of these two localization mechanisms in IBSCs.
Among the intermediate band semiconductors, Si doped with elements such as Ti has the clear advantage that the host semiconductor is well studied. Moreover, experimental indications for the promise of Ti doped Si are found in electrical resistivity and carrier lifetime measurements Olea et al. (2008, 2010). However, to reach an insulator-metal transition in the intermediate band, Ti concentrations beyond the solubility regime are required and non-equilibrium crystal growing techniques need to be applied, which are challenging Antolín et al. (2009). Therefore independent first principles simulations including the effects of disorder will provide valuable guidance towards achieving high efficiency in Ti doped Si-based IBSCs.
In this letter, we systematically study the metal-insulator transition in Ti doped Si as a function of Ti concentration, by combining two recently developed techniques, the Effective Disorder Hamiltonian Method (EDHM) Berlijn et al. (2011) and the Typical Medium Dynamical Cluster Approximation (TMDCA) Ekuma et al. (2014). We explore the mobility edge separating the delocalized and localized electron states in the intermediate band, and find the critical impurity concentration of the localization transition. Moreover, by theoretically separating the effect of Mott and Anderson localization, we are able to compare these two mechanisms, and find that Anderson dominates over Mott localization in Ti doped Si.
Methods.—First principles simulations take into account the multi-orbital nature of materials and the complex non-local structure of realistic impurity potentials. However, Anderson localization is usually not investigated from first-principles because localized states can be very large and typically need to be simulated with hundreds of thousands of lattice sites Vasquez et al. (2008). To overcome the computational expense we have recently developed a method that combines the EDHM and the TMDCA to study Anderson localization from first principles Zhang et al. (2015). We have already applied this combined method to superconductors Zhang et al. (2015), dilute magnetic semiconductors Zhang et al. (2016), and here are applying it to the intermediate band semiconductor Ti doped Si. For another recent computational approach to study Anderson localization from first principles we refer to Ref. Carnio et al., 2017.
The EDHM Berlijn et al. (2011) is a Wannier function Marzari and Vanderbilt (1997); Ku et al. (2002) based method which allows to derive low-energy tight-binding models of disordered materials from DFT calculations. Specifically models of both undoped Si and a supercell with a single Ti impurity are derived in the Wannier basis functions of Si-, Si- and Ti-, and the impurity potential is captured by the difference of these two models. Experimental measurements and theoretical calculations Olea et al. (2008); Sánchez et al. (2009) have shown that the Ti dopants are mostly interstitial impurities rather than (Si,Ti) substitutions and hence we focus here on Ti interstitials. To capture the experimental band-gap of Si we apply the LDA+U approximation, which we found to compare accurately with the modified Becke-Johnson potential sup ; Tran and Blaha (2009). In this study we used three different sizes of supercells: TiSi8, TiSi64 and TiSi216 which lead to three different impurity potentials.
Next we use the low-energy tight-binding model of pure Si and the Ti impurity potentials obtained from the EDHM as input for the TMDCA. The TMDCA is a cluster extension of the typical medium theory (TMT) Dobrosavljević et al. (2003), which in turn is a modification of the coherent potential approximation (CPA) Soven (1967), where a geometric average of the local density of states (DOS): DOSDOSDOS is carried out in the impurity solver instead of the usual arithmetic average: DOSDOSDOS. Here DOSi is the DOS at a particular site in a particular disorder configuration and is the total number of sites. The resulting geometrically averaged DOS or typical density of states (TDOS) captures the physics of localization Dobrosavljević et al. (2003); Weiße et al. (2006). TDOS is finite in the delocalized phase and vanishes at the localized phase and so serves as an order parameter for the transition. Therefore, by comparing DOS and TDOS in the same plot, we are able to determine which states are localized and which are metallic. TMDCA overcomes the restrictions of the TMT and accurately predicts the critical disorder strength of the single-band Anderson model with uniform disorder Ekuma et al. (2014). In order to deal with more complicated realistic systems, the TMDCA is extended to systems with off-diagonal disorder Terletska et al. (2014) and to multi-band systems Zhang et al. (2015).
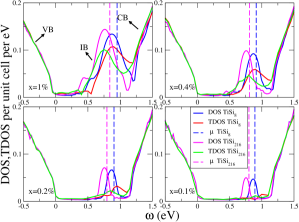
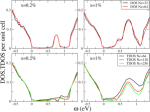
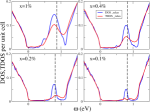
Results.—First, we derive the critical concentration for the metal insulator transition in Ti doped Si by calculating DOS and TDOS for various Ti concentrations, . We have checked convergence against various computational parameters sup . Fig. 2 displays the concentration evolution of the DOS and TDOS. The band roughly above 1.25 eV corresponds to the conduction band and the one below 0 eV is the valence band. The partially filled intermediate band appears between these two energies. Let us focus first on the results derived from the TiSi216 supercell. For the relatively large Ti concentrations, =1%, the TDOS of the impurity band is finite indicating that its states are delocalized, i.e., metallic. As the Ti concentration decreases, the TDOS of the intermediate band gradually decreases and starts to vanish at concentrations between =0.2% and =0.1% signaling the localization transition. These values correspond to a critical Ti concentration between 1.01020 cm-3 and 5.01019 cm-3, which is consistent with the available experimental results Olea et al. (2012). We have checked that neither lattice relaxation, nor spin-polarization effects change this conclusion significantly sup . Both theoretical calculations and experiments have shown that such high concentrations of Ti in Si are thermodynamically unstable Antolín et al. (2009); Sánchez et al. (2009). Hence non-equilibrium growth techniques have been employed to increase doping Antolín et al. (2009). Drawbacks of such preparation methods are inhomogeneous distribution of dopant and damage to the crystal structure. Therefore our first principles derivation of the critical concentration is a valuable benchmark. However, the theoretical derivation of the critical concentration by itself does not answer the question what causes the metal-insulator transition in Ti doped Si: is it Mott localization or Anderson localization?
To investigate the relative importance of Mott’s and Anderson’s localization mechanisms we will now explore the effects of screening in our simulation. In Mott’s original picture Mott (1968), the electronic impurity states are assumed to be localized, discrete, and bound to the impurity. As the number of impurities increases, however, the binding potential of one impurity undergoes Thomas-Fermi screening by the long-range Coulomb potentials of the electrons on the surrounding impurities. The Mott transition from insulator to metal occurs when this screening reduces the strength of the impurity potential below a critical value, squeezing the impurity state into the continuum and forming a metal. Unlike the effects of Mott-Hubbard localization caused by intra-atomic Coulomb repulsion, Mott’s model based on Thomas-Fermi screening can be captured accurately within DFT. In doped semiconductors Mott and Anderson localization are entangled Rosenbaum et al. (1983) and it is usually quite challenging to distinguish them. However, it turns out that within our EDHM+TMDCA method the separation of Mott’s and Anderson’s mechanisms is natural.
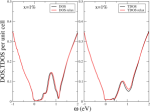
In Mott’s picture of localization, the states are pushed into the continuum due to the screening of the potential, while in Anderson localization, the states are localized due to disorder. Therefore, by tuning the strength of screening and disorder separately, we are able to distinguish the effect of Mott and Anderson localizations. In our method, the strength of disorder is tuned by the concentration of impurities in the TMDCA calculation, while the screening effect as captured by the EDHM is frozen in the impurity potential. By changing the size of the supercell used for the EDHM when deriving the impurity potential, we have a separate knob to tune the strength of the screening effect. Based on this, we derive the impurity potential from three different supercell sizes: TiSi8, TiSi64 and TiSi216. Given that the Ti concentration in the TiSi8 supercell is 27 times larger than in the TiSi216 supercell one would expect based on Mott’s mechanism a strong reduction of the impurity potential and therefore a decrease in the localization. However, as shown in Fig. 2 we distinguish no significant effect on the localization from the TMDCA based on these two impurity potentials. For each of the four disorder concentrations we see only minor changes in the DOS and TDOS for the TiSi8 and TiSi216 derived impurity potentials. The relative difference between the DOS and TDOS is much more sensitive to changes in disorder than to the changes in the screening. The DOS and TDOS vary even much less when the impurity potentials from TiSi64 and TiSi216 are compared sup . More importantly, the critical impurity concentration for all three investigated screening strengths lies between =0.2% and =0.1%. This indicates that the screening induced Mott localization plays a marginal role here compared to Anderson localization, despite the fact that most studies on IBSCs focus on Mott’s criterion only.
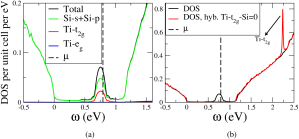
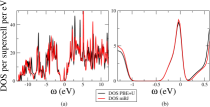
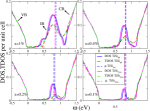
To understand the weak effect of Mott’s screening on Ti doped Si we take a closer look at the electronic structure of the impurity band complex. Fig. 3(a) shows the DOS of Si with 0.2% of Ti impurities, now resolving the partial contributions from Ti-, Ti- and Si-+Si-. As we can see the intermediate band complex consists of a strong mixture of Ti-, Si- and Si-. Clearly the hybridization of the Ti- orbitals with Si-/Si- plays an important role in the formation of the impurity band. To better illustrate this we plot in Fig. 3(b) the total DOS for a calculation in which we switch off the hybridization of Ti- with Si- and Si- in our effective tight-binding model. Fig. 3(b) shows that in that case the impurity band vanishes from the gap and ends up about 1 eV above the bottom of the conduction band. In other words the hybridization of Ti- with Si- and Si- is what creates the impurity band and this explains why the effects of screening are so weak in Ti doped Si. The main effect of the Ti impurity is coming from the overlaps of the Ti- wave functions with those of the Si- and Si- wave functions and those are affected only weakly by screening at most. For example, the largest element in our first principles derived impurity potential is a hopping element between Ti- and a nearest neighboring Si- orbital. Its value of 1.4 eV differs only by 1 meV when its extracted from the TiSi8 supercell instead of the TiSi216 supercell. Based on this microscopic insight we expect that our conclusion on the weakness of screening effects in Ti doped Si can be generalized to other IB semiconductors. In particular, in transition metal doped intermediate band semiconductors such as Co doped Si Zhou et al. (2013b), V doped In2S3 Lucena et al. (2008), Ti doped GaAs Brandt et al. (1989) and Cr doped AlP Olsson et al. (2009), we can expect a strong hopping disorder, given that the transition metal impurity orbitals are highly distinct from the and host orbitals. On the other hand, in S doped Si the impurity and host atoms are chemically close to each other because S and Si are in the same row and only two columns apart in the periodic table. Therefore the impurity band in this case is expected to be less controlled by hopping to impurity sites and hence more susceptible to screening effects, explaining why long range Coulomb effects in S doped Si may play a more important role Winkler et al. (2011).
Our finding that in Ti doped Si Anderson localization dominates over Mott localization has important consequences for the theory of intermediate band solar cells in this system and others like it, given that the nature of these two localization mechanisms is fundamentally different. First of all, the Mott transition is believed to be first order Mott (1968), whereas the Anderson transition is a second order phase transition Abrahams (2010). Therefore, one expects a less abrupt lifetime recovery as a function of Ti doping for Anderson localization than for the Mott’s mechanism. Furthermore, a Mott localized state is trapped by a single impurity whereas the Anderson localized state is typically trapped by a cluster of impurities that has a large extent in space Carnio et al. (2017). This means that the charge in an Anderson localized state will be more spread out and less likely to cause non-radiative recombinations than in a Mott localized state. Finally, the Anderson transition is a quantum phase transition only defined at zero temperature Abrahams (2010), whereas the relevant temperature for IBSCs is room temperature. However, it has been shown that effects of the Anderson localization, such as variable range hopping, extend to room temperature and beyond Chopra and Bahl (1970); Bates and Zhang (2013); van Hapert (1973). Moreover, even if an electron hops between Anderson localized states via interaction with phonons Ambegaokar et al. (1971), an important question is how fast it will do so. If the time scale is larger or comparable to the carrier lifetime then the Anderson localization should still strongly affect the non-radiative recombination rate. Given that both variable range hopping and non-radiative recombinations are controlled by phonons, it is conceivable that their time scales be comparable. The above implications for the theory of IBSCs highlight the richness of the physics of Anderson localization and that of disordered materials in general.
In summary, by combining two recently developed theoretical techniques, the EDHM and the TMDCA, we investigate from first principles the metal-insulator transition in the promising intermediate-band photovoltaic material Ti doped Si. We systematically study the localization in the impurity band and find that the impurity band electrons delocalize for a Ti concentration between =0.1% and =0.2%. Our calculation can be applied to other systems with intermediate bands providing guidance to make highly efficient IB solar cells. Moreover, our approach provides a systematic way to study the nature of the localization transition by separating the effects of Mott and Anderson localization. Our results show that in Ti doped Si, Anderson localization dominates over Mott localization, despite that most studies on intermediate band solar cells consider Mott’s criterion for localization only. The reason for the weakness of Mott localization here is that the impurity band is induced by the hopping between Ti- and Si-/Si- orbitals, an effect that can not be diminished by screening. Given the fundamental differences between Mott and Anderson localization our finding has important implications for the theory of intermediate band solar cells.
This letter is based upon work supported by the U.S. Department of Energy, Office of Science, Office of Basic Energy Sciences under Award Number DE-SC0017861. Work by TB was performed at the Center for Nanophase Materials Sciences, a DOE Office of Science user facility. This manuscript has been authored by UT-Battelle, LLC under Contract No. DE-AC05-00OR22725 with the U.S. Department of Energy. This work used the high performance computational resources provided by the Louisiana Optical Network Initiative (http://www.loni.org), and HPC@LSU computing. Furthermore, this research used resources of the National Energy Research Scientific Computing Center, a DOE Office of Science User Facility supported by the Office of Science of the U.S. DOE under Contract No. DE-AC02-05CH11231. This work also used resources of the Oak Ridge Leadership Computing Facility at the Oak Ridge National Laboratory, which is supported by the Office of Science of the U.S. Department of Energy under Contract No. DE-AC05-00OR22725.
References
- Luque and Martí (1997) A. Luque and A. Martí, Phys. Rev. Lett. 78, 5014 (1997).
- Luque and Martí (2010) A. Luque and A. Martí, Adv. Mater. 22, 160 (2010).
- Okada et al. (2015) Y. Okada, N. J. Ekins-Daukes, T. Kita, R. Tamaki, M. Yoshida, A. Pusch, O. Hess, C. C. Phillips, D. J. Farrell, K. Yoshida, N. Ahsan, Y. Shoji, T. Sogabe, and J.-F. Guillemoles, Appl. Phys. Rev. 2, 021302 (2015).
- Luque et al. (2012) A. Luque, A. Martí, and C. Stanley, Nat. Photonics 6, 146 (2012).
- Shockley and Read (1952) W. Shockley and W. T. Read, Phys. Rev. 87, 835 (1952).
- Hall (1952) R. N. Hall, Phys. Rev. 87, 387 (1952).
- Lang and Henry (1975) D. V. Lang and C. H. Henry, Phys. Rev. Lett. 35, 1525 (1975).
- Luque et al. (2006) A. Luque, A. Martí, E. Antolín, and C. Tablero, Physica B 382, 320 (2006).
- Anderson (1958) P. W. Anderson, Phys. Rev. 109, 1492 (1958).
- Mott (1968) N. F. Mott, Rev. Mod. Phys. 40, 677 (1968).
- Imada et al. (1998) M. Imada, A. Fujimori, and Y. Tokura, Rev. Mod. Phys. 70, 1039 (1998).
- Martí et al. (2008) A. Martí, D. F. Marrón, and A. Luque, Journal of Applied Physics 103, 073706 (2008).
- Olea et al. (2008) J. Olea, M. Toledano-Luque, D. Pastor, G. González-Díaz, and I. Mártil, J. Appl. Phys. 104, 016105 (2008).
- Olea et al. (2009) J. Olea, G. González-Díaz, D. Pastor, and I. Mártil, Journal of Physics D: Applied Physics 42, 085110 (2009).
- Olea et al. (2010) J. Olea, M. Toledano-Luque, D. Pastor, E. San-Andrés, I. Mártil, and G. González-Díaz, J. Appl. Phys. 107, 103524 (2010).
- Olea et al. (2012) J. Olea, D. Pastor, E. García-Hemme, R. García-Hernansanz, Á. del Prado, I. Mártil, and G. González-Díaz, Thin Solid Films 520, 6614 (2012).
- Sánchez et al. (2009) K. Sánchez, I. Aguilera, P. Palacios, and P. Wahnón, Phys. Rev. B 79, 165203 (2009).
- Gonzalez-Díaz et al. (2009) G. Gonzalez-Díaz, J. Olea, I. Mártil, D. Pastor, A. Martí, E. Antolín, and A. Luque, Solar Energy Materials and Solar Cells 93, 1668 (2009).
- Winkler et al. (2011) M. T. Winkler, D. Recht, M.-J. Sher, A. J. Said, E. Mazur, and M. J. Aziz, Phys. Rev. Lett. 106, 178701 (2011).
- Zhou et al. (2013a) Y. Zhou, F. Liu, M. Zhu, X. Song, and P. Zhang, Applied Physics Letters 102, 222106 (2013a).
- Zhou et al. (2013b) Y. Zhou, F. Liu, and X. Song, Journal of Applied Physics 113, 103702 (2013b), https://doi.org/10.1063/1.4794818 .
- Pastor et al. (2013) D. Pastor, J. Olea, A. del Prado, E. García-Hemme, R. García-Hernansanz, I. Mártil, and G. González-Díaz, Journal of Physics D: Applied Physics 46, 135108 (2013).
- Hu et al. (2014) S. Hu, P. Han, P. Liang, Y. Xing, and S. Lou, Materials Science in Semiconductor Processing 17, 134 (2014).
- Dong et al. (2015) X. Dong, X. Song, Y. Wang, and J. Wang, Applied Physics Express 8, 081302 (2015).
- Flores and Menéndez-Proupin (2016) M. A. Flores and E. Menéndez-Proupin, Journal of Physics: Conference Series 720, 012033 (2016).
- Liu et al. (2016) F. Liu, S. Prucnal, R. Hübner, Y. Yuan, W. Skorupa, M. Helm, and S. Zhou, Journal of Physics D: Applied Physics 49, 245104 (2016).
- Carnio et al. (2017) E. G. Carnio, N. D. M. Hine, and R. A. Römer, ArXiv e-prints (2017), arXiv:1710.01742 .
- Antolín et al. (2009) E. Antolín, A. Martí, J. Olea, D. Pastor, G. González-Díaz, I. Mártil, and A. Luque, Appl. Phys. Lett. 94, 042115 (2009).
- Berlijn et al. (2011) T. Berlijn, D. Volja, and W. Ku, Phys. Rev. Lett. 106, 077005 (2011).
- Ekuma et al. (2014) C. E. Ekuma, H. Terletska, K.-M. Tam, Z.-Y. Meng, J. Moreno, and M. Jarrell, Phys. Rev. B 89, 081107 (2014).
- Vasquez et al. (2008) L. J. Vasquez, A. Rodriguez, and R. A. Römer, Phys. Rev. B 78, 195106 (2008).
- Zhang et al. (2015) Y. Zhang, H. Terletska, C. Moore, C. Ekuma, K.-M. Tam, T. Berlijn, W. Ku, J. Moreno, and M. Jarrell, Phys. Rev. B 92, 205111 (2015).
- Zhang et al. (2016) Y. Zhang, R. Nelson, E. Siddiqui, K.-M. Tam, U. Yu, T. Berlijn, W. Ku, N. S. Vidhyadhiraja, J. Moreno, and M. Jarrell, Phys. Rev. B 94, 224208 (2016).
- Marzari and Vanderbilt (1997) N. Marzari and D. Vanderbilt, Phys. Rev. B 56, 12847 (1997).
- Ku et al. (2002) W. Ku, H. Rosner, W. E. Pickett, and R. T. Scalettar, Phys. Rev. Lett. 89, 167204 (2002).
- (36) Technical details are provided in the Supplementary Information.
- Tran and Blaha (2009) F. Tran and P. Blaha, Phys. Rev. Lett. 102, 226401 (2009).
- Dobrosavljević et al. (2003) V. Dobrosavljević, A. A. Pastor, and B. K. Nikolić, Europhys. Lett. 62, 76 (2003).
- Soven (1967) P. Soven, Phys. Rev. 156, 809 (1967).
- Weiße et al. (2006) A. Weiße, G. Wellein, A. Alvermann, and H. Fehske, Rev. Mod. Phys. 78, 275 (2006).
- Terletska et al. (2014) H. Terletska, C. E. Ekuma, C. Moore, K.-M. Tam, J. Moreno, and M. Jarrell, Phys. Rev. B 90, 094208 (2014).
- Rosenbaum et al. (1983) T. F. Rosenbaum, R. F. Milligan, M. A. Paalanen, G. A. Thomas, R. N. Bhatt, and W. Lin, Phys. Rev. B 27, 7509 (1983).
- Lucena et al. (2008) R. Lucena, I. Aguilera, P. Palacios, P. Wahnón, and J. C. Conesa, Chemistry of Materials 20, 5125 (2008).
- Brandt et al. (1989) C. D. Brandt, A. M. Hennel, T. Bryskiewicz, K. Y. Ko, L. M. Pawlosicz, and H. C. Gatos, Journal of Applied Physics 65, 3459 (1989).
- Olsson et al. (2009) P. Olsson, C. Domain, and J.-F. Guillemoles, Phys. Rev. Lett. 102, 227204 (2009).
- Abrahams (2010) E. Abrahams, 50 Years of Anderson Localization (World Scientific, 2010).
- Chopra and Bahl (1970) K. L. Chopra and S. K. Bahl, Phys. Rev. B 1, 2545 (1970).
- Bates and Zhang (2013) C. W. Bates and C. Zhang, AIP Advances 3, 102111 (2013).
- van Hapert (1973) J. J. van Hapert, Hopping Conduction and Chemical Structure: a study on Silicon Suboxides, Ph.D. thesis, Utrecht University (1973).
- Ambegaokar et al. (1971) V. Ambegaokar, B. I. Halperin, and J. S. Langer, Phys. Rev. B 4, 2612 (1971).
Supplemental Materials: On the Nature of Localization in Ti doped Si
I 1. DETAILS OF THE DENSITY FUNCTIONAL THEORY CALCULATIONS
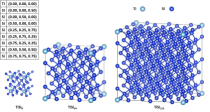
We used the WIEN2K Schwarz et al. (2002) implementation of the full potential linearized augmented plane wave (LAPW) method with the Perdew-Burke-Ernzerhof (PBE) exchange-correlation functional Perdew et al. (1996). For the simulation we took the space group 227: Fd-3m and the lattice constant a = 10.26 Bohr of Si from Ref. Többens et al. (2001). To capture the single Ti impurity influence, three different supercells were used corresponding to the sizes of the 1 1 1, 2 2 2, 3 3 3 Si8 supercell (see Fig. S1). Following the conclusion of Ref. Sánchez et al. (2009) the Ti is located at the tetrahedral interstitial site (Fig. S1). We use a k-point mesh of 11 11 11 for the undoped normal cell and of 3 3 3 for the supercells. The basis set sizes were determined by . To better describe the experimental band-gap of Si we apply the LDA+U approximation Anisimov et al. (1993), or to be more precise the PBE+U approximation, with U=-5.1 eV for Si-. As shown in Fig. S2 our PBE+U results compare accurately with the results obtained from the modified Becke-Johnson potential Tran and Blaha (2009), especially for the Density of States (DOS) close to the gap. For the results shown in Sec. 7 the internal forces were relaxed to less than 2mRy/Bohr. For all other results in the supplement and the manuscript we did not relax the atomic positions.
II 2. DETAILS OF THE WANNIER FUNCTION CALCULATIONS
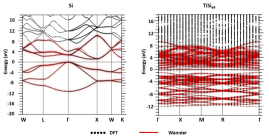
To derive the Wannier function based tight binding Hamiltonians from the DFT calculations we perform a projected Wannier function transformation Ku et al. (2002). Specifically we project the Ti-, Si- and Si- orbitals onto the bands within [-12.5,11] eV. Fig. S3 shows the comparison of the Wannier and DFT bandstructures for pure Si and the TiSi64 supercell.
III 3. Full DOS spectrum
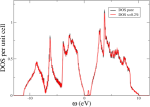
The DOS spectrum obtained from DCA Jarrell and Krishnamurthy (2001) for the undoped case and the Ti concentration are shown in Fig. S4. We note that the impurity band is located inside the band gap for the doped case.
IV 4. Convergence of DOS and TDOS with cluster size
We check the convergence of the DCA and the TMDCA with cluster size Nc and find that the DOS converges up to cluster size Nc=64 and the TDOS converges up to cluster size Nc=128 as shown in Fig. S5. We use these cluster sizes throughout the manuscript and the supplement.
V 5. Convergence of DOS and TDOS with in the Brillouin Zone
We check the convergence of DCA and TMDCA against the size of the mesh in momentum space (), and find that both DOS and TDOS are well converged with k-points in the Brillouin zone as shown in Fig. S6. We use this number of k-points throughout the manuscript and the supplement.

VI 6. Convergence of DOS and TDOS with Rmt*Kmax
We check the convergence of DOS and TDOS against the number of LAPW basis functions used in the DFT, which is controlled by the parameter Rmt*Kmax. Specifically we perform DFT calculations of pure Si and TiSi216 supercell for various values of Rmt*Kmax and derive the impurity potential for each of them. We find that both DOS and TDOS are well converged for Rmt*Kmax=6 as shown in Fig. S7. We use this value throughout the manuscript and the supplement.

VII 7. Effect of lattice relaxation on DOS and TDOS
We derive the impurity potential from the TiSi216 supercell using lattice relaxed atomic positions and use it for the DCA and TMDCA calculation. We compare our results with the case without lattice relaxation. The change in DOS and TDOS is negligible as shown in Fig. S8. The critical Ti concentration determined using this impurity potential still lies between 0.1% and 0.2% as shown in Fig. S9.
VIII 8. Effect of spin-polarization on DOS and TDOS
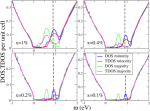
We derive the impurity potential from the TiSi216 supercell using spin-polarized DFT and use it for the DCA and TMDCA calculation. As shown in Fig. S10 for Ti concentrations , the spin majority part of the impurity band is fully filled and energetically separated from the partially filled spin minority impurity band. Therefore electrons from the valence band can only be promoted to the spin-minority impurity band and we need focus our study of localization on those spin minority states around the chemical potential. Fig. S10 shows that the DOS and TDOS of the spin-minority impurity band follows the same trend as those of the non spin-polarized impurity band presented in Fig. 2 of the manuscript. In particular the critical Ti concentration still lies between 0.1% and 0.2%.
IX 9. Comparing DOS and TDOS for TiSi64 and TiSi216 derived impurity potentials
Fig. S11 shows that DOS and TDOS change little when the impurity potential is derived from the TiSi64 supercell instead of the TiSi216.
References
- Schwarz et al. (2002) K. Schwarz, P. Blaha, and G. Madsen, Computer Physics Communications 147, 71 (2002), proceedings of the Europhysics Conference on Computational Physics Computational Modeling and Simulation of Complex Systems.
- Perdew et al. (1996) J. P. Perdew, K. Burke, and M. Ernzerhof, Phys. Rev. Lett. 77, 3865 (1996).
- Többens et al. (2001) D. Többens, N. Stüßer, K. Knorr, H. Mayer, and G. Lampert, in European Powder Diffraction EPDIC 7, Materials Science Forum, Vol. 378 (Trans Tech Publications, 2001) pp. 288–293.
- Sánchez et al. (2009) K. Sánchez, I. Aguilera, P. Palacios, and P. Wahnón, Phys. Rev. B 79, 165203 (2009).
- Anisimov et al. (1993) V. I. Anisimov, I. V. Solovyev, M. A. Korotin, M. T. Czyżyk, and G. A. Sawatzky, Phys. Rev. B 48, 16929 (1993).
- Tran and Blaha (2009) F. Tran and P. Blaha, Phys. Rev. Lett. 102, 226401 (2009).
- Ku et al. (2002) W. Ku, H. Rosner, W. E. Pickett, and R. T. Scalettar, Phys. Rev. Lett. 89, 167204 (2002).
- Jarrell and Krishnamurthy (2001) M. Jarrell and H. R. Krishnamurthy, Phys. Rev. B 63, 125102 (2001).