Structure and glass-forming ability of simulated Ni-Zr alloys
Abstract
Binary Cu-Zr system is a representative bulk glassformer demonstrating high glass forming ability due to pronounced icosahedral local ordering. From the first glance, Ni-Zr system is the most natural object to expect the same behavior because nickel and copper are neighbours in the periodic table and have similar physicochemical properties. However, doing molecular dynamics simulations of alloys described by embedded atom model potential, we observe different behaviour. We conclude that the Ni-Zr system has the same glass-forming ability as an additive binary Lennard-Jones mixture without any chemical interaction. The structural analysis reveals that icosahedral ordering in Ni-Zr alloys is much less pronounced than that in the Cu-Zr ones. We suggest that lack of icosahedral ordering due to peculiarities of interatomic interactions is the reason of relatively poor glass-forming ability of Ni-Zr system.
I Introduction
Metallic glasses, solid metallic materials disordered at atomic scale, are of special interest due to their extraordinary physical properties and high potential for applications Suryanarayana and Inoue (2017); Smith et al. (2017); Hufnagel et al. (2016); Laws et al. (2015). Important problem is identifying alloys with high glass-forming ability (GFA), which are capable to form metallic glasses under cooling of melts at relatively low rates Wu et al. (2015); Yu et al. (2015). Empirical knowledge of GFA is mostly based on statistical guides and there is a lack of microscopic rationale Tang and Harrowell (2013). A number of good metallic glass-forming alloys is known, with Cu-Zr ones as an exemplary glassformers capable to form bulk metallic glasses Xu et al. (2004); Wang et al. (2004, 2005). Cu and Zr are both d-elements in the periodic table with pronounced metallic properties. What happens if we replace one of the components on a “relative” metallic d-element? This is an example of one of the most important issues, the solution of which is necessary to understand the nature of metallic glasses. We address this question moving from Cu-Zr to Ni-Zr alloys.
Cu and Ni are neighbors in the periodic table, with atomic numbers 29 and 28 and atomic weights 63.54 and 58.69, respectively. These elements are completely miscible in both liquid and solid states forming fcc-based Cu-Ni alloys which are widely used (e.g., in coinage). So the comparison of Cu-Zr and Ni-Zr alloys seems the most natural problem.
The relation between local structure and GFA of metallic alloys is an important issue from both fundamental and applied points of view Royall and Williams (2015). One of the widely accepted paradigm is that local icosahedral ordering is the cause of geometrical frustration favoring GFA Tarjus et al. (2005); Berthier and Biroli (2011); Shintani and Tanaka (2006). It is widely accepted by both experiments and simulations that GFA of Cu-Zr-based alloys is caused by pronounced icosahedral local ordering Li et al. (2009); Cheng et al. (2009); Soklaski et al. (2013); Wu et al. (2013); Wen et al. (2013); Wang et al. (2015); Wu et al. (2013); Saksl et al. (2003). Note that importance of other types of local clusters has been also pointed out Holland-Moritz et al. (2012); Peng et al. (2010). There is a natural question if the glass-forming properties of Cu-Zr system are universal for all similar alloys. Experimentally, the GFA of Ni-Zr system is essentially lower than that for Cu-Zr one and so bulk metallic glasses can not be produced for Ni-Zr alloys Dong et al. (1981); Huang and Li (2013). Thus, the comparison of structural characteristics of Cu-Zr and Ni-Zr alloys is an important fundamental task to understand the striking difference between the GFA. Experimental methods of structural analysis, even together with reverse Monte-Carlo technique, do not give complete picture and reveal qualitatively different results Holland-Moritz et al. (2009); Johnson et al. (2014); Fukunaga et al. (2006); Kaban et al. (2013); Liu et al. (2009, 2008). Ab-initio molecular dynamic simulations can not completely resolve these controversies Hao et al. (2009) possibly because of the limited amount of atoms in the simulated systems and quite small (picosecond) simulation times, not enough for reliable simulation of supercooled liquids and glasses. Here we address this issue doing classical molecular dynamic simulations, free from most of these limitations. We use Ni-Zr embedded atom model (EAM) potential proposed in Wilson and Mendelev (2015). Its reliability is ensured by good agreement with experimental data and quantum simulations of liquid Ni-Zr alloys.
We have done the structural analysis of Ni-Zr. It reveals that icosahedral ordering in Ni-Zr alloys is much less pronounced than that for the Cu-Zr ones. We show that simulated Ni-Zr system has rather poor GFA comparable to that for additive binary Lennard-Jones mixture without any chemical interaction (that means potential with and )Shimono and Onodera (2001, 2012).
The Ni-Zr system demonstrates different solid phases, both ordered and disordered, being quenched at cooling rates of the order of K/s usually applied in molecular dynamic simulations. So it is a good model for studying the interplay between crystallization and glass formation.
Doing such studies one should have reliable methods for detecting both crystalline and glassy states as well as recognizing short-ranged structures with different symmetries. Thus, the purpose of this paper is twofold: to study the GFA of simulated Ni-Zr alloys in the whole range of the compositions, and to develop new instruments for analysing the structure of quenched solid phases complementing the known methods.
II Methods
Classical molecular dynamics is the main theoretical tool to study properties of glasses because it makes it possible to overcome the problems of analytical description of non-ordered condensed matter systems Changfu et al. (1987); Dubinin et al. (2014, 2011) and allows studying microscopic structure and dynamics covering sufficiently large time and spatial scales Frenkel and Smit (2001).
For the molecular dynamics (MD) simulations, we use LAMMPS package Plimpton (1995). The system of particles was simulated under periodic boundary conditions in Nose-Hoover NPT ensemble at pressure atm. The MD time step was 1-3 fs depending on the system temperature. Initial configurations were equilibrated melts at K. Then, the system was cooled down to K with different cooling rates: K/s.
As the model of interaction between alloy components, we use EAM potential of Finnis-Sinclair type developed in Wilson and Mendelev (2015).
To identify the crystalline and liquid-like particles we use the bond orientational order parameters method (BOOP) Steinhardt et al. (1983); the method has been widely used in condensed matter physics to quantify the local orientational order Steinhardt et al. (1981, 1983); Mituś and Patashinskii (1982) in Lennard-Jones and hard sphere systems Rintoul and Torquato (1996); Luchnikov et al. (2002); Jin and Makse (2010); Ryltsev and Chtchelkatchev (2013); Klumov et al. (2014); Baranau and Tallarek (2014), bulky and confined complex plasmas Klumov and Morfill (2007); Klumov et al. (2010); Klumov (2010a); Khrapak et al. (2012), colloidal Gasser et al. (2001); Kawasaki and Tanaka (2010); Ryltsev et al. (2013); Ryltsev and Chtchelkatchev (2017) and patchy systems Vasilyev et al. (2013, 2015), etc. The method allows us to explicitly recognize symmetry of the local atomic clusters Klumov (2010b); Klumov et al. (2011); Hirata et al. (2013); Klumov et al. (2014) and study their spatial distribution Ryltsev and Chtchelkatchev (2013); Ryltsev et al. (2015, 2016).
Within the framework of BOOP method, we define the rotational invariants (RI) of rank of both the second and third order Steinhardt et al. (1981, 1983). The advantage of and is that they are uniquely determined for any polyhedron including the elements of any crystalline structure. Among the RI, , , , are typically the most informative ones so we use them in this study. To identify close packed and icosahedral-like clusters we calculate the rotational invariants , for each atom using the fixed number of nearest neighbors (). Atom whose coordinates in space are sufficiently close to those for the perfect structures are counted as icosahedral-like (fcc-like, hcp-like) etc. The RI for a number of close-packed structures are shown in Table 1.
| cluster | ||||
|---|---|---|---|---|
| hcp (12 NN) | 0.097 | 0.485 | 0.134 | -0.012 |
| fcc (12 NN) | 0.19 | 0.575 | -0.159 | -0.013 |
| ico (12 NN) | 0.663 | -0.159 | -0.169 | |
| bcc ( 8 NN) | 0.5 | 0.628 | -0.159 | 0.013 |
| bcc (14 NN) | 0.036 | 0.51 | 0.159 | 0.013 |
| LJ melt (12 NN) | 0.155 | 0.37 | -0.023 | -0.04 |
III Results
III.1 Two-point correlation functions
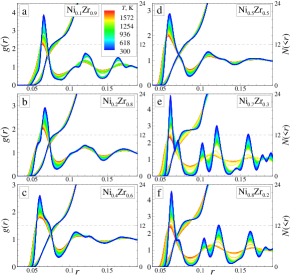
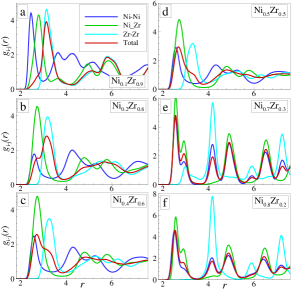
Properties of the short- and medium-range translational order can be estimated from the analysis of the total translational two-point correlation function – radial distribution function (RDF) . Fig. 1 shows temperature evolution of the total RDF of simulated alloys quenched at cooling rate K/s for a few different Ni abundances . Additionally, the cumulative RDFs are plotted; by using it is easy to estimate the mean nearest neighbours number in the first coordination shell. All curves are color coded via temperature of the alloy (indicated on the plot). Fig. 2 shows both total and partial RDFs for the final room-temperature states at K. Shape of presented RDFs reveal disordered, glassy-like final state (taken at 300 K) of the system for (see panels (a)-(d)) but clearly crystalline-like behaviour at (panels (e),(f)). However, more rigorous analysis will show that the configuration at low are also crystalline ones (see Fig. 3, Fig. 6) and Fig. 7).
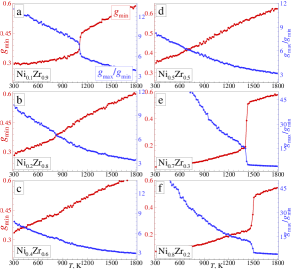
To identify structural phase transitions in a system by using the total RDF shape, it is convenient to use inverted Raveché-Mountain-Streett (RMS) parameter Raveche et al. (1974) which is defined as ratio of value at the first maximum to that at the first nonzero minimum: . However, the use of the parameter instead may be even more convenient because it is nearly independent on the interaction potential softness (unlike the parameter RMS) Khrapak et al. (2017). These parameters were recently used to identify the liquid-glass transition in CuZr system Ryltsev et al. (2016). Fig. 3 shows how both and vary at cooling of the Ni-Zr alloys (at the same values as in Fig. 1). Both indicators clearly show transition to crystalline structure at cooling for (panels (a), (e), (f)) but continuous evolution of the structure to the disordered amorphous solid state for (panels b,c,d). Note that temperature dependencies of the structure indicators shown in Fig. 3b,c,d do not demonstrate any kinks or drastic inflections indicating glass transition as for Cu-Zr alloys (see, for example Ryltsev et al. (2016)). The possible reason is the lack of pronounced icosahedral ordering in Ni-Zr alloys (see below) whose increase at the glass transition temperature leads to the mentioned anomalies in the case of Cu-Zr.
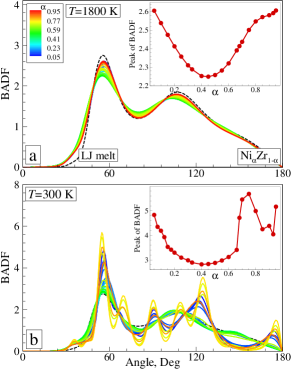
Another important two-point correlation function, bond angle distribution function (BADF) , measures the probability that two nearest neighbours and central atom form the angle . Fig. 4 shows at different Ni compositions for both the initial ( K) and final ( K) states. The room-temperature BADFs demonstrate the similar picture as RDFs: there are two crystal-like concentration regions and the glassy one in between them.
Fig. 4 (a) allows analyzing the structure of high-temperature states from which the system was cooled down. Comparing BADF for Ni-Zr system with that for Lennard-Jones melt at , (in reduced Lennard-Jones units Ryltsev and Chtchelkatchev (2013)) we see their close similarity. That suggests the idea that BADFs of different close-packed systems are very similar for the melts near the solid-liquid coexistence line. Such similarity has been already observed for Cu-Zr alloys Ryltsev et al. (2016); Klumov et al. (2016). We argue that such similarity can be explained by the existence of local tetrahedral order which has been found in Lennard-Jones fluids Ryltsev and Chtchelkatchev (2013). Our results suggest the formation of local tetrahedra might be an universal feature of close-packed fluids.
The insets in Fig. 4 show how the first maximum value of the BADF depends on the Ni abundance . It is a new measure characterizing the mean local order of the system. At high temperature (panel (a)), there is a minimum of at (); at room temperature (panel (b)), the minimum occurs at the same with which is very close to that value for the Lennard-Jones melt (). So value looks as very promising measure to quantify the structural order in the system. For instance, dependence clearly shows inflections at , corresponding to boundaries between crystalline and glassy regions for room-temperature states (see inset in Fig. 4b).
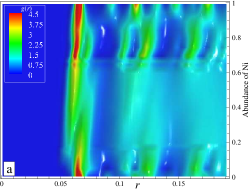
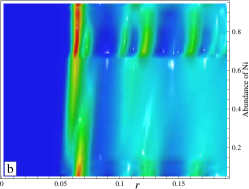
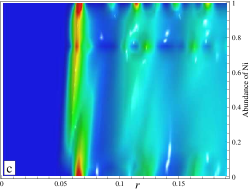
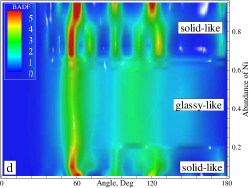
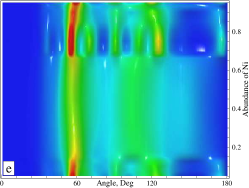
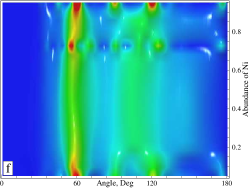
Thus, the analysis of two-point correlation functions allows estimating the composition range corresponding to glass formation and analysing the structure of crystal phases. To demonstrate cooling rate dependence of structure of quenched solid phases, we show in Fig. 5 color-coded plots of both the RDFs and BADFs for atomic configurations obtained at three different cooling rates and different concentrations. We see that the concentration range corresponding to glassy state essentially depends on cooling rate. Indeed it is about for K/s but for K/s. At K/s and the crystal state ”island” included to the glassy state area can be seen. That means the intermetallic compound has relatively high critical formation rate. Another interesting feature is observed in the area corresponding to crystal states: at high Ni concentration the change of crystal lattice structure takes place. This feature is more pronounced at the lowest cooling rate K/s (Fig. 5 (a) and (d)). Also note that RDFs obtained at all cooling rates studied demonstrate the change of the first peak locations at . It is interesting that the minimum on concentration dependence of first maximum value of BADF is observed at the same composition (see insert in Fig. 4 (a)).
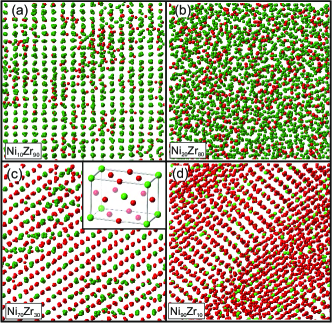
The results revealed from two-point correlation functions are confirmed by visual analysis of simulated configurations. In Fig. 6 we show typical snapshots for final room-temperature states obtained at K/s and different compositions. Each picture represents typical structure for characteristic concentration range revealed by two-point correlation functions analysis. The structure of Zr-rich alloys is a mixture of Zr-based fcc/hcp crystal lattices (see also the Fig. 8) with the Ni atoms mostly located in the voids (see Fig. 6a for alloy). The alloys at (at K/s) are visually amorphous (see Fig. 6b). The structure of alloys at corresponds to compound with tetragonal lattice (see the unit cell in the inset of Fig. 6c). This structure has I4/mmm space group and, for example, corresponds to compounds. A number of Zr atoms which do not match stoichiometry are located in voids (Fig. 6c). The structure of Ni-rich alloys contains a few crystalline grains (see Fig. 6d for alloy). Each grain is a mixture of fcc and hcp Ni-based lattices (as well as for Zr-rich alloys). However, unlike Zr-rich alloys, the atoms of second component (Zr) incorporate into the solvent crystal lattice substitutionally, by replacing Ni particles in the lattice.
III.2 Local orientational order
Two-point correlation functions analyzed above do not allow studying fine details of orientational order. For that purpose, we use the BOOP method described in section II. Calculation of rotation invariants of both second and third order requires specifying the number of nearest neighbours . That number can be estimated from the behaviour of the cumulative RDF presented in Fig. 1. We see from the picture that as it typically is for close-packed systems.
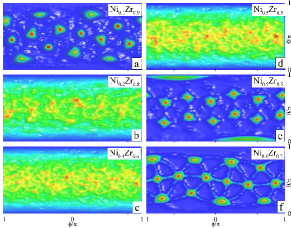
Before doing BOOP analysis, it is interesting to know how the nearest neighbors are distributed in the angle (-)-plane, where and are respectively the polar and the azimuthal angle (spherical coordinates) of a neighboring atom with respect to the central one. Such distributions are shown in Fig. 7 for the final room-temperature states of Ni-Zr alloys at different Ni concentration . Panels (b), (c), (d) with clearly reveal disordered glassy state of the alloys, while panels (a) (), (e) () and (f) () demonstrate crystalline-like local order. These results are in close agreement with the previous results obtained for two-point correlation functions. Note that distribution is much more sensitive than for distinguishing crystalline and glassy states. Indeed, the difference in between partially crystalline alloy (Fig. 3a) and completely glassy one (Fig. 3b) is not obvious whereas this difference is clearly seen from distribution (compare Fig. 7a and Fig. 7b).
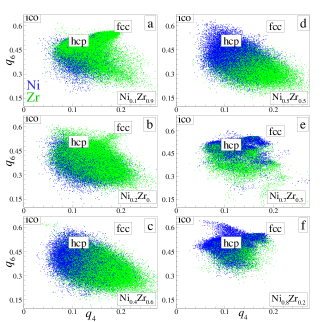
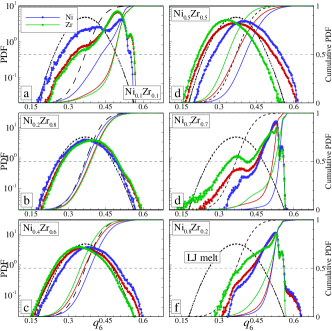
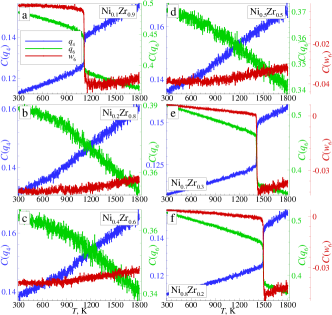
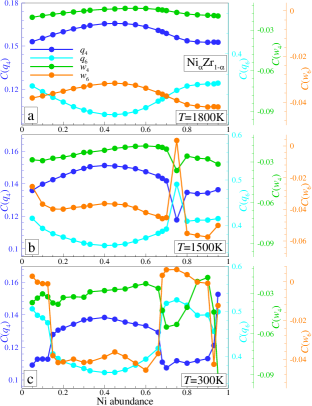
Fig. 8 shows local orientational order of the final room-temperature states of simulated alloys (obtained at K/s) on the plane of rotational invariants (calculated via fixed number of nearest neighbors: = 12) at few values. Points in the figure correspond to values calculated for the nearest neighbors of each atom. Positions of for the perfect hcp, fcc and icosahedral clusters are also marked. The picture clearly shows the formation of small amount of both hcp and fcc structures at low Ni concentration (Fig. 8 (a)), mostly disordered liquid-like behavior (with traces of hcp-like and fcc-like clusters) at intermediate (Fig. 8 (b),(c)) and strong ordering (with different crystalline symmetries) at high values (Fig. 8 (d)). Some traces of distorted icosahedral particles are present in Fig. 8 (panel (e)) at .
To quantify the distributions in Fig. 8, we use the normalized one-dimensional probability density function over different rotational invariants and , so that (for e.g. ) we have . Even more convenient is using (cumulative) distribution functions associated with the and Klumov (2010b); Klumov et al. (2011) which are defined as (by using as example the bond order parameter ): . Using the cumulative functions we can find abundance (density) of any structure with given accuracy : - , where is the bond order parameter for an ideal structure. We note, that the set of distributions and taken for different and completely describes the local orientational order in the system as an abundance of different ordered and disordered structures. Fig. 9 shows the probability distributions of the quenched Ni-Zr system (with cooling rate K/s) taken at room temperature and its cumulative distributions at different values. Corresponding distributions for the Lennard-Jones melt are also plotted for the comparison. Again, these distributions clearly show disordered states within the range of and crystalline-like states outside this range. Interestingly, the disordered distributions for the Ni-Zr alloys are very close to those for the Lennard-Jones melt. It suggests that local orientational order of LJ melt (which is nearly universal along the melting curve) can be used to understand local order in amorphous solids too.
Evidently, the cumulative distribution is the abundance of atoms, having and . Cumulants of these distributions define the global order parameters. E.g. cumulant is the position of the half-height of the cumulative distribution , so that . It was shown that such cumulants calculated for different invariants and are very sensitive to structural transitions Klumov (2010b). Fig. 10 shows temperature dependencies of these cumulants obtained at cooling for different values of . Again, panels (a), (e) and (f) clearly show transition to crystalline state; another panels reveal amorphization of the alloys under consideration. Note that, in case of amorphization, temperature dependencies of the cumulants do not demonstrate any kinks just like for structural parameters shown in Fig. 3.
Fig. 11 shows concentration dependencies of the cumulants for the initial ( K) and the final ( K) states of the Ni-Zr system. The curves for final ( K) states demonstrate discontinuities at the and which are the boundary concentrations separating regions corresponding to crystalline-like and glassy states (compare with Fig. 5).
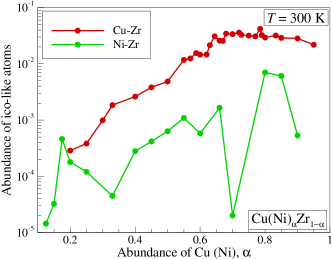
Important result following from the Fig. 8, Fig 9 and Fig. 11 is the lack of icosahedral ordering and so the local structure of Ni-Zr alloys is essentially different from that for Cu-Zr ones. To better illustrate this result, we show in Fig. 12 the comparison of concentration dependencies of icosahedral clusters abundances for Cu-Zr (see Ref. Klumov et al. (2016) for details) and Ni-Zr systems. A cluster is treated as icosahedral-like one if it has order parameters and . It is clearly seen that for Cu-Zr is a few orders of magnitude higher than that for Ni-Zr one. Note that the only composition range corresponding to glassy state for both systems is reasonable to compare ( in our case). Note that the conclusion about the lack of icosahedral ordering in Ni-Zr alloys is in close agreement with the results obtained by neutron scattering Holland-Moritz et al. (2009); Fukunaga et al. (2006), X-ray diffraction Hao et al. (2009) and ab-initio molecular dynamics Huang et al. (2011).
IV Discussion
IV.1 PADE analysis of two-point correlation functions
Doing molecular dynamic simulations and growing the crystalline sample from the melt one usually gets a polycrystal consisting of several crystalline grains. The larger the system size is the more grains form in the polycrystalline sample. So an important question appears how to distinguish the glassy state from the polycrystalline one. From the first glance, it appears to be not very convincing using the radial distribution function since its peaks in the glass and (poly)crystaline states may look quite similar (compare, for example, panels a and b in Fig. 1). So we proposed above an alternative method based on the specific study of the angular correlations of the nearest neighbors in the spherical coordinate system. For a relatively small system, as we have here, this method proves to be rather effective (see Fig. 7). But, for a large polycrystalline system this method should loose its effectiveness. This is so because symmetry directions of different crystallites are in general quite differently oriented. So the axis, pinned to the simulation box, of the spherical coordinate system is also differently oriented with respect to the crystal symmetry directions in different crystallites. Then most of the crystal-like characteristics of the angular distribution should become washed out after averaging over all crystallites of the polycrystal.
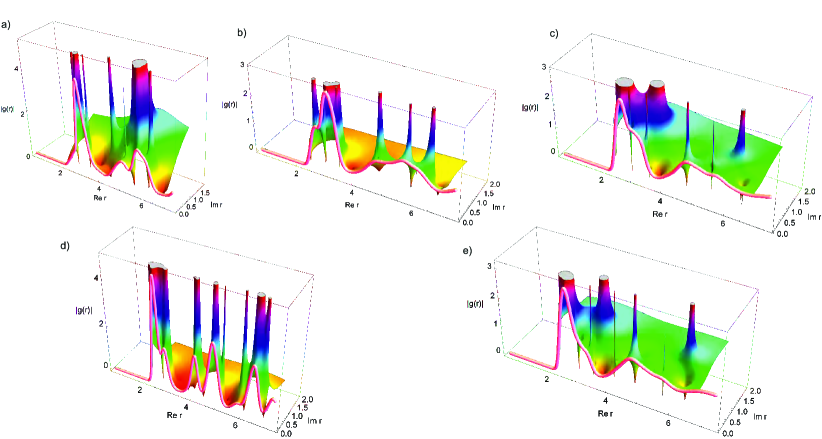
Next, it is important that the radial distribution function can be extracted from experimental diffraction data while the angular distribution can basically not. So this is a fundamental problem how to distinguish between glassy state and polycrystal one by means of an additional special treatment of the radial distribution function. For that purpose, we propose using the method of numerical analytical continuation into complex -plane (we treat as the complex number) developed earlier in Chtchelkatchev and Ryltsev (2015); Chtchelkatchev et al. (2016); Khusnutdinoff et al. (2016) to process the RDF-functions and uncover its hidden structure. Technically this procedure is based on Pade-approximants built on top of RDF table provided by our computer simulations.
Processed RDFs are shown in Fig. 13. As follows, RDF peaks and subpeaks transfer into pole-singularities in the complex plane. That means that RDF’s fitting functions should be based on Lorentzians, , where each pole-singularity generates the Lorenzian. Namely, the pole at complex point is related to the term . At real it reduces to the Lorentzian-like function . So if only one pole corresponds to the peak, calculation of gives the width of the peak. Doing the Fourier transform of RDF one produces the static structure factor . Then the pole singularity in RDF will correspond to terms in like according to contour integration rules and the residue theorem.
This result with Lorentzians is slightly counterintuitive because RDF is some kind of probability density built on top of large amount of particles interacting non-trivially. So intuitively, keeping in mind the statistics foundations, the Central Limit Theorem, one should naively expect Gaussian peaks. But instead nature produces Lorentzians. For many other systems we have seen the same behaviour of RDF before Chtchelkatchev et al. (2016); Khusnutdinoff et al. (2016). This point with Lorentzians certainly requires further investigations for understanding that will be done later elsewhere.
Important point that complex analytical continuation helps to distinguish glass RDFs from (poly)crystal ones. Crystal state is characterised by the long range order. For perfect crystal, RDF shows pronounced peaks for first, second, etc. nearest neighbour shells. For the imperfect crystal, the peaks in RDF are broadened and their amplitude is reduced, see, e.g., Fig. 13(d). In glassy state there is only short-range local order. Then usually only the first and second peaks of RDF (corresponding to first and second shells) are pronounced. Looking, e.g., at original RDFs (red “tube” curves) in Figs. 13, how to distinguish crystal from glass? The answer will give the second shell peak of RDF. Fig. 13(d) clearly shows the crystal, but why Fig. 13(a) is crystal? For crystal, Fig. 13(a), analytical continuation shows the pronounced pole-singularity with the same amplitude as we see for the first shell of RDF. This is the signature of the long range order. The pole corresponds to characteristic scale, the amplitude of the peak — to the “weight” of this scale among the others. The weight of the pole for second peak is the same like for the first one if we deal with crystal. For glass the situation is different, see, e.g., Fig. 13(b). The second shell of RDF produces poles with much smaller weight than for the first shell. For glass, we repeat, this is natural since there is no long range order.
IV.2 Glass-forming ability of Ni-Zr alloys
The results presented above show that simulated Ni-Zr alloys demonstrate either crystal or glassy solid phases being quenched from a liquid state at different cooling rates. So it is interesting to compare GFA of the Ni-Zr system with that for other binary mixtures. The first obvious system for comparison is the chemically similar Cu-Zr one that is a representative model glassformer. Experimentally, the Ni-Zr system has worse GFA than Cu-Zr one Dong et al. (1981); Huang and Li (2013). According to available data, the same is true for simulated Cu-Zr and Ni-Zr alloys. For widely accepted and intensively studied Cu-Zr EAM potential Mendelev et al. (2009); Zhang et al. (2015), it was shown that binary alloys quenched at cooling rate of K/s do not crystallizes in the concentration range of Klumov et al. (2016). Long time molecular dynamic simulations of binary alloy shows that the system partially crystallizes at cooling rate of the order of K/s Ryltsev et al. (2016).
Another representative binary system is a binary Lennard-Jones mixture (BLJ). There are two widely accepted BLJ glassformers – Kob-Andersen Kob and Andersen (1994) and Wahnström ones Wahnström (1991) – which was specially designed to favor GFA. For example, interaction parameters of Kob-Andersen model was chosen to mimic strong chemical interaction between components (that means non-additive mixture with ). These models are usually considered at certain compositions ( and , respectively) and so a direct comparison with alloys is hardly realizable. Note that both Kob-Andersen and Wahnström models have been recently revealed as not so good glassformers because they partially crystallized in lengthy molecular dynamics simulations Toxvaerd et al. (2009). Moreover, Kob-Andersen mixture is in fact very poor glassformer for large () system sizes Ingebrigtsen et al. (2018).
For our purposes, the more interesting results were obtained in Shimono and Onodera (2001, 2012) where comprehensive study of GFA of additive BLJ without chemical interaction (i.e. and ) was performed. Particularly, the concentration regions corresponding to both crystal and glassy states were obtained at different cooling rates and atomic size ratios. Let us consider formal accordance between parameters of BLJ studied in Shimono and Onodera (2001, 2012) and Ni-Zr alloys under consideration. The analysis of partial RDFs (Fig. 2) allows estimating the atomic size ratio for Ni-Zr system as . The cooling rate range of K/s corresponds to the range of in reduced Jennard-Jones units used inShimono and Onodera (2001, 2012). Doing such parameter matching, we conclude that concentration ranges of glass-formation for Ni-Zr system are approximately the same as those for BLJ one. That means GFA of EAM Ni-Zr model considered is the same order as for additive binary mixture of atoms interacting by isotropic pair potential without any chemical interaction. This conclusion is in close agrement with the lack of icosahedral ordering observed for the system under investigation (see Fig. 12). So we suggest that peculiarities of interatomic interactions in the considered EAM model of Ni-Zr alloys do not favor the formation of local icosahedral clusters and that is the reason of poor GFA of the system.
V Conclusions
Doing molecular dynamic simulations and quenching the Ni-Zr system at different cooling rates, we observe that final room temperature state is a glass in certain (cooling rate dependent) concentration range . Comparing such ”glassy window” with those for both Cu-Zr system and binary Lennard-Jones mixture we conclude the GFA of Ni-Zr system is nearly the same as for the latter. We suggest that such relatively weak GFA of the system under consideration is due to the fact that its local structure does not contain noticeable amount of icosahedral clusters. This result supports widely accepted idea that poly-tetrahedral (icosahedral) structural motifs favor glass-forming ability of particle systems.
The Cu-Zr and Ni-Zr systems are similar in physicochemical properties of component elements. But, replacing Cu with Ni, we change the ratio between interparticle scales, which seriously affects the frustration in the systems. The ratio between scales in the Cu-Zr system stabilizes the icosahedra, while in the Ni-Zr system – it does not.
VI Acknowledgments
MD Simulations were performed within the framework of state assignment of IMET UB RAS (the project №0396-2015-0076). Structural analysis was supported by Russian Science Foundation (grant grant RNF 18-12-00438). Analysis of Cu-Zr system was supported by Russian Science Foundation (grant №14-13-00676). Institute of Metallurgy thanks UB RAS for access to ”Uran” cluster. Part of calculations was performed using the resources of the Federal Collective Usage Center Complex for Simulation and Data Processing for Mega-science Facilities at NRC “Kurchatov Institute”, http://ckp.nrcki.ru/, and the cluster of Joint Supercomputing Center, Russian Academy of Sciences.
References
- Suryanarayana and Inoue (2017) C. Suryanarayana and A. Inoue, Bulk metallic glasses (CRC press, 2017).
- Smith et al. (2017) H. L. Smith, C. W. Li, A. Hoff, G. R. Garrett, D. S. Kim, F. C. Yang, M. S. Lucas, T. Swan-Wood, J. Lin, M. Stone, et al., Nature Phys. 13, 900 (2017).
- Hufnagel et al. (2016) T. C. Hufnagel, C. A. Schuh, and M. L. Falk, Acta Mater. 109, 375 (2016).
- Laws et al. (2015) K. Laws, D. Miracle, and M. Ferry, Nature Communications 6, 8123 (2015).
- Wu et al. (2015) Z. Wu, M. Li, W. Wang, and K. Liu, Nature communications 6, 6035 (2015).
- Yu et al. (2015) C. Yu, X. Liu, G. Zheng, X. Niu, and C. Liu, J. Alloys Compd. 627, 48 (2015).
- Tang and Harrowell (2013) C. Tang and P. Harrowell, Nature Mater. 12, 507 (2013).
- Xu et al. (2004) D. Xu, B. Lohwongwatana, G. Duan, W. L. Johnson, and C. Garland, Acta Mater. 52, 2621 (2004).
- Wang et al. (2004) D. Wang, Y. Li, B. B. Sun, M. L. Sui, K. Lu, and E. Ma, Appl. Phys. Lett. 84, 4029 (2004).
- Wang et al. (2005) W. Wang, J. Lewandowski, and A. Greer, J. Mater. Res. 20, 2307 (2005).
- Royall and Williams (2015) C. P. Royall and S. R. Williams, Phys. Reports 560, 1 (2015).
- Tarjus et al. (2005) G. Tarjus, S. A. Kivelson, Z. Nussinov, and P. Viot, J. Phys.: Condensed Matt. 17, R1143 (2005).
- Berthier and Biroli (2011) L. Berthier and G. Biroli, Rev. Mod. Phys. 83, 587 (2011).
- Shintani and Tanaka (2006) H. Shintani and H. Tanaka, Nature Phys. 2, 200 (2006).
- Li et al. (2009) M. Li, C. Z. Wang, S. G. Hao, M. J. Kramer, and K. M. Ho, Phys. Rev. B 80, 184201 (2009).
- Cheng et al. (2009) Y. Q. Cheng, E. Ma, and H. W. Sheng, Phys. Rev. Lett. 102, 245501 (2009).
- Soklaski et al. (2013) R. Soklaski, Z. Nussinov, Z. Markow, K. F. Kelton, and L. Yang, Phys. Rev. B 87, 184203 (2013).
- Wu et al. (2013) Z. W. Wu, M. Z. Li, W. H. Wang, and K. X. Liu, Phys. Rev. B 88, 054202 (2013).
- Wen et al. (2013) D. Wen, P. Peng, Y. Jiang, and R. Liu, J. Non-Cryst. Solids 378, 61 (2013).
- Wang et al. (2015) D. Wang, S.-J. Zhao, and L.-M. Liu, J. Phys. Chem. A 119, 806 (2015).
- Saksl et al. (2003) K. Saksl, H. Franz, P. Jóvári, K. Klementiev, E. Welter, A. Ehnes, J. Saida, A. Inoue, and J. Z. Jiang, Appl. Phys. Lett. 83, 3924 (2003).
- Holland-Moritz et al. (2012) D. Holland-Moritz, F. Yang, T. Kordel, S. Klein, F. Kargl, J. Gegner, T. Hansen, J. Bednarcik, I. Kaban, O. Shuleshova, N. Mattern, and A. Meyer, EPL (Europhysics Letters) 100, 56002 (2012).
- Peng et al. (2010) H. L. Peng, M. Z. Li, W. H. Wang, C.-Z. Wang, and K. M. Ho, Appl. Phys. Lett. 96, 021901 (2010).
- Dong et al. (1981) Y. Dong, G. Gregan, and M. Scott, J. Non-Cryst. Solids 43, 403 (1981).
- Huang and Li (2013) L. Huang and S. Li, J. Mater. 2013 (2013).
- Holland-Moritz et al. (2009) D. Holland-Moritz, S. Stüber, H. Hartmann, T. Unruh, T. Hansen, and A. Meyer, Phys. Rev. B 79, 064204 (2009).
- Johnson et al. (2014) M. Johnson, N. Mauro, A. Vogt, M. Blodgett, C. Pueblo, and K. Kelton, J. Non-Cryst. Solids 405, 211 (2014).
- Fukunaga et al. (2006) T. Fukunaga, K. Itoh, T. Otomo, K. Mori, M. Sugiyama, H. Kato, M. Hasegawa, A. Hirata, Y. Hirotsu, and A. Hannon, Intermetallics 14, 893 (2006), fourth International Conference on Bulk Metallic Glasses.
- Kaban et al. (2013) I. Kaban, P. Jóvári, V. Kokotin, O. Shuleshova, B. Beuneu, K. Saksl, N. Mattern, J. Eckert, and A. Greer, Acta Materialia 61, 2509 (2013).
- Liu et al. (2009) X. Liu, X. Hui, G. Chen, and T. Liu, Phys. Lett. A 373, 2488 (2009).
- Liu et al. (2008) X. J. Liu, G. L. Chen, X. Hui, T. Liu, and Z. P. Lu, Appl.Phys. Lett. 93, 011911 (2008).
- Hao et al. (2009) S. G. Hao, M. J. Kramer, C. Z. Wang, K. M. Ho, S. Nandi, A. Kreyssig, A. I. Goldman, V. Wessels, K. K. Sahu, K. F. Kelton, R. W. Hyers, S. M. Canepari, and J. R. Rogers, Phys. Rev. B 79, 104206 (2009).
- Wilson and Mendelev (2015) S. Wilson and M. Mendelev, Philos. Mag. 95, 224 (2015).
- Shimono and Onodera (2001) M. Shimono and H. Onodera, Scripta materialia 44, 1595 (2001).
- Shimono and Onodera (2012) M. Shimono and H. Onodera, Revue de Métallurgie 109, 41 (2012).
- Changfu et al. (1987) L. Changfu, V. A. Singh, and L. M. Roth, Phys. Rev. B 35, 7898 (1987).
- Dubinin et al. (2014) N. E. Dubinin, N. A. Vatolin, and V. V. Filippov, Russ. Chem. Rev. 83, 987 (2014).
- Dubinin et al. (2011) N. Dubinin, A. Yuryev, and N. Vatolin, Thermochimica Acta 518, 9 (2011).
- Frenkel and Smit (2001) D. Frenkel and B. Smit, Understanding molecular simulation: from algorithms to applications, Vol. 1 (Elsevier, 2001).
- Plimpton (1995) S. Plimpton, J. Comput. Phys. 117, 1 (1995).
- Steinhardt et al. (1983) P. J. Steinhardt, D. R. Nelson, and M. Ronchetti, Phys. Rev. B 28, 784 (1983).
- Steinhardt et al. (1981) P. J. Steinhardt, D. R. Nelson, and M. Ronchetti, Phys. Rev. Lett. 47, 1297 (1981).
- Mituś and Patashinskii (1982) A. Mituś and A. Patashinskii, Phys. Lett. A 87, 179 (1982).
- Rintoul and Torquato (1996) M. D. Rintoul and S. Torquato, J. Chem. Phys. 105, 9258 (1996).
- Luchnikov et al. (2002) V. Luchnikov, A. Gervois, P. Richard, L. Oger, and J. Troadec, J. Mol. Liq. 96-97, 185 (2002).
- Jin and Makse (2010) Y. Jin and H. A. Makse, Physica A 389, 5362 (2010).
- Ryltsev and Chtchelkatchev (2013) R. E. Ryltsev and N. M. Chtchelkatchev, Phys. Rev. E 88, 052101 (2013).
- Klumov et al. (2014) B. A. Klumov, Y. Jin, and H. A. Makse, J. Phys. Chem. B 118, 10761 (2014).
- Baranau and Tallarek (2014) V. Baranau and U. Tallarek, Soft Matter 10, 3826 (2014).
- Klumov and Morfill (2007) B. A. Klumov and G. E. Morfill, JETP Letters 85, 498 (2007).
- Klumov et al. (2010) B. Klumov, G. Joyce, C. Räth, P. Huber, H. Thomas, G. E. Morfill, V. Molotkov, and V. Fortov, EPL (Europhysics Letters) 92, 15003 (2010).
- Klumov (2010a) B. A. Klumov, Physics-Uspekhi 53, 1053 (2010a).
- Khrapak et al. (2012) S. A. Khrapak, B. A. Klumov, P. Huber, V. I. Molotkov, A. M. Lipaev, V. N. Naumkin, A. V. Ivlev, H. M. Thomas, M. Schwabe, G. E. Morfill, O. F. Petrov, V. E. Fortov, Y. Malentschenko, and S. Volkov, Phys. Rev. E 85, 066407 (2012).
- Gasser et al. (2001) U. Gasser, E. R. Weeks, A. Schofield, P. N. Pusey, and D. A. Weitz, Science 292, 258 (2001).
- Kawasaki and Tanaka (2010) T. Kawasaki and H. Tanaka, PNAS 107, 14036 (2010).
- Ryltsev et al. (2013) R. E. Ryltsev, N. M. Chtchelkatchev, and V. N. Ryzhov, Phys. Rev. Lett. 110, 025701 (2013).
- Ryltsev and Chtchelkatchev (2017) R. Ryltsev and N. Chtchelkatchev, Soft Matter 13, 5076 (2017).
- Vasilyev et al. (2013) O. A. Vasilyev, B. A. Klumov, and A. V. Tkachenko, Phys. Rev. E 88, 012302 (2013).
- Vasilyev et al. (2015) O. A. Vasilyev, B. A. Klumov, and A. V. Tkachenko, Phys. Rev. E 92, 012308 (2015).
- Klumov (2010b) B. A. Klumov, Physics-Uspekhi 53, 1053 (2010b).
- Klumov et al. (2011) B. A. Klumov, S. A. Khrapak, and G. E. Morfill, Phys. Rev. B 83, 184105 (2011).
- Hirata et al. (2013) A. Hirata, L. J. Kang, T. Fujita, B. Klumov, K. Matsue, M. Kotani, A. R. Yavari, and M. W. Chen, Science 341, 376 (2013).
- Ryltsev et al. (2015) R. Ryltsev, B. Klumov, and N. Chtchelkatchev, Soft Matter 11, 6991 (2015).
- Ryltsev et al. (2016) R. E. Ryltsev, B. A. Klumov, N. M. Chtchelkatchev, and K. Y. Shunyaev, J. Chem. Phys. 145, 034506 (2016).
- Raveche et al. (1974) H. J. Raveche, R. D. Mountain, and W. B. Streett, J. Chem. Phys. 61, 1970 (1974).
- Khrapak et al. (2017) S. Khrapak, B. Klumov, and L. Coudel, Sci. Rep. 7 (2017), 10.1038/s41598-017-08429-5.
- Klumov et al. (2016) B. A. Klumov, R. E. Ryltsev, and N. M. Chtchelkatchev, JETP Lett. 104, 546 (2016).
- Huang et al. (2011) L. Huang, C. Z. Wang, and K. M. Ho, Phys. Rev. B 83, 184103 (2011).
- Chtchelkatchev and Ryltsev (2015) N. M. Chtchelkatchev and R. E. Ryltsev, JETP Letters 102, 643 (2015).
- Chtchelkatchev et al. (2016) N. M. Chtchelkatchev, B. A. Klumov, R. E. Ryltsev, R. M. Khusnutdinoff, and A. V. Mokshin, JETP Letters 103, 390 (2016).
- Khusnutdinoff et al. (2016) R. M. Khusnutdinoff, A. V. Mokshin, B. A. Klumov, R. E. Ryltsev, and N. M. Chtchelkatchev, JETP 123, 265 (2016).
- Mendelev et al. (2009) M. Mendelev, M. Kramer, R. Ott, D. Sordelet, D. Yagodin, and P. Popel, Philos. Mag. 89, 967 (2009).
- Zhang et al. (2015) Y. Zhang, C. Z. Wang, M. I. Mendelev, F. Zhang, M. J. Kramer, and K. M. Ho, Phys. Rev. B 91, 180201 (2015).
- Kob and Andersen (1994) W. Kob and H. C. Andersen, Phys. Rev. Lett. 73, 1376 (1994).
- Wahnström (1991) G. Wahnström, Phys. Rev. A 44, 3752 (1991).
- Toxvaerd et al. (2009) S. Toxvaerd, U. R. Pedersen, T. B. Schrøder, and J. C. Dyre, J. Chem. Phys. 130, 224501 (2009).
- Ingebrigtsen et al. (2018) T. S. Ingebrigtsen, J. C. Dyre, T. B. Schrøder, and C. P. Royall, arXiv preprint arXiv:1804.01378 (2018).