Discourse Coherence in the Wild: A Dataset, Evaluation and Methods
Abstract
To date there has been very little work on assessing discourse coherence methods on real-world data. To address this, we present a new corpus of real-world texts (GCDC) as well as the first large-scale evaluation of leading discourse coherence algorithms. We show that neural models, including two that we introduce here (SentAvg and ParSeq), tend to perform best. We analyze these performance differences and discuss patterns we observed in low coherence texts in four domains.
1 Introduction
Discourse coherence is an important aspect of text quality. It encompasses how sentences are connected as well as how the entire document is organized to convey information to the reader. Developing discourse coherence models to distinguish coherent writing from incoherent writing is useful to a range of applications. An automated coherence scoring model could provide writing feedback, e.g. identifying a missing transition between topics or highlighting a poorly organized paragraph. Such a model could also improve the quality of natural language generation systems.
One approach to modeling coherence is to model the distribution of entities over sentences. The entity grid Barzilay and Lapata (2005), based on Centering Theory Grosz et al. (1995), was the first of these models. Extensions to the entity grid include additional features Elsner and Charniak (2008, 2011); Feng et al. (2014), a graph representation Guinaudeau and Strube (2013); Mesgar and Strube (2015), and neural convolutions Tien Nguyen and Joty (2017). Other approaches have used lexical cohesion Morris and Hirst (1991); Somasundaran et al. (2014), discourse relations Lin et al. (2011); Feng et al. (2014), and syntactic features Louis and Nenkova (2012). Neural networks have also been successfully applied to coherence Li and Hovy (2014); Tien Nguyen and Joty (2017); Li and Jurafsky (2017). However, until now, these approaches have not been benchmarked on a common dataset.
Past work has focused on the discourse coherence of well-formed texts in domains like newswire Barzilay and Lapata (2005); Elsner and Charniak (2008) via tasks like sentence ordering that use artificially constructed data. It was unknown how well the best methods would fare on real-world data that most people generate.
In this work, we seek to address the above deficiencies via four main contributions. First, we present a new corpus, the Grammarly Corpus of Discourse Coherence (GCDC), for real-world discourse coherence. The corpus contains texts the average person might write, e.g. emails and online reviews, each with a coherence rating from expert annotators (see examples in Table 11 and supplementary material). Second, we introduce two simple yet effective neural network models to score coherence. Third, we perform the first large-scale benchmarking of 7 leading coherence algorithms. We show that prior models, which performed at a very high level on well-formed and artificially generated data, have markedly lower performance in these new domains. Finally, the data, annotation guidelines, and code have all been made public.111https://github.com/aylai/GCDC-corpus
| Score | Text |
|---|---|
| Low |
Should I be flattered? Even a little bit? And, as for my alibi, well, let’s just say it depends on the snow and the secret service. So, subject to cross for sure. Do you think there could be copycats? Do you think the guy chose that mask or just picked up the nearest one? Please keep me informed as the case unfolds–
On another matter, can you believe Dan Burton will be the chair of one of the House subcommittees we’ll have to deal w? Irony and satire are the only sane responses. Happy New Year–and here’s hoping for many more stories that make us laugh! |
| High |
Cheryl,
I just spoke with Vidal Jorgensen. They expect to be on the ground in about 8 months. They have not yet raised enough money to get the project started – the total needed is $6M and they need $2M to get started. Vidal said they process has been delayed because their work in Colombia and China is consuming all their resources at the moment. Once on the ground, they will target the poorest of the poor and go to the toughest areas of Haiti. They anticipate an average loan size of $200 and they expect to reach about 10,000 borrowers in five years. They expect to be profitable in 4-5 years. Meghann |
2 A Corpus for Discourse Coherence
2.1 Related Work
Most previous work in discourse coherence has been evaluated on a sentence ordering task that assumes each text is well-formed and perfectly coherent, and any reordering of the same sentences is less coherent. Presented with a pair of texts – the original and a random permutation of the same sentences – a coherence model should be able to identify the original text. More challenging versions of this task (sentence insertion Elsner and Charniak (2011) and paragraph reconstruction Lapata (2003); Li and Jurafsky (2017)) all assume that the original text is perfectly coherent.
Datasets for the sentence ordering task tend to use texts that have been professionally written and extensively edited. These have included the Accidents and Earthquakes datasets Barzilay and Lapata (2005), the Wall Street Journal Elsner and Charniak (2008, 2011); Lin et al. (2011); Feng et al. (2014); Tien Nguyen and Joty (2017), and Wikipedia Li and Jurafsky (2017).
Another task, summary evaluation Barzilay and Lapata (2005), uses human coherence judgments, but include machine-generated texts. Coherence models are only required to identify which of a pair of texts is more coherent (presumably identifying human-written texts).
The line of work most closely related to our approach is the application of coherence modeling to automated essay scoring. Essays are written by test-takers, not professional writers, so they are not assumed to be coherent. Manual annotation is required to assign the essay an overall quality score Feng et al. (2014) or to rate the coherence of the essay Somasundaran et al. (2014); Burstein et al. (2010, 2013). While this line of work goes beyond sentence ordering to examine the qualities of a low-coherence text, it has only been applied to test-taker essays.
In contrast to previous datasets, we collect writing from non-professional writers in everyday contexts. Rather than using permuted or machine-generated texts as examples of low coherence, we want to investigate the ways in which people try but fail to write coherently. We present a corpus that contains texts from four domains, covering a range of coherence, each annotated with a document-level coherence score. In Sections 2.2-2.6, we describe our data collection process and the characteristics of the resulting corpus.
2.2 Domains
For a robust evaluation, we selected domains that reflect what an average person writes on a regular basis: forum posts, emails, and product reviews. For online forum posts, we sampled responses from the Yahoo Answers L6 corpus222https://webscope.sandbox.yahoo.com/catalog.php?datatype=l for the Yahoo domain. For emails, we used the State Department’s release of emails from Hillary Clinton’s office333https://foia.state.gov/Search/Results.aspx?collection=Clinton_Email and emails from the Enron Corpus444https://www.cs.cmu.edu/~./enron/ to make up our Clinton and Enron domains. Finally, we sampled reviews of businesses from the Yelp Open Dataset555https://www.yelp.com/dataset for our Yelp domain.
2.3 Text Selection
We randomly selected texts from each domain given a few filters. We want each text to be long enough to exhibit a range of characteristics of local and global coherence, but not so long that the labeling process is tedious for annotators. Therefore, we considered texts between 100 and 300 words in length. We ignored texts containing URLs (as they often quote writing from other sources) and texts with too many line breaks (usually lists).
2.4 Annotation
We collected coherence judgments both from expert raters with prior linguistic annotation experience, as in Burstein et al. (2010) and from untrained raters via Amazon Mechanical Turk. This allows us to assess the efficacy of using untrained raters for this task. We asked the raters to rate the coherence of each text on a 3-point scale from 1 (low coherence) to 3 (high coherence) given the following instructions, which are based on prior coherence annotation efforts Barzilay and Lapata (2008); Burstein et al. (2013):
A text with high coherence is easy to understand, well-organized, and contains only details that support the main point of the text. A text with low coherence is difficult to understand, not well organized, or contains unnecessary details. Try to ignore the effects of grammar or spelling errors when assigning a coherence rating.
Expert Rater Annotation
We solicited judgments from 13 expert raters with previous annotation experience. We provided a high-level description of coherence but no detailed rubric, as we wanted them to use their own judgment. We also provided examples of low, medium, and high coherence along with a brief justification for each label. The raters went through a calibration phase during which we provided feedback about their judgments. In the annotation phase, we collected 3 expert rater judgments for each text.
Mechanical Turk Annotation
We collected 5 MTurk judgments for each text from a group of 62 Mechanical Turk annotators who passed our qualification test. We again provided a high-level description of coherence. However, we only provided a few examples for each category so as not to overwhelm the annotators.
We were mindful of how the characteristics of each domain might affect the resulting coherence scores. For example, after rating a batch of generally low coherence forum data, business emails may appear to be more coherent. However, our goal is to discover the characteristics of a low coherence business email or a low coherence forum post, not to compare the two domains. Therefore, we recruited new MTurk raters for each domain so as not to bias their scores. The same 13 expert raters worked on all four domains, but we specifically instructed them to consider whether each text was a coherent document for its domain.
2.5 Grammarly Corpus of Discourse Coherence
The resulting four domains each contain 1200 texts (1000 for training, 200 for testing). Each text has been scored as {low, medium, high} coherence by 5 MTurk raters and 3 expert raters. There is one consensus label for the expert ratings and another consensus label for the MTurk ratings. We computed the consensus label by averaging the integer values of the coherence ratings (low = 1, medium = 2, high = 3) over the MTurk or expert ratings and thresholding the mean coherence score (low medium high) to produce a 3-way classification label (Table 2). We observed that the MTurk raters tended to label more texts as “medium” coherence than the expert raters. Since the MTurk raters did not go through an extensive training session, they may be less confident in their ratings, defaulting to medium as the safe option.
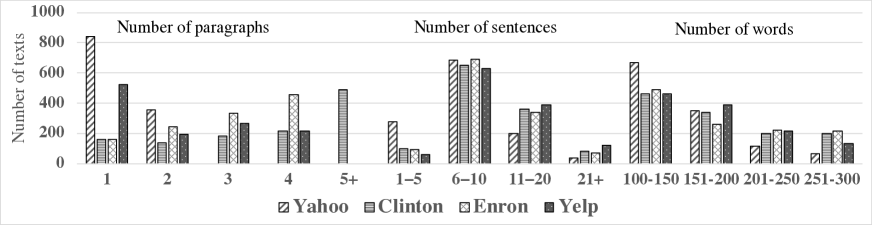
Table 3 contains type and token counts for the full dataset, and Figure 1 shows the number of paragraphs, sentences, and words per document.
| Coherence Class (%) | ||||
|---|---|---|---|---|
| Domain | Raters | Low | Med | High |
| Yahoo | untrained | 35.5 | 39.2 | 25.3 |
| expert | 46.6 | 17.4 | 37.0 | |
| Clinton | untrained | 36.7 | 38.6 | 24.7 |
| expert | 28.2 | 20.6 | 51.1 | |
| Enron | untrained | 34.9 | 44.2 | 20.9 |
| expert | 29.9 | 19.4 | 50.7 | |
| Yelp | untrained | 19.9 | 43.4 | 36.7 |
| expert | 27.1 | 21.8 | 51.1 | |
| Yahoo | Clinton | Enron | Yelp | |
| # types | 13,235 | 15,564 | 13,694 | 12,201 |
| # tokens | 189,444 | 220,115 | 223,347 | 213,852 |
2.6 Annotation Agreement
| Domain | Raters | ICC | Weighted |
|---|---|---|---|
| Yahoo | untrained | 0.113 0.024 | 0.060 0.013 |
| expert | 0.557 0.010 | 0.386 0.009 | |
| Clinton | untrained | 0.270 0.020 | 0.156 0.013 |
| expert | 0.398 0.015 | 0.250 0.011 | |
| Enron | untrained | 0.141 0.021 | 0.077 0.012 |
| expert | 0.428 0.014 | 0.273 0.011 | |
| Yelp | untrained | 0.120 0.026 | 0.069 0.014 |
| expert | 0.304 0.015 | 0.181 0.010 |
To quantify agreement among annotators, we follow Pavlick and Tetreault (2016)’s approach to simulate two annotators from crowdsourced labels. We repeat the simulation 1000 times and report the mean agreement values in Table 4 for both intraclass correlation (ICC) and quadratic weighted Cohen’s for an ordinal scale.
The expert raters have fair agreement Landis and Koch (1977) for three of the domains, but agreement among MTurk raters is quite low. These agreement numbers are the result of an extensive annotation development process and emphasize the difficulty of the task. We recommend that future work in this area leverages raters with a strong annotation background and the time for in-depth instructions. For evaluation, we use the consensus label from the expert judgments. For comparison, we include an experiment using MTurk consensus labels in the supplementary material.
3 Models
We evaluate a range of existing discourse coherence models on GCDC: entity-based models, a word embedding graph model, and neural network models. These models from previous work have been very effective on the sentence ordering task, but have not been used to produce coherence scores. We also introduce two new neural sequence models.
3.1 Baseline
We compute the Flesch-Kincaid grade level Kincaid et al. (1975) of each text and treat it as a coherence score. While Flesch-Kincaid is a readability measure, previous work has treated readability and text coherence as overlapping tasks Barzilay and Lapata (2008); Mesgar and Strube (2015). For coherence classification, we search over the grade level scores on the training data and select thresholds that result in the highest accuracy.
3.2 Entity-based Models
Entity-based models track entity mentions throughout the text. In the majority of our experiments, we applied Barzilay and Lapata (2008)’s coreference heuristic and consider two nouns to be coreferent only if they are identical. As Elsner and Charniak (2011) noted, automatic coreference resolution often fails to improve coherence modeling results. However, we also evaluate the effect of adding an automatic coreference system in Section 4.1.
Entity grid (EGrid)
The entity grid Barzilay and Lapata (2005) is a matrix that tracks entity mentions over sentences. We reimplemented the model from Barzilay and Lapata (2008), converting the entity grid into a feature vector that expresses the probabilities of local entity transitions. We use scikit-learn Pedregosa et al. (2011) to train a random forest classifier over the feature vectors.
Entity graph (EGraph)
The entity graph Guinaudeau and Strube (2013) interprets the entity grid as a graph whose nodes are sentences. Two nodes are connected if they share at least one entity. Graph edges can be weighted according to the number of entities shared, the syntactic roles of the entities, or the distance between sentences. The coherence score of a text is the average out-degree of its graph, so for classification we identify the thresholds that maximize accuracy on the training data.
Entity grid with convolutions (EGridConv)
Tien Nguyen and Joty (2017) applied a convolutional neural network to the entity grid to capture long-range transitions. We use the authors’ implementation.666https://github.com/datienguyen/cnn_coherence
3.3 Lexical Coherence Graph (LexGraph)
The lexical coherence graph Mesgar and Strube (2016) represents sentences as nodes of a graph, connecting nodes with an edge if the two sentences contain a pair of similar words (i.e. the cosine similarity of their pre-trained word vectors is greater than a threshold). From the graph, we can extract a feature vector that expresses the frequency of all -node subgraphs. We use the authors’ implementation777https://github.com/MMesgar/lcg and train a random forest classifier over the feature vectors.
3.4 Neural Network Models
We reimplemented a neural network model of coherence, the sentence clique model, to evaluate its effectiveness on GCDC. We also introduce two new neural network models that are more straightforward to implement than the clique model.
Sentence clique (Clique)
Li and Jurafsky (2017)’s model operates over cliques of adjacent sentences. For the sentence ordering task, a positive clique is a sequence of sentences from the original document. A negative clique is created by replacing the middle sentence of a positive clique with a random sentence from elsewhere in the text. The model contains a single LSTM Hochreiter and Schmidhuber (1997) that takes a sequence of GloVe word embeddings and produces a sentence vector at the final output step. All sentence vectors are concatenated and passed through a final layer to produce a probability that the clique is coherent. The final coherence score is the average of the scores of all cliques in the document.
We extend Clique to 3-class classification by labeling each clique with the document class label (low, medium, high). To predict the text label, the model averages the predicted coherence class distributions over all cliques.
Sentence averaging (SentAvg)
To investigate the extent to which sentence order is important in our data, we introduce a neural network model that ignores sentence order. The model contains a single LSTM that produces a sentence vector (the final output vector) from a sequence of GloVe embeddings for the words in that sentence. The document vector is the average over all sentence vectors in that document, and is passed through a hidden layer and a softmax to produce a distribution over coherence labels.
Paragraph sequence (ParSeq)
The role of paragraph breaks has not been explicitly discussed in previous work. Models like EGrid assume that entity transitions have the same weight whether adjacent sentences and occur in the same paragraph or different paragraphs. We expect paragraph breaks to be important for assessing coherence in longer documents.
Therefore, we introduce a paragraph sequence model, ParSeq, that can distinguish between paragraphs. ParSeq contains three stacked LSTMs: the first takes a sequence of GloVe embeddings to produce a sentence vector, the second takes a sequence of sentence vectors to produce a paragraph vector, and the third takes a sequence of paragraph vectors to produce a document vector. The document vector is passed through a hidden layer and a softmax to produce a distribution over coherence labels. A diagram of this model is available in the supplementary material.
4 Evaluation
We evaluate the models on multiple coherence prediction tasks. The best model parameters, reported in the supplementary material, are the result of 10-fold cross-validation over the training data.
For all neural models (EGridConv, EGridConv +coref, Clique, SentAvg, and ParSeq), the reported results are the mean of 10 runs with different random seeds, as suggested by Reimers and Gurevych (2017).
We indicate () when the best neural model result is significantly better () than the best non-neural result. We use the one-sample Wilcoxon signed rank test and adjusted the -values to account for the false discovery rate.
4.1 Classification
| Accuracy | ||||
| System | Yahoo | Clinton | Enron | Yelp |
| Majority class | 41.0 | 55.5 | 44.0 | 54.0 |
| Baseline | 43.5 | 56.0 | 52.5 | 55.0 |
| EGrid | 38.0 | 43.0 | 46.0 | 45.5 |
| EGrid +coref | 41.5 | 48.0 | 47.0 | 49.0 |
| EGraph | 40.0 | 56.0 | 43.5 | 53.0 |
| EGraph +coref | 42.5 | 55.0 | 44.0 | 54.0 |
| EGridConv | 47.0 | 56.3 | 44.8 | 54.2 |
| EGridConv +coref | 51.0 | 56.6 | 44.7 | 54.0 |
| LexGraph | 37.0 | 51.0 | 45.0 | 48.0 |
| Clique | 53.5 | 61.0† | 54.4† | 49.1 |
| SentAvg | 52.6 | 58.4 | 53.2 | 54.3 |
| ParSeq | 54.9† | 60.2 | 53.2 | 54.4† |
For this task, each text has a consensus label expressing how coherent it is: {low, medium, high}. We report overall accuracy for all systems on predicting the expert rater consensus label (Table 5). We repeated this evaluation using the MTurk rater labels and included those results in the supplementary material.
The neural models outperformed the entity-based and lexical graph models. Non-neural models showed mixed results, performing on par with or worse than our baseline. Most models perform poorly on Yelp, worse than the baseline, perhaps because Yelp has the lowest annotator agreement among expert raters.
We also tried adding coreference information for the entity-based methods, as it has been shown to be useful in some prior work Barzilay and Lapata (2008); Elsner and Charniak (2008). For the base entity model experiments, we used Barzilay and Lapata (2008)’s heuristic to determine whether two nouns are coreferent. For the coref setting, we used the Stanford coreference annotator Clark and Manning (2015) as a preprocessing step before computing the entity grid. The coreference system yielded consistent performance improvements of 1–5% accuracy over the corresponding heuristic results, indicating that automatic coreference resolution can help entity-based models in these domains.
| Spearman | ||||
| System | Yahoo | Clinton | Enron | Yelp |
| Baseline | 0.089 | 0.323 | 0.244 | 0.200 |
| EGrid | 0.110 | 0.146 | 0.168 | 0.121 |
| EGraph | 0.198 | 0.366 | 0.074 | 0.103 |
| EGridConv | 0.204 | 0.251 | 0.258 | 0.104 |
| LexGraph | 0.130 | 0.049 | 0.273 | |
| Clique | 0.474 | 0.474 | 0.416 | 0.304 |
| SentAvg | 0.466 | 0.505† | 0.438 | 0.311 |
| ParSeq | 0.519† | 0.448 | 0.454† | 0.329† |
4.2 Score Prediction
A 3-point coherence score might not reflect the range of coherence that actually exists in the data. We can instead present a more fine-grained score prediction task where the gold score is the mean of the three expert rater judgments (low coherence = 1, medium = 2, high = 3). In Table 6, we report Spearman’s rank correlation coefficient between the gold scores and the predicted coherence scores. As in the classification task, the neural methods convincingly outperformed all other methods, with ParSeq the top performer in three out of four domains.
4.3 Sentence Ordering
The sentence ordering ranking task is a somewhat artificial evaluation, as a document whose sentences have been randomly shuffled does not resemble a human-written text that is not very coherent. However, we still want to assess whether good performance on previous sentence ordering datasets translates to GCDC. Since the sentence ordering task assumes well-formed texts, we use only the high coherence texts. As a result, there are fewer texts than for the classification task, as we show below. The number of training examples is 20 times the number of texts, as we generate 20 random permutations for each text.
| Yahoo | Clinton | Enron | Yelp | |
|---|---|---|---|---|
| Train texts | 369 | 511 | 507 | 511 |
| Test texts | 76 | 111 | 88 | 108 |
Table 7 shows the accuracy of each system on identifying the original text in each (original, permuted) text pair. We leave out the baseline and SentAvg because they ignore sentence order. We also simplify ParSeq to a sentence sequence model (SentSeq) containing only two LSTMs because the sentence ordering task ignores paragraph information. As in the prior two evaluations, the neural models perform best in most domains, although EGraph is best on Yahoo.
| Accuracy | ||||
| System | Yahoo | Clinton | Enron | Yelp |
| Random baseline | 50.0 | 50.0 | 50.0 | 50.0 |
| EGrid | 55.9 | 78.2 | 77.4 | 62.9 |
| EGraph | 64.0 | 75.3 | 75.9 | 59.5 |
| EGridConv | 54.8 | 75.5 | 73.1 | 58.7 |
| LexGraph | 62.5 | 78.3 | 77.9 | 60.8 |
| Clique | 57.8 | 89.4† | 88.7† | 64.6 |
| SentSeq | 58.3 | 88.0 | 87.1 | 74.2† |
| System | Yahoo | Clinton | Enron | Yelp |
|---|---|---|---|---|
| Baseline | 0.283 | 0.255 | 0.341 | 0.197 |
| EGrid | 0.258 | 0.260 | 0.294 | 0.161 |
| EGraph | 0.308 | 0.382 | 0.278 | 0.117 |
| EGridConv | 0.360 | 0.238 | 0.279 | 0.169 |
| LexGraph | 0.342 | 0.094 | 0.357 | 0.000 |
| Clique | 0.055 | 0.000 | 0.077 | 0.146 |
| SentAvg | 0.481† | 0.332 | 0.393† | 0.199 |
| ParSeq | 0.447 | 0.296 | 0.373 | 0.112 |
4.4 Minority Class Classification
One application of a coherence classification system would be to provide feedback to writers by flagging text that is not very coherent. Such a system should identify only the most incoherent areas of the text, to ensure that the feedback is not a false positive. To evaluate this scenario, we present a minority class classification problem where only 15-20% of the data is low coherence:
| Yahoo | Clinton | Enron | Yelp | |
| Low coherence % | 30.0 | 16.6 | 18.4 | 14.8 |
We relabel a text as low coherence if at least two expert annotators judged the text to be low coherence, and relabel as not low coherence otherwise.
We report the score of the low coherence class in Table 8, where precision is emphasized twice as much as recall.888Precision and recall are in the supplementary material. This is in line with evaluation standards in other writing feedback applications Ng et al. (2014). Again, the neural models perform best in most domains. However, the results of this experiment in particular show that there is still a large gap between the performance of these models and what might be required for high-precision real-world applications.
4.5 Cross-Domain Classification
Up to this point, we assumed that the four domains are different enough from one another that we should train separate models for each. To test this assumption, we train ParSeq, one of the top performing neural models, in one domain (e.g. Yahoo) and evaluate it in a different domain (Clinton, Enron, and Yelp). Table 9 compares the in-domain results (the diagonal) to the cross-domain results.
| Test | |||||
|---|---|---|---|---|---|
| Yahoo | Clinton | Enron | Yelp | ||
| Train | Yahoo | 54.9 | 56.7 | 50.6 | 55.3 |
| Clinton | 51.8 | 60.2 | 50.7 | 40.4 | |
| Enron | 51.5 | 59.9 | 53.2 | 50.8 | |
| Yelp | 48.3 | 55.5 | 44.0 | 54.4 | |
While the model’s accuracy generally decreases when transferred to a different domain, sometimes this decrease is not too severe: for example, training on Yahoo/Enron data and testing on Clinton data, or training on Yahoo data and testing on Yelp data. It is reasonable that training on one set of business emails (Clinton or Enron) produces a model that can accurately score the coherence of other sets of business emails. Similarly, both Yahoo and Yelp contain online text written for public consumption which may share coherence characteristics, so it is not surprising that a model trained on Yahoo data works on Yelp (even outperforming the Yelp-trained model).
These results indicate that we might be able to train a better coherence model by combining all our data across multiple domains. We evaluate this theory in Table 10, comparing the results of the ParSeq model evaluated in-domain (e.g. trained and tested on Yahoo data) to a model trained on the combined training data from all four domains. With four times as much training data, the performance of ParSeq improves in all domains, indicating that better coherence models may be trained from data outside of a specific, narrow domain.
| Test accuracy | ||||
|---|---|---|---|---|
| Yahoo | Clinton | Enron | Yelp | |
| Train in-domain | 54.9 | 60.2 | 53.2 | 54.4 |
| Train all data | 58.5 | 61.0 | 53.9 | 56.5 |
4.6 Discussion
We observe some trends across our experiments. The basic entity models (EGrid and EGraph) tend to perform poorly, often barely outperforming the baseline. The entity grids computed from GCDC texts are often extremely sparse, so meaningful entity transitions between sentences are infrequent. In addition, scoring the coherence of a text (either classification or score prediction) is more difficult than the sentence ordering task, where basic entity models do outperform the random baseline by a reasonable margin. Both the data and the difficulty of the tasks contribute to poor performance from the basic entity models.
The neural network models almost always outperform other models. This supports Li and Jurafsky (2017)’s claim that neural models are better able to extend to other domains compared to previous coherence models. Our ParSeq and SentAvg models are easier to implement than Clique and outperform Clique on a majority of experiments. EGridConv usually does not perform as well as the other neural models, but it usually improves over EGrid.
Finally, the relative success of SentAvg, which ignores sentence order, is evidence that identifying a document’s original sentence order is not the same as distinguishing low and high coherence documents. The large number of parameters in ParSeq may explain why it is sometimes outperformed by SentAvg.
5 Analysis
To better understand what distinguishes a low coherence text from a high coherence text, we manually analyzed Yahoo and Clinton texts whose labels were unanimously agreed on by all three raters. Regardless of the domain, many low coherence texts are not well-organized and appear to be written almost as stream of consciousness. They often lack connectives, resembling a list of points rather than a coherent document.
Incoherent Yahoo texts often contain extremely long sentences, lack paragraph breaks, and veer off-topic without a transition or any connection back to the main point. This is an especially frequent occurrence with personal anecdotes.
Low coherence Clinton emails make better use of paragraphs, but they too often lack transitions between topics. In addition, missing information was a primary reason for low coherence scores. We provided the raters with individual emails, not the entire email thread, so raters had less information than the original recipient of the email. This amplifies the detrimental effects on coherence of jargon, abbreviation, and missing context. However, overuse of these compression strategies can result in low coherence even for the intended recipient, so it is worth modeling their effects.
Across domains, coherent texts have a clear topic that is maintained throughout the text, and they are well-organized, with sentences, paragraphs and sub-topics following a logical ordering. Connectives, such as however, for example, in turn, also, in addition are used more frequently to assist the structure and flow.
Although sentence order is clearly important, rewriting a disorganized text is not as simple as reordering sentences. Even if changing the location of one sentence increases coherence, a true fix would still require rewriting that sentence or the surrounding sentences. Our analysis indicates that the sentence reordering task is not a good evaluation of whether models can truly be useful to the task of identifying low coherence texts.
6 Conclusion
In this paper, we examine the evaluation of discourse coherence by presenting a new corpus (GCDC) to benchmark leading methods on real-world data in four domains. While neural models outperform others across multiple evaluations, much work remains before any of these methods can be used for real-world applications. That said, our SentAvg and ParSeq models serve as simple and effective methods to use in future work.
We recommend that future evaluations move away from the sentence ordering task. While it is an easy evaluation to carry out, the performance numbers overpredict the success of those systems in real-world conditions. For example, prior evaluations Tien Nguyen and Joty (2017); Li and Jurafsky (2017) report performance numbers around or above 90% accuracy, which contrasts with the much lower figures shown in this paper. In addition, we recommend that future annotation efforts leverage expert raters, preferably with a background in annotation, as this task is difficult for untrained workers on crowdsourcing platforms.
By releasing GCDC, the annotation guidelines, and our code, we hope to encourage future work on more realistic coherence tasks.
Acknowledgments
The authors would like to thank Yahoo Research and Yelp for making their data available, and Jiwei Li and Mohsen Mesgar for sharing their code. Thanks also to Michael Strube, Annie Louis, Rebecca Hwa, Dimitrios Alikaniotis, Claudia Leacock, Courtney Napoles, Jill Burstein, Mirella Lapata, Martin Chodorow, Micha Elsner, and the anonymous reviewers for their helpful comments.
References
- Barzilay and Lapata (2005) Regina Barzilay and Mirella Lapata. 2005. Modeling local coherence: An entity-based approach. In Proceedings of the 43rd Annual Meeting of the Association for Computational Linguistics (ACL’05). Association for Computational Linguistics, Ann Arbor, Michigan, pages 141–148. https://doi.org/10.3115/1219840.1219858.
- Barzilay and Lapata (2008) Regina Barzilay and Mirella Lapata. 2008. Modeling local coherence: An entity-based approach. Computational Linguistics 34(1):1–34. https://doi.org/10.1162/coli.2008.34.1.1.
- Burstein et al. (2010) Jill Burstein, Joel Tetreault, and Slava Andreyev. 2010. Using entity-based features to model coherence in student essays. In Human Language Technologies: The 2010 Annual Conference of the North American Chapter of the Association for Computational Linguistics. Association for Computational Linguistics, pages 681–684. http://www.aclweb.org/anthology/N10-1099.
- Burstein et al. (2013) Jill Burstein, Joel R. Tetreault, and Martin Chodorow. 2013. Holistic discourse coherence annotation for noisy essay writing. D&D 4(2):34–52. http://dad.uni-bielefeld.de/index.php/dad/article/view/2825.
- Clark and Manning (2015) Kevin Clark and Christopher D. Manning. 2015. Entity-centric coreference resolution with model stacking. In Association for Computational Linguistics (ACL).
- Elsner and Charniak (2008) Micha Elsner and Eugene Charniak. 2008. Coreference-inspired coherence modeling. In Proceedings of ACL-08: HLT, Short Papers. Association for Computational Linguistics, Columbus, Ohio, pages 41–44. http://www.aclweb.org/anthology/P/P08/P08-2011.
- Elsner and Charniak (2011) Micha Elsner and Eugene Charniak. 2011. Extending the entity grid with entity-specific features. In Proceedings of the 49th Annual Meeting of the Association for Computational Linguistics: Human Language Technologies. Association for Computational Linguistics, Portland, Oregon, USA, pages 125–129. http://www.aclweb.org/anthology/P11-2022.
- Feng et al. (2014) Vanessa Wei Feng, Ziheng Lin, and Graeme Hirst. 2014. The impact of deep hierarchical discourse structures in the evaluation of text coherence. In Proceedings of COLING 2014, the 25th International Conference on Computational Linguistics: Technical Papers. Dublin City University and Association for Computational Linguistics, Dublin, Ireland, pages 940–949. http://www.aclweb.org/anthology/C14-1089.
- Grosz et al. (1995) Barbara J. Grosz, Scott Weinstein, and Aravind K. Joshi. 1995. Centering: A framework for modeling the local coherence of discourse. Computational Linguistics 21(2):203–225. http://dl.acm.org/citation.cfm?id=211190.211198.
- Guinaudeau and Strube (2013) Camille Guinaudeau and Michael Strube. 2013. Graph-based local coherence modeling. In Proceedings of the 51st Annual Meeting of the Association for Computational Linguistics (Volume 1: Long Papers). Association for Computational Linguistics, Sofia, Bulgaria, pages 93–103. http://www.aclweb.org/anthology/P13-1010.
- Hochreiter and Schmidhuber (1997) Sepp Hochreiter and Jürgen Schmidhuber. 1997. Long short-term memory. Neural Computation 9(8):1735–1780. https://doi.org/10.1162/neco.1997.9.8.1735.
- Kincaid et al. (1975) J. Peter Kincaid, Robert P. Fishburne Jr., Richard L. Rogers, and Brad S. Chissom. 1975. Derivation of new readability formulas (automated readability index, fog count and Flesch reading ease formula) for navy enlisted personnel. Technical Report, DTIC Document.
- Landis and Koch (1977) J. Richard Landis and Gary G. Koch. 1977. The measurement of observer agreement for categorical data. Biometrics 33(1):159–174. http://www.jstor.org/stable/2529310.
- Lapata (2003) Mirella Lapata. 2003. Probabilistic text structuring: Experiments with sentence ordering. In Proceedings of the 41st Annual Meeting of the Association for Computational Linguistics. Association for Computational Linguistics, Sapporo, Japan, pages 545–552. https://doi.org/10.3115/1075096.1075165.
- Li and Hovy (2014) Jiwei Li and Eduard Hovy. 2014. A model of coherence based on distributed sentence representation. In Proceedings of the 2014 Conference on Empirical Methods in Natural Language Processing (EMNLP). Association for Computational Linguistics, Doha, Qatar, pages 2039–2048. http://www.aclweb.org/anthology/D14-1218.
- Li and Jurafsky (2017) Jiwei Li and Dan Jurafsky. 2017. Neural net models of open-domain discourse coherence. In Proceedings of the 2017 Conference on Empirical Methods in Natural Language Processing. Association for Computational Linguistics, Copenhagen, Denmark, pages 198–209. https://www.aclweb.org/anthology/D17-1019.
- Lin et al. (2011) Ziheng Lin, Hwee Tou Ng, and Min-Yen Kan. 2011. Automatically evaluating text coherence using discourse relations. In Proceedings of the 49th Annual Meeting of the Association for Computational Linguistics: Human Language Technologies. Association for Computational Linguistics, Portland, Oregon, USA, pages 997–1006. http://www.aclweb.org/anthology/P11-1100.
- Louis and Nenkova (2012) Annie Louis and Ani Nenkova. 2012. A coherence model based on syntactic patterns. In Proceedings of the 2012 Joint Conference on Empirical Methods in Natural Language Processing and Computational Natural Language Learning. Association for Computational Linguistics, Jeju Island, Korea, pages 1157–1168. http://www.aclweb.org/anthology/D12-1106.
- Mesgar and Strube (2015) Mohsen Mesgar and Michael Strube. 2015. Graph-based coherence modeling for assessing readability. In Proceedings of the Fourth Joint Conference on Lexical and Computational Semantics. Association for Computational Linguistics, Denver, Colorado, pages 309–318. http://www.aclweb.org/anthology/S15-1036.
- Mesgar and Strube (2016) Mohsen Mesgar and Michael Strube. 2016. Lexical coherence graph modeling using word embeddings. In Proceedings of the 2016 Conference of the North American Chapter of the Association for Computational Linguistics: Human Language Technologies. Association for Computational Linguistics, San Diego, California, pages 1414–1423. http://www.aclweb.org/anthology/N16-1167.
- Morris and Hirst (1991) Jane Morris and Graeme Hirst. 1991. Lexical cohesion computed by thesaural relations as an indicator of the structure of text. Computational Linguistics 17(1):21–48. http://dl.acm.org/citation.cfm?id=971738.971740.
- Ng et al. (2014) Hwee Tou Ng, Siew Mei Wu, Ted Briscoe, Christian Hadiwinoto, Raymond Hendy Susanto, and Christopher Bryant. 2014. The CoNLL-2014 shared task on grammatical error correction. In Proceedings of the Eighteenth Conference on Computational Natural Language Learning: Shared Task. Association for Computational Linguistics, Baltimore, Maryland, pages 1–14. http://www.aclweb.org/anthology/W14-1701.
- Pavlick and Tetreault (2016) Ellie Pavlick and Joel Tetreault. 2016. An empirical analysis of formality in online communication. Transactions of the Association for Computational Linguistics 4:61–74.
- Pedregosa et al. (2011) F. Pedregosa, G. Varoquaux, A. Gramfort, V. Michel, B. Thirion, O. Grisel, M. Blondel, P. Prettenhofer, R. Weiss, V. Dubourg, J. Vanderplas, A. Passos, D. Cournapeau, M. Brucher, M. Perrot, and E. Duchesnay. 2011. Scikit-learn: Machine learning in Python. Journal of Machine Learning Research 12:2825–2830.
- Reimers and Gurevych (2017) Nils Reimers and Iryna Gurevych. 2017. Reporting score distributions makes a difference: Performance study of LSTM-networks for sequence tagging. In Proceedings of the 2017 Conference on Empirical Methods in Natural Language Processing. Association for Computational Linguistics, Copenhagen, Denmark, pages 338–348. https://www.aclweb.org/anthology/D17-1035.
- Somasundaran et al. (2014) Swapna Somasundaran, Jill Burstein, and Martin Chodorow. 2014. Lexical chaining for measuring discourse coherence quality in test-taker essays. In Proceedings of COLING 2014, the 25th International Conference on Computational Linguistics: Technical Papers. Dublin City University and Association for Computational Linguistics, Dublin, Ireland, pages 950–961. http://www.aclweb.org/anthology/C14-1090.
- Tien Nguyen and Joty (2017) Dat Tien Nguyen and Shafiq Joty. 2017. A neural local coherence model. In Proceedings of the 55th Annual Meeting of the Association for Computational Linguistics (Volume 1: Long Papers). Association for Computational Linguistics, Vancouver, Canada, pages 1320–1330. http://aclweb.org/anthology/P17-1121.
Appendix A Supplementary Material
A.1 Corpus Examples
Table 11 contains additional examples of texts from our corpus, specifically from the Yahoo Answers domain, with their coherence labels.
| Domain | Score | Text |
|---|---|---|
| Yahoo | Low | I see it, but then again almost every war entered by the U.S. is connected to gaining something. The U.S. is just using politically correct was of taking over a country without anybody noticing it. They enter a war and some how we come out better than the country we went in to help. We say we are helping but if the country has nothing for us then we don’t bother with it. For example: Korea stated and I quote “we have nuclear weapons and we plan to use them” so how come we are in Iraq who have no weapons? Well maybe the U.S. sees no threat but then again somebody did sneak into the country and take over planes. Also not to long ago it was common for somebody to hijack a plane. Well that is all I have to say on the matter. |
| Yahoo | High | Don’t be intimidated by Impressionism. It is simply a style worked in loose strokes. The idea is to give an “impression” of the subject. Choose a simple subject, like a still life or bowl of fruit. Then layout your palette using the colors you see (make sure to look for subtle colors only an artist might see…such as the “blue” in an apple), and with a larger than usual brush, stroke the basic shapes in a medium value, then add shadows, then a highlight layer. That should do for a class project in Impressionism. The danger would come from over-working the painting. You don’t want fine strokes or details, remember just the “impression” of your subject. The whole idea is to stay loose and free. A lot of people struggle with it. The trick is to just paint without worrying too much. Good luck. |
A.2 Annotator Instructions
The annotation instructions in Section 2.4 are the simplified instructions that we provided to Mechanical Turk workers. The expert annotators received a longer version of those instructions, which are available in Table 12.
| You will be given a short text (100-300 words) to read. We will specify which one of several domains the text comes from, and in some domains we will provide additional context for the text. |
| Your task is to rate the coherence of the text from 1 to 3 (1 means low coherence, 3 means high coherence). |
| Coherence in writing refers to how well ideas flow from one sentence to the next, and from one paragraph to the next. A text that is highly coherent is easy to understand and easy to read. This usually means the text is well-organized, logically structured, and presents only information that supports the main idea. On the other hand, a text with low coherence is difficult to understand. This may be because the text is not well organized, contains unrelated information that distracts from the main idea, or lacks transitions to connect the ideas in the text. |
| Try to ignore the effects of grammar or spelling errors when assigning a coherence rating, as long as the errors do not significantly interfere with your ability to read and understand the text. In the email data, assume that jargon and acronyms are used correctly, and do your best to judge coherence despite that. |
| You should assign a coherence rating to the text based on whether it is a coherent example of text in that domain. A reader has different expectations about how a business email should be written compared to a post on an online forum, and the coherence rating should reflect this difference. A business email with a score of 1 is not necessarily incoherent in the same way that a very incoherent Yahoo Answers post is, but it is not very coherent for a business email. |
A.3 Model Details
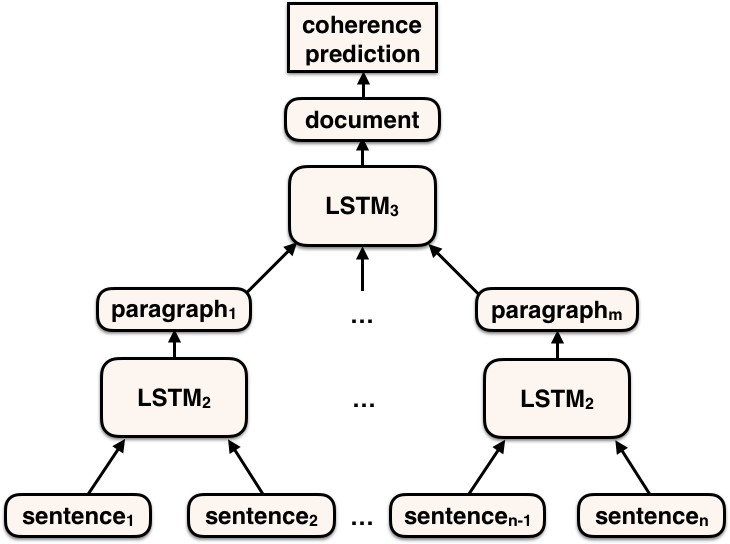
Figure 2 shows the structure of ParSeq. The sentence vectors pictured are the output at the final timestep from the first LSTM (not pictured), which takes GloVe word embeddings as input. A second LSTM takes these sentence vectors as input and produces paragraph vectors, and a third LSTM takes a sequence of paragraph vectors and produces a single document vector.
| Accuracy | ||||
| System | Yahoo | Clinton | Enron | Yelp |
| Majority class | 39.5 | 40.5 | 44.0 | 40.5 |
| Baseline | 35.0 | 43.5 | 45.0 | 41.5 |
| EGrid | 43.0 | 41.0 | 45.5 | 43.0 |
| EGraph | 39.5 | 41.5 | 44.5 | 40.5 |
| EGridConv | 41.0 | 43.5 | 44.5 | 54.0 |
| LexGraph | 38.0 | 36.0 | 48.0 | 45.5 |
| Clique | 48.0 | 45.0 | 52.5 | 51.0 |
| SentAvg | 52.0 | 48.5 | 55.5 | 49.0 |
| ParSeq | 47.5 | 51.0 | 56.5 | 57.5 |
A.4 Additional Results
Table 13 contains the classification test results of all systems when the consensus labels come from the Mechanical Turk judgments rather than the expert judgments.
| System | Yahoo | Clinton | Enron | Yelp | ||||
|---|---|---|---|---|---|---|---|---|
| p | r | p | r | p | r | p | r | |
| Baseline | 25 | 61 | 26 | 24 | 33 | 38 | 17 | 42 |
| EGrid | 31 | 16 | 36 | 12 | 57 | 10 | 33 | 5 |
| EGraph | 26 | 94 | 35 | 58 | 25 | 45 | 10 | 68 |
| EGridConv | 31 | 41 | 16 | 24 | 22 | 40 | 50 | 05 |
| LexGraph | 26 | 29 | 20 | 3 | 55 | 15 | 0 | 0 |
| Clique | 7 | 3 | 0 | 0 | 17 | 3 | 100 | 05 |
| SentAvg | 38 | 73 | 39 | 36 | 42 | 33 | 36 | 21 |
| ParSeq | 43 | 51 | 21 | 39 | 57 | 20 | 13 | 11 |
Table 14 contains the precision and recall results for the minority class classification test. For neural models, we report precision and recall for one run on test (F0.5 scores in Section 4.4 were averaged over 10 runs).
| System | Accuracy |
|---|---|
| Random baseline | 50.0 |
| EGrid | 83.0 |
| EGraph | 65.7 |
| EGridConv | 82.2 |
| LexGraph | 72.7 |
| Clique | 60.9 |
| SentSeq | 74.1 |
To compare all models on an established dataset, we report results on the sentence ordering task using the Wall Street Journal (WSJ) portion of the Penn Treebank. Following previous work, we use 20 random permutations of each article and the train/test split defined by Tien Nguyen and Joty (2017) (train = Section 00-13, test = 14-24). Table 15 contains the results of all models on WSJ. These results verify our re-implementation of the EGrid model, as well as establishing the reasonable performance of our neural sequence model on news text.
A.5 Model Parameters
We specify the parameters for all models and experiments in Tables 16 and 17. Additionally, for the combined training data experiment (Table 10 in the paper), we train parseq with LSTM dimensionality = 100, hidden layer = 200, dropout = 0.5.
EGrid
Sequence length is the length of the transition sequences used to compute the feature vector from the entity grid. For salience, we follow Barzilay and Lapata (2008) and split entities into two salience classes (doubling the number of features) based on whether their frequency is greater than the salience threshold. (Salience = off means that there is only one salience class containing all entities.) Syntax indicates whether we consider grammatical roles (subject, object, other) in building the entity grid.
EGraph
The graph type specifies whether we use an unweighted graph (u), a graph weighted by the number of entities shared between sentences (w), or a graph weighted by syntactic role information (syn). Distance indicates whether edge weights are decreased according to the distance between sentences.
EGridConv
We specify dropout rate, batch size, and entity role embedding size. For the convolution layer, we specify filter number, window size, and pooling length.
LexGraph
We define the similarity threshold used to filter out edge weights between sentences, and k as the size of the subgraphs we consider when extracting features from the document graph.
Clique
We define the dropout rate, the LSTM dimensionality, and the hidden layer dimensionality. Window size is the number of sentences in a clique.
SentAvg, ParSeq
For both models, we specify the dropout rate, the LSTM dimensionality, and the hidden layer dimensionality. For ParSeq, the LSTM dimensionality applies to all 3 LSTMs.
| Classification | Score Prediction | ||||||||
| Model | Parameter | Yahoo | Clinton | Enron | Yelp | Yahoo | Clinton | Enron | Yelp |
| Baseline | threshold1 | 6.5 | 6.5 | 6.0 | 2.5 | – | – | – | – |
| threshold2 | 7.0 | 7.0 | 6.5 | 3.0 | – | – | – | – | |
| EGrid | sequence length | 4 | 3 | 4 | 2 | 2 | 2 | 4 | 3 |
| salience threshold | off | 2 | 4 | 4 | 2 | off | 3 | 2 | |
| syntax | on | off | on | on | off | off | on | on | |
| EGraph | graph type | syn | syn | syn | syn | u | w | w | syn |
| distance | no | no | no | no | yes | yes | yes | no | |
| threshold1 | 15.0 | 0.1 | 0.1 | 0.5 | – | – | – | – | |
| threshold2 | 16.0 | 1.1 | 1.1 | 1.6 | – | – | – | – | |
| EGridConv | dropout | 0.2 | 0.2 | 0.5 | 0.2 | 0.2 | 0.5 | 0.5 | 0.2 |
| filter | 100 | 100 | 100 | 200 | 200 | 200 | 200 | 100 | |
| window | 4 | 2 | 2 | 6 | 2 | 2 | 2 | 4 | |
| pool | 3 | 7 | 3 | 5 | 5 | 3 | 3 | 3 | |
| batch | 128 | 128 | 32 | 128 | 32 | 32 | 32 | 32 | |
| embedding size | 100 | 100 | 100 | 200 | 100 | 200 | 200 | 100 | |
| LexGraph | threshold | 0.7 | 0.5 | 0.7 | 0.9 | 0.5 | 0.3 | 0.7 | 0.9 |
| k | 6 | 6 | 6 | 5 | 6 | 6 | 4 | 5 | |
| Clique | dropout | 0.5 | 0.5 | 0.5 | 0.5 | 0.5 | 0.5 | 0.5 | 0.5 |
| LSTM dim | 100 | 100 | 200 | 100 | 100 | 100 | 200 | 100 | |
| hidden dim | 200 | 200 | 200 | 200 | 200 | 200 | 200 | 100 | |
| window size | 3 | 3 | 3 | 7 | 7 | 7 | 7 | 4 | |
| SentAvg | dropout | 0.5 | 0.5 | 0.5 | 0.2 | 0.2 | 0.5 | 0.5 | 0.2 |
| LSTM dim | 200 | 50 | 200 | 50 | 300 | 300 | 300 | 300 | |
| hidden dim | 200 | 50 | 100 | 300 | 100 | 100 | 50 | 50 | |
| ParSeq | dropout | 0.5 | 0.5 | 0.5 | 0.5 | 0.5 | 0.2 | 0.5 | 0.2 |
| LSTM dim | 200 | 300 | 50 | 50 | 300 | 200 | 100 | 300 | |
| hidden dim | 100 | 100 | 100 | 200 | 100 | 50 | 100 | 100 | |
| Sentence Ordering | Minority Class | |||||||||
| Model | Parameter | Yahoo | Clinton | Enron | Yelp | WSJ | Yahoo | Clinton | Enron | Yelp |
| Baseline | threshold1 | – | – | – | – | – | 8.0 | 6.5 | 6.0 | 5.0 |
| threshold2 | – | – | – | – | – | – | – | – | – | |
| EGrid | sequence length | 4 | 4 | 4 | 4 | 3 | 2 | 2 | 2 | 3 |
| salience threshold | 4 | off | 4 | off | 4 | off | off | 2 | 2 | |
| syntax | on | on | off | on | on | off | off | on | off | |
| EGraph | graph type | syn | w | w | w | w | u | w | w | w |
| distance | yes | yes | yes | yes | yes | yes | yes | yes | no | |
| threshold1 | – | – | – | – | – | 1.2 | 0.5 | 0.9 | 2.2 | |
| threshold2 | – | – | – | – | – | – | – | – | – | |
| EGridConv | dropout | 0.2 | 0.2 | 0.2 | 0.2 | 0.5 | 0.2 | 0.5 | 0.5 | 0.5 |
| filter | 100 | 100 | 100 | 100 | 150 | 100 | 200 | 200 | 200 | |
| window | 6 | 6 | 4 | 6 | 6 | 2 | 4 | 6 | 6 | |
| pool | 7 | 7 | 7 | 7 | 6 | 3 | 3 | 5 | 7 | |
| batch | 32 | 32 | 32 | 128 | 128 | 128 | 32 | 32 | 32 | |
| embedding size | 200 | 100 | 200 | 100 | 100 | 100 | 200 | 100 | 200 | |
| LexGraph | threshold | 0.9 | 0.9 | 0.9 | 0.9 | 0.3 | 0.5 | 0.7 | 0.5 | 0.9 |
| k | 4 | 3 | 4 | 4 | 4 | 4 | 3 | 3 | 3 | |
| Clique | dropout | 0.5 | 0.2 | 0.2 | 0.2 | 0.2 | 0.2 | 0.2 | 0.5 | 0.2 |
| LSTM dim | 100 | 100 | 100 | 300 | 300 | 50 | 50 | 50 | 50 | |
| hidden dim | 100 | 100 | 50 | 50 | 50 | 50 | 300 | 50 | 200 | |
| window size | 7 | 5 | 5 | 5 | 7 | 5 | 7 | 5 | 7 | |
| SentAvg | dropout | – | – | – | – | – | 0.2 | 0.5 | 0.2 | 0.2 |
| LSTM dim | – | – | – | – | – | 200 | 200 | 50 | 200 | |
| hidden dim | – | – | – | – | – | 300 | 200 | 50 | 50 | |
| ParSeq | dropout | 0.5 | 0.2 | 0.2 | 0.2 | 0.5 | 0.5 | 0.2 | 0.5 | 0.2 |
| LSTM dim | 50 | 300 | 300 | 300 | 300 | 100 | 50 | 200 | 300 | |
| hidden dim | 200 | 300 | 200 | 100 | 200 | 50 | 300 | 50 | 100 | |