Control of DNA denaturation bubble nucleation to advance nano-biosensing
Abstract
In the demanding biosensing environment, improving selection efficiency strategies has become an issue of great significance. DNA minicircles containing between and base-pairs, also named microDNA, are representative of the supercoiled DNA loops found in nature. Their short size makes them extremely susceptible to writhe and twist, which is known to play a central role in DNA denaturation. We investigate minicircle lengths and superhelical densities that induce DNA denaturation bubbles of nanometer size and control well-defined long-life. Mesoscopic modeling and accelerated dynamics simulations allow us to study accurately the thermodynamic and dynamical properties associated with the nucleation and closure mechanisms of long-lived denaturation bubbles. Our results pave the way for new types of DNA biosensors with enhanced selectivity for specific DNA binding proteins.
Biosensors, i.e. analytical devices employing biological recognition properties for a selective bio-analysis Vigneshvar et al. (2016), have become very popular in recent years owning to their wide range of applications including clinical Anjum and Pundir (2007), environmental Maseini (2001) and food analysis Eden-Firstenberg and Schaertel (1988). Since the invention of the first glucometer by Clark and Lyons Jr. and Lyons (1962), biosensors have been developed for many different analytes, which range in size from individual ions Han et al. (2013) to bacteria Ahmed et al. (2014). Due to their wide range of physical, chemical and biological activities, nucleic acid based biosensors have become increasingly important for rapid genetic screening and detection Brunet et al. (2015); Kavita (2017). DNA interactions with proteins present specific challenges, such as the detection and measure of the levels of specific proteins in biological and environmental samples. As their detection, identification and quantification can be very complex, expensive and time consuming, the selection of highly efficient sensors is now required Ritzefeld and Sewald (2011); Crawford et al. (2012); Zhou et al. (2014).
Both chemical and mechanical properties of the three dimensional structure of the DNA double helix have been examined to decipher the activity of specific target proteins Crawford et al. (2012); Zhou et al. (2014). Although the DNA macromolecule manifests more thermally driven opening of consecutive base-pairs (bps), also named breathing fluctuations, at physiological temperatures von Hippel et al. (2013), duplex opening can also be at play when non-linear elastic properties of DNA are involved. This commonly happens when the molecule is strongly bent Destainville et al. (2009) or negatively supercoiled Adamcik et al. (2012). Various experimental Altan-Bonnet et al. (2003) and analytical Ambjornsson and Metzler (2005); Metzler et al. (2009); Sicard et al. (2015) models have been proposed in the literature to account for the thermodynamic and dynamical properties of denaturation bubbles. Yet this mechanical property of DNA has remained underused in the biosensing framework. Shi et al have recently taken advantage of the existence of small breathing bubbles to induce isothermal polymerase chain reaction Shi et al. (2016). However, long-lived denaturation bubbles extending over more than bps have not yet given rise to any biosensing application. This is largely due to poor knowledge of their properties.
Here we elucidate the key parameters to obtain long-lived bubbles at room temperature
and we show how both their thermodynamic and dynamical properties could be worthwhile for various types of biosensors.
We consider DNA minicircles containing between and bps,
also named microDNA, as they are representative of the supercoiled DNA loops found
in nature Shibata et al. (2012) and have a suitable size for exploring
the relationship between twist and writhe Irobalieva et al. (2015).
To overcome the inherent limitations of atomistic simulations encountered at length- and time-scales
of interest Manghi and
Destainville (2016), mesoscopic modeling Sicard et al. (2015)
is combined with accelerated dynamics simulations Tiwary and
Parrinello (2013); Sicard (2018)
to study accurately the free energy landscape and the equilibrium rates associated with
the nucleation/closure mechanisms of the long-lived denaturation bubbles.
We show how specific tuning of DNA structural parameters, such as the size and degree of supercoiling can lead to
a large variety of equilibrium closure/nucleation rates that can be seen as dynamical bandwidth
to advance the specificity of the biosensing probe and to reduce further the experimental setup complexity.
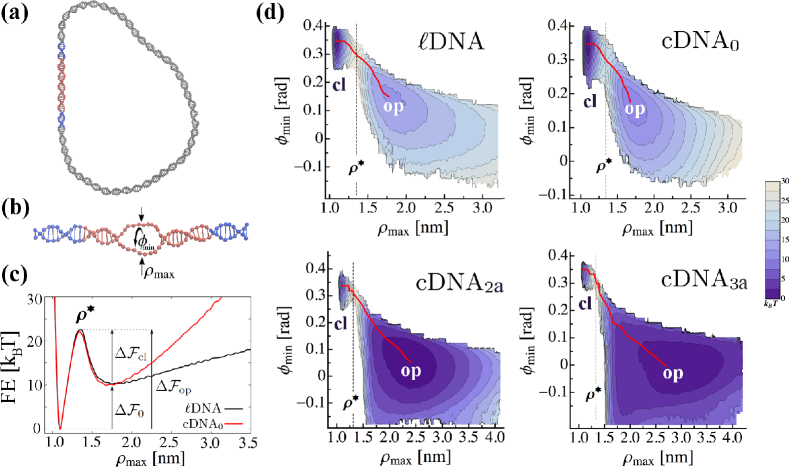
The double-stranded DNA (dsDNA) minicircle Mielke et al. (2005) is described at a mesoscopic scale, where the two single strands are modeled as freely rotating chains of beads of diameter nm with a AT-rich region of bps clamped by a closed circular GC region of bps Sicard et al. (2015). As shown in the Supporting Information (SI), the size of these AT-rich regions was chosen so that it is larger than the size of the representative long-lived denaturation bubbles studied in this work. We constrained a sequence of 10 GC bps on each extremity of the AT-rich region to be aligned arbitrarily along the Z-axis, as depicted in Fig. 1 (a). This allowed us to dissociate, in a first instance, the bending and twist contributions in the nucleation and closure mechanisms of the long-lived denaturation bubble. The full Hamiltonian and the details of the numerical implementation and of the parameter values are given in previous works Sicard et al. (2015) and in the SI. The mesoscopic model yields numerical values for the dsDNA persistence length, bps, and the unconstrained pitch, bps, comparable to the actual dsDNA values under physiological conditions Vologodskii (2015).
In the following, we focused our analysis on one linear dsDNA () of bps made of a AT-rich region of bps clamped by GC regions of bps on each extremity, and four different circular dsDNA (cDNA) with a similar AT-rich region but with different lengths and different superhelical densities, , defined as Sayar et al. (2010)
| (1) |
In Eq. 1, represent the linking numbers of the cDNA molecule Sayar et al. (2010), i.e. the number of times one backbone strand links through the circle formed by the other, and is defined as , for any DNA molecule, with (in bp units in the following) the equilibrium pitch measured in the linear state. For a given molecule, the superhelical stress is accomodated by changes in helical twist, , and writhe, , following Mielke et al. (2005).
As shown in Table 1, we considered different values for .
For instance, natural circular DNA molecules, such as bacterial plasmids, vary widely in size, but, when isolated
in vitro, the majority have values for Higgins and
Vologodskii (2015).
In the following, the superhelical densities, along with the sizes (in bp units) of the minicircles, were specifically chosen
to tune the value of . Such specific design allowed us to control the interplay between twist and writhe
during the formation of the long-lived denaturation bubbles.
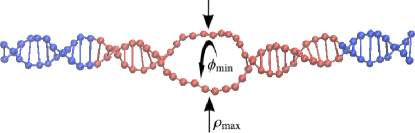
In Fig. 1 (c) are shown the free energy profiles obtained within the metadynamics (metaD) framework Tiwary and Parrinello (2013), , associated with the nucleation and closure mechanisms along the width of the bubble depicted in Fig. 1 (b) for the linear and circular dsDNA with (cf. details in the SI). In both systems, a closure free energy barrier, (with K is room temperature) separates the metastable basins associated with the denaturation bubble ( nm) from the closed state basin ( nm). These two basins are well separated by a standard free energy of formation , defining the opening free energy barrier, , associated with the nucleation mechanism. These values can be compared with previous work Sicard et al. (2015), where the formation of denaturation bubble in linear dsDNA without restraint on the GC segments clamping the AT-rich region was studied. We measured a very similar value for , but a free energy difference of in () and (). This difference in the free energies is about the thermal fluctuation scale and represents the loss of configurational entropy associated with the alignment of the GC regions during the closure of the AT-rich region.
We specifically designed and so that they differ from each other in terms of boundary conditions with or without the closure of the GC regions located on each side of the AT-rich region. The closure condition yields the reduction of the configurational entropy contribution of the system in the metastable basin associated with the long-lived denaturation bubble. This is qualitatively shown in Fig. 1 (d) where the free energy surfaces (FES) are reconstructed within the metaD framework along the two collective variables (CVs), and , depicted in Fig. 1 (b). The entropic contribution to the FES can be quantitatively assessed considering the definition of the free energy difference in terms of the probability distribution of the CVs Gimondi and Salvalaglio (2017); Sicard (2018), , where and are the probabilities of states and , respectively. The probability of each state is computed as
| (2) |
where is the joint probability density distribution function associated with the system free energy. The integration domains, , in Eq. 2 are identified in the SI. We reported in Tab. 1. the value of the free energy of formation, , between the two basins observed in Fig. 1 (d). As we could expect from visual inspection in Fig. 1 (c)-(d), the free energy landscapes show significant differences between and associated with the difference in the global entropic contribution in the free energy basins.
| () | () | () | () | ||||||
|---|---|---|---|---|---|---|---|---|---|
| — | — | ms | s | ||||||
| ms | s | ||||||||
| ms | ms | ||||||||
| ms | ms | ||||||||
| ms | min | ||||||||
| ms | s | ||||||||
| ms | h | ||||||||
| ms | h |
In Fig. 1 (d) is also shown the evolution of the FES, reconstructed within the metaD framework
along and , when the superhelical density of the system goes
from to .
As we would expect from energetic consideration (Adamcik et al., 2012), we observe
the progressive inversion of the thermodynamic stability of the system
for increasing undertwist, characteristic of the
predominant stability of the long-lived denaturation bubble. As shown in the SI, this transition comes with
the drift of the location of the nucleation basin towards larger values of ,
which is representative of the increase of the size of the denaturation bubble.
As reported in Tab. 1, the impact of the superhelical density, , on the denaturation bubble
stability is also shown with the increase of the closure free energy, , measured along
the minimal free energy paths (MFEPs) depicted in Fig. 1 (d), which is maximal when .
Interestingly, the results reported in Tab. 1 show that the opening free energy, , measured along the MFEPs depicted in Fig. 1 (d), does not significantly depends on the value of the superhelical density, . They suggest, however, that the response of the cDNAs depends strongly on related to the flexibility of the dsDNAs. This behavior is in line with the work of Sayar et al. Sayar et al. (2010) where the fraction of the linking number absorbed as twist and writhe was studied when circular DNAs of different lengths approach the supercoiling transition. For dsDNA chains of the order of one persistence length, and , the authors showed that the excess linking number was completely absorbed by the change in twist. For longer chains with (i.e. longer than Kuhn’s length in the dsDNA state), instead, they observed an increasing fraction of the linking number absorbed by the writhe. Indeed in this case the bending energy cost induced by the writhe is smaller. In our cDNAs (cf. Tab. 1), this nontrivial dependence on chain length and excess linking number is reflected in the corresponding adjustment in the free energy of formation, , and the closure free energy, , measured along the MFEPs depicted in Fig. 1 (d).
More sophisticated approach would necessarily take into account some relative misalignment of the sequences on both sides
of the AT-rich region, at least during the initiation stage of the denaturation bubble nucleation/closure.
As we discussed quantitatively in the SI, the bending contribution can be assessed analytically by modeling
the denaturation bubble as a single rotating joint, as the typical bubble length ( bps) is
on the order of the ssDNA persistence length, nm. As compared to the situation where
the arms are forced to be aligned, we show that the free energy gain due to arm alignment
is lower than , in agreement with the result reported above for .
Finally, building on accelerated dynamics frameworks Tiwary and
Parrinello (2013)
and the recent development of Sicard Sicard (2018) approaching the issue of complex system where configurational
entropy is competing with energy, we assessed numerically
the characteristic times associated with the opening and closure of the denaturation bubbles.
The results reported in Tab. 1 show a broad range of characteristic times associated
either to the opening or the closure of the denaturation bubble of nanometer size (cf. details in the SI).
For instance, the characteristic opening time and equilibrium constant obtained from our study in the case
of the linear dsDNA () are in good agreement with previous work Sicard et al. (2015)
and the experimental results of Englander et al. Englander et al. (1980)
and more recently Altan-Bonnet et al. Altan-Bonnet et al. (2003).
As qualitatively shown in Fig. 1 (d) and quantitatively assessed in the SI,
the results reported in Tab. 1 show equilibrium times, which depend on the interplay between
energetic and entropic characteristics of the undertwisted DNAs. For instance, we observed opening
times in the millisecond range, which are relatively unstressed by different degree of supercoiling.
However, configurational entropy associated with the torsional constraint induced by similar but different
can significantly influence the closure times over several orders of magnitude.
The extensive simulations discussed above allowed us to decipher the thermodynamic and dynamical characteristics of long-lived nanometer-sized denaturation bubbles in undertwisted microDNA containing between 200 and 400 bps. Eventhough the numerical values derived above could be approximate because of our coarse-grained model, our results show that suitable tuning of the degree of supercoiling and size of specifically designed microDNA would allow the control of opening and closure characteristic times, ranging over well distinct timescales, from microseconds to several hours. Interestingly, we showed that these dynamical characteristics can be related to specific tuning of both energetic and entropic properties of the DNA minicircles.
The broad range of closure/nucleation times could be seen as dynamical bandwidth to advance the specificity of the biosensing probe. DNA supercoiling is determinant in the stability of these long-lived DNA bubbles. The minicircles could therefore be used as a transducer of supercoiling induced by protein-binding resulting in bubble of various long lives. It could also permit to probe the DNA interaction of supercoiled-sensitive proteins with surface plasmon resonance technique Pillet et al. (2017) by enabling an easy immobilization of the minicircles through AT-rich ssDNA templates attached to the sensor surface. Minicircles forming DNA bubbles with variable long lives could also be used to detect and characterize the binding affinity of nucleoproteins for breathing DNA. A growing number of proteins implicated in fundamental biological processes such as transcription or repair are suspected to be extremely sensitive to such a DNA state. Alexandrov and coworkers reported a strong correlation between the binding affinity of the prokaryotic transcription factor Fis and enhanced breathing dynamics of the specific binding sequences Nowak-Lovato et al. (2013). The human Single-Stranded DNA binding protein 1 (hSSB1), involved in the repair of DNA damage, selectively counteract chemo- or radiotherapy cancer treatments, ensuring cancer cell survival Wu et al. (2015). hSSB1 was shown to be recruited to dsDNA breaks within only 10 s after the breakage event as if hSSB1 had an enhanced sensitivity for breathing DNA Croft et al. (2018). The minicircles studied here could therefore permit to unravel the detailed mechanism of hSSB1 binding and its dynamics, and promote the design of new hSSB1 inhibitors, which would enhance the cell sensitivity to chemo-and radiotherapy and reduce the toxicity of anti-cancer-treatments. More generally, the biological mechanisms of single-stranded DNA binding proteins implicated in the maintenance of genome stability could largely benefit from the control of long-lived nanometer-sized DNA denaturation bubbles forming in the minicircle explored here.
We acknowledge L. Salomé and A.K. Dasanna for useful discussions. F.S. thanks J. Cuny and M. Salvalaglio for fruitful discussion concerning the metadynamics framework.
References
- Vigneshvar et al. (2016) S. Vigneshvar, C. Sudhakumari, B. Senthilkumaran, and H. Prakash, Front. Bioeng. Biotechnol. 4, 11 (2016).
- Anjum and Pundir (2007) V. Anjum and C. Pundir, Sensors and Tranducers Journal 76, 937 (2007).
- Maseini (2001) M. Maseini, Pure Appl. Chem. 73, 23 (2001).
- Eden-Firstenberg and Schaertel (1988) R. Eden-Firstenberg and B. Schaertel, J. of Food Protection 51, 811 (1988).
- Jr. and Lyons (1962) L. C. Jr. and C. Lyons, Ann. N. Y. Acad. Sci. 102, 29 (1962).
- Han et al. (2013) D. Han, Z. Ma, W. Zhao, J. Xu, and H. Chen, Electrochem. Commun. 35, 38 (2013).
- Ahmed et al. (2014) A. Ahmed, J. Rushworth, N. Hirst, and P. Millner, Clinical Microbiol. Rev. 27, 631 (2014).
- Brunet et al. (2015) A. Brunet, S. Chevalier, N. Destainville, M. Manghi, P. Rousseau, M. Salhi, L. Salomé, and C. Tardin, Nucleic Acids Research 43, e72 (2015).
- Kavita (2017) V. Kavita, J. Bioengineer. Biomedical Sci. 7, 222 (2017).
- Ritzefeld and Sewald (2011) M. Ritzefeld and N. Sewald, J. Amino Acids 2012, 816032 (2011).
- Crawford et al. (2012) R. Crawford, D. Kelly, and A. Kapanidis, Chem. Phys. Chem. 13, 918 (2012).
- Zhou et al. (2014) Y. Zhou, Z. Xu, M. Wang, B. Sun, H. Yin, and S. Ai, Biosens. Bioelectron. 53, 263 (2014).
- von Hippel et al. (2013) P. von Hippel, N. Johnson, and A. Marcus, Biopolymers 99, 923 (2013).
- Destainville et al. (2009) N. Destainville, M. Manghi, and J. Palmeri, Biophys. J. 96, 4464 (2009).
- Adamcik et al. (2012) J. Adamcik, J.-H. Jeon, K. Karczewski, R. Metzler, and G. Dietler, Soft Matter 8, 8651 (2012).
- Altan-Bonnet et al. (2003) G. Altan-Bonnet, A. Libchaber, and O. Krichevsky, Phys. Rev. Lett. 90, 138101 (2003).
- Ambjornsson and Metzler (2005) T. Ambjornsson and R. Metzler, J. Phys.: Condens. Matter 17, S1841 (2005).
- Metzler et al. (2009) R. Metzler, T. Ambjornsson, A. Hanke, and H. Fogedby, J. Phys.: Condens. Matter 21, 034111 (2009).
- Sicard et al. (2015) F. Sicard, N. Destainville, and M. Manghi, J. Chem. Phys. 142, 034903 (2015).
- Shi et al. (2016) C. Shi, F. Shang, M. Zhou, P. Zhang, Y. Wang, and C. Ma, Chem. Commun. 52, 11551 (2016).
- Shibata et al. (2012) Y. Shibata, P. Kumar, R. Layer, S. Willcox, J. Gagan, J. Griffith, and A. Dutta, Science 336, 82 (2012).
- Irobalieva et al. (2015) R. Irobalieva, J. Fogg, D. C. Jr., T. Sutthibutpong, M. Chen, A. Barker, S. Ludtke, S. Harris, M. Schmid, W. Chiu, et al., Nature Comm. 6, 8440 (2015).
- Manghi and Destainville (2016) M. Manghi and N. Destainville, Phys. Rep. 631, 1 (2016).
- Tiwary and Parrinello (2013) P. Tiwary and M. Parrinello, Phys. Rev. Lett. 111, 230602 (2013).
- Sicard (2018) F. Sicard, arXiv:1803.03490 [cond-mat.stat-mech] (2018).
- Mielke et al. (2005) S. Mielke, N. Grønbech-Jensen, V. Krishnan, W. Fink, and C. Benham, J. Chem. Phys. 123, 124911 (2005).
- Vologodskii (2015) A. Vologodskii, Biophysics of DNA (Cambridge University Press, 2015).
- Sayar et al. (2010) M. Sayar, B. Avsaroglu, and A. Kabakcioglu, Phys. Rev. E 81, 041916 (2010).
- Higgins and Vologodskii (2015) N. Higgins and A. Vologodskii, Microbiol. Spectr. 3, 1 (2015).
- Gimondi and Salvalaglio (2017) I. Gimondi and M. Salvalaglio, J. Chem. Phys. 147, 114502 (2017).
- Englander et al. (1980) S. Englander, N. Kallenbach, A. Heeger, J. Krumhansl, and S. Litwin, Proc. Nat. Acad. Soc. U.S.A. 77, 7222 (1980).
- Pillet et al. (2017) F. Pillet, F. M. Passot, F. Pasta, V. A. Leberre, and J.-Y. Bouet, PLoS ONE 12, e0177056 (2017).
- Nowak-Lovato et al. (2013) K. Nowak-Lovato, L. Alexandrov, A. Banisadr, A. Bauer, A. Bishop, A. Usheva, F. Mu, E. Hong-Geller, K. Rasmussen, and W. Hlavacek, PLoS Comput. Biol. 9, e1002881 (2013).
- Wu et al. (2015) Y. Wu, H. Chen, J. Lu, M. Zhang, R. Zhang, T. Duan, X. Wang, J. Huang, and T. Kang, Nucleic Acids Res. 43, 7878 (2015).
- Croft et al. (2018) L. Croft, E. Bolderson, M. Adams, S. El-Kamand, R. Kariawasam, L. Cubeddu, R. Gamsjaeger, and D. Richard, Semin. Cell. Dev. Biol. (2018), URL https://doi.org/10.1016/j.semcdb.2018.03.014.
Control of DNA denaturation bubble nucleation to advance nano-biosensing Supporting Information
I Numerical model
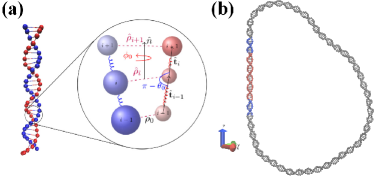
To overcome the inherent limitations of atomistic simulations encountered at length- and time-scales of interest SM-2016-PR-Manghi-Destainville , we use the DNA model of Refs. SM-2013-PRE-Dasanna-Manghi, ; SM-2015-JCP-Sicard-Manghi, , where the mesoscopic DNA model consists in two interacting bead-spring chains each made of N beads (of diameter nm) at position , with a AT-rich region of bps clamped with a GC region of bps, as shown in Fig. S1. The Hamiltonian is , where the first two contributions are elastic energies of the strands , which include both stretching and bending energies
| (S1) |
The stretching modulus, , is a compromise between numerical efficiency and experimental values SM-Hugel-PRL2005 , where is the thermal energy, K is the room temperature, and nm. The bending modulus is large, , to maintain the angle between two consecutive tangent vectors along each strand to the fixed value rad. Each strand is thus modeled as a freely rotating chain (FRC) SM-Grosberg-AIP1994 . The third and fourth terms of are the torsional energy and hydrogen-bonding interactions, respectively. The torsional energy is modeled by a harmonic potential
| (S2) |
where is defined as the angle between two consecutive base-pair vectors and ( rad). The stacking interaction between base pairs is modeled through a that depends on the value of the bare dsDNA torsional modulus , and the distances between complementary bases, , where
| (S3) |
and . Hence, in the dsDNA state and in the ssDNA one. The actual values in the dsDNA state after equilibration, , are however different from the prescribed values, , due to thermal fluctuations and non-linear potentials entering the Hamiltonian. The hydrogen-bonding interaction is modeled by a Morse potential
| (S4) |
where nm, nm, and and for AT and GC bonding, respectively,
as in Refs. SM-Dasanna-EPL2012, ; SM-2013-PRE-Dasanna-Manghi, ; SM-2015-JCP-Sicard-Manghi, .
The fitted values for the dsDNA persistence length and the pitch are bps
and bps for the relevant range of we are interested in, which are comparable to
the actual dsDNA values ( bps and bps). The ssDNA persistence length
is nm, compatible with experimental measurement SM-Tinland-Macro1997 ,
even though in the upper range of measured values.
The dsDNA minicircle is described by a circular helix where a helical line of radius coils around a torus of radius in the plane SM-2004-JCP-Mielke-Benham ; SM-2005-JCP-Mielke-Benham ; SM-2012-NJP-Olsen-Bohr . The centers of the beads on each strand initially coincide with the surface of this torus in Cartesian space according to the equations
| (S5) |
with , and the Cartesian coordinates of bead on strand .
The parameter for the first strand and for the second strand. The cross-sectional
radius is set equal to half the equilibrium base-pair distance, nm, considered
in previous work SM-2013-PRE-Dasanna-Manghi ; SM-2015-JCP-Sicard-Manghi .
The twist angle between two base-pairs is defined as , where is the DNA pitch,
i.e. the number of bps corresponding to one complete helix turn. For purposes of generating the initial
conformations, the bending angle per axis segment between the centers of two consecutive bps
is set initially at .
In the following, we restrained our analysis to four different circular dsDNAs (cDNA) with different superhelical density, , but with a similar sequence of bps. As shown in Table S1, the reference pitchs, , of , , and are initially set to , , , and bps, respectively. The number of beads on each strand, , is chosen so that the number of axis segment, , be an integer, and bps, as it is representative of the supercoiled DNA loops found in nature SM-2004-MC-Cloutier-Widom ; SM-2005-PNAS-Cloutier-Widom ; SM-2010-NAR-Bond-Maher ; SM-2012-Science-Shibata-Dutta ; SM-2015-CR-Dillon-Dutta . The superhelical densities, along with the sizes of the minicircles, were specifically chosen to tune the value of . Such specific design allowed us to control the interplay between twist and writhe during the formation of the long-lived denaturation bubbles SM-2010-PRE-Sayar-etal . Furthermore, to quantify the role of the boundary/closure conditions on the formation of the denaturation bubble, we considered a linear dsDNA of bps made of a similar AT-rich region of bps clamped by GC regions of bps on each extremity ( in Tab. S1).
| (bps) | (bps) | (rad) | (rad) | |||||
|---|---|---|---|---|---|---|---|---|
| — | — | — | ||||||
To allow comparison of the degree of supercoiling in molecules of different sizes, we normalize measurements of supercoiling with the use of the superhelical density SM-2010-PRE-Sayar-etal ; SM-2015-eLS-Bowater
| (S6) |
where represents the linking numbers of the cDNA molecule, i.e. the number of times one backbone strand links through the circle formed by the other SM-2010-PRE-Sayar-etal ; SM-2015-eLS-Bowater , and is defined as for any DNA molecule, with bps the equilibrium pitch measured in the linear state. For instance, natural circular DNA molecules, such as bacterial plasmids, vary widely in size, but, when isolated in vitro, the majority have values for SM-2005-OxfordUniversityPress-Bates-Maxwell ; SM-2008-JPCB-Trovato-Tozzini ; SM-2015-eLS-Bowater ; SM-2015-MS-Higgins-Vologodskii . is a topological property of circular DNA that does not depend on its particular conformation SM-2012-NJP-Olsen-Bohr ; SM-2012-SM-Adamcik-Dietler , and obeys the relation
| (S7) |
where represents the helical twist (the number of times either backbone winds around the helix axis), and represents the writhe, or degree of supercoiling (the number of signed crossing of the helix axis in planar projection, averaged over all projection directions). Although is a topological invariant integer, and are not and depend on geometry SM-2015-PA-Marko . For a given molecule, the superhelical stress produced by deviations of from is accomodated by changes in , , or both, following
| (S8) |
Here, corresponds to localized, sequence-dependent twist deformations such as strand separation or double-helical structure transitions. corresponds to bent (supercoiling) deformations SM-2015-PA-Marko .
| (bps) | (nm) | (rad) | () | |||
|---|---|---|---|---|---|---|
| — | () | |||||
| () | ||||||
| () | ||||||
| () | ||||||
| () | ||||||
| () | ||||||
| () | ||||||
| () |
I.1 MD simulation
The evolution of the system is governed by Brownian dynamics, i.e. simulations based upon numerical integration of the overdamped Langevin equation SM-2004-JCP-Mielke-Benham ; SM-2005-JCP-Mielke-Benham ; SM-2013-PRE-Dasanna-Manghi ; SM-2015-JCP-Sicard-Manghi . The evolution of is governed by the overdamped Langevin equation, integrated using a Euler’s scheme,
| (S9) |
where is the friction coefficient for each bead of diameter with
Pa.s the water viscosity.
The diffusion coefficient, , thus takes into account
the level of coarse-graining of the mesoscopic model involved in the kinetics associated
to the smoothed free energy landscape SM-Murtola-PCCP2009 .
The random force of zero mean obeys
the fluctuation-dissipation relation .
Lengths and energies are made dimensionless in the units of nm and , respectively.
The dimensionless time step is , set to
( ps) for sufficient accuracy SM-Dasanna-EPL2012 ; SM-2013-PRE-Dasanna-Manghi ; SM-2015-JCP-Sicard-Manghi .
This set of parameters induces zipping velocities bp/ns, compatible with experimental
measurements SM-Bustamante-COSB2000 .
The initial DNA state was first constrained in a plane to relax its geometrical parameters, such as stretching, bending along a single strand, and twisting, keeping the writhe of the system null. The geometrical constraint was then released, so that the system relaxed its linking number between helical twist and writhe , as described in Eq. S7 and reported in Tab. S1. Following the work of Mielke et al. SM-2004-JCP-Mielke-Benham , the latter dynamical quantity can be derived from the discretization of the White’s integral expression SM-1986-JMB-White-Bauer ; SM-1995-PRE-Marko-Siggia ,
| (S10) |
The dot product in Eq. S10 determines the magnitude of relative nonplanar bending of the segments of the helix axis defined by the pair of axis vectors, and , with . The instantaneous writhe of each substructure is found by summing over all pairs.
II Biased MD simulation
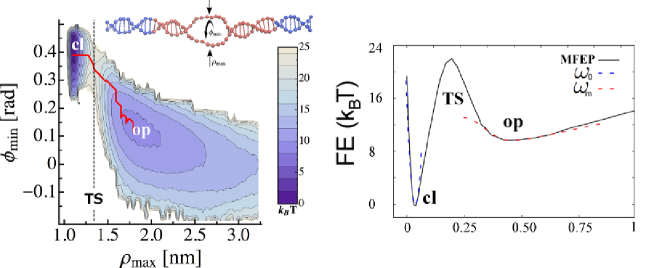
Thermodynamic properties. The well-tempered variant of the metadynamics (WT-metaD) enhanced sampling technique SM-2008-PRL-Barducci-Parrinello ; SM-2014-PRL-Dama-Voth was implemented with the coarse-grained (CG) Brownian simulations of the circular and linear dsDNA, and performed using the version 2.3 of the plugin for free energy calculation, named PLUMED SM-2014-CPC-Tribello-Bussi . WT-metaD enhances the sampling of the conformational space of the system along a few selected degrees of freedom, named collective variables (CVs), and reconstructs the equilibrium probability distribution, and thus the free energy landscape, as a function of these CVs. As shown in Fig. S2, and already discussed in previous work SM-2015-JCP-Sicard-Manghi , we considered the width of the denaturation bubble, i.e. the maximal distance between paired bases, as CV to bias the dynamics. We also choose to follow the evolution of the minimal twist angle inside the bubble, , where is defined as the angle between two consecutive base-pair vectors and .
According to the algorithm introduced by Barducci et al. SM-2008-PRL-Barducci-Parrinello , a Gaussian bias potential is deposited every with height , where is the CV, is the initial height, is the temperature of the simulation, the metadynamics time-dependent bias,
| (S11) |
and is the bias factor with a parameter with the dimension of a temperature.
The resolution of the recovered free energy landscape is determined by the width of the Gaussian .
We put a restraint wall potential at specific values of to prevent the system to escape
from the metastable state. We checked that a slight change in the position of the wall did not change significantly
the results, particularly the positions of the local minimum and the saddle point, as well as the barrier height.
The simulations are run until the free energy profile does not change more than in the last ns.
To further control the error of the reconstructed landscape, we performed runs of WT-metaD for each DNA minicircle.
The other observables are reconstructed afterwards using the reweighting technique
of Bonomi et al. SM-2009-JCC-Bonomi-Parrinello .
The different sets of values considered in the WT-metaD simulations are given in Table S3.
Dynamical properties. Building on the accelerated dynamics framework of Hamelberg et al. SM-2010-JCP-Xin-Hamelberg and more recently Tiwary et al. SM-2013-PRL-Tiwary-Parrinello ; SM-2014-JCTC-Salvalaglio-Parrinello , we extended the Metadynamics scope to estimate the mean transition times between the metastable (bubble) and the equilibrium (closed) states observed in the circular and linear dsDNA. WT-metaD was performed using the width of the denaturation bubble as CV. We denote by , the mean transition time over the barrier from the metastable state to the closed state, and by , the mean transition time for the metadynamics run. The latter changes as the simulation progresses and is linked to the former through the acceleration factor , where the angular brackets denote an average over a metadynamics run confined to the metastable basin, and is the metadynamics time-dependent bias. To satisfy the main validity criterions, ie. 1) to consider a set of CVs able to distinguish between the different metastable states SM-2014-JCTC-Salvalaglio-Parrinello , and 2) to avoid depositing bias in the Transition State region SM-2013-PRL-Tiwary-Parrinello , we check that the statistics of transition times follows a Poisson distribution, and increase the time lag between two successive Gaussian depositions , as indicated in Tab. S3. We performed several WT-metaD simulations and stop the simulations when the crossing of the barrier and the Gaussian deposition occur unlikely at the same time. To assess the reliability of the biased simulations, we checked that no bias potential was added to the transition state region during the WT-metaD simulations SM-2014-JCTC-Salvalaglio-Parrinello . We also performed statistical analysis of the distribution of transition times. We performed a two-sample Kolmogorov-Smirnov (KS) test, which does not require a priori knowledge of the underlying distribution SM-2014-JCTC-Salvalaglio-Parrinello . We tested the null hypothesis that the sample of transition times extracted from the metaD simulations and a large sample of times randomly generated according to the theoretical exponential distribution reflect the same underlying distribution. The null hypothesis is conventionally rejected if the -value . The KS test has been performed as implemented in the software cran-R SM-cranR .
| (nm) | (kJ/mol) | (ps) | (ps) | (nm) | (nm) | |||
|---|---|---|---|---|---|---|---|---|
| — | ||||||||
| — | — | |||||||
| — | — | |||||||
| — | ||||||||
| — |
Considering the recent development of Sicard SM-2018-arXiv-Sicard approaching the issue of complex system where configurational entropy is competing with energy, we extended the metadynamics scope discussed above to assess the characteristic times associated with the opening and closure of the denaturation bubbles when their direct numerical estimation was not feasible. To do so, we computed the ratio between the rates associated with the transition between the two free energy basins associated with the closed and opened dsDNA states, and , respectively, reconstructed in the free energy surfaces shown in Fig.1d in the main text:
| (S12) |
In Eq. S12, and represent the effective stiffness of the free energy well associated with the opened and closed dsDNA states, respectively (as depicted in Fig. S3 for the linear DNA). To account for the asymmetric nature of the free energy landscape in the free energy basins, skew-Gaussian fitting of the minimal free energy path (MFEP) was considered as described in the work of Sicard SM-2018-arXiv-Sicard . The respectives values are reported in Tab. S4. The difference in configurational entropy, was assessed as
| (S13) |
with the free energy of formation between the two free energy basins associated with the closed and opened dsDNA states measured along the MFEP depicted in the main text, and the algebric values of the free energy of formation taking into account the entropic contribution to the free energy basins. The later term was defined in terms of the probability distribution of the CVs SM-2017-JCP-Gimondi-Salvalaglio ; SM-2018-arXiv-Sicard :
| (S14) |
In Eq. S14, and are the probabilities of the closed and opened DNA states, respectively. The probability of each state is computed as the integral of the distribution within the energy basin, , it occupies on the CV-space,
| (S15) |
where is the joint probability density distribution function associated with the system FE. We considered the successive isosurfaces depicted in Fig. 1b in the main text as integration domains. Finally, considering the Rouse model valid for flexible polymer chain SM-2005-JPCM-Ambjornssson-Metzler , the effective friction coefficients in Eq. S12 depend on the number of opened bps, , in the DNA bubble reported in Tab S2. The typical size observed in the simulations yields the relation between the effective frictions in Eq. S12. The results are reported in Tab. S4.
III Quantitative assessment of misalignment of the dsDNA arms
In our extensive simlations, we restrained our analysis to the case where the sequence of GC bps delimiting the AT-rich region were forced to be aligned. This was intended to dissociate the bending and twist contributions in the nucleation and closure mechanism. However, more realistic approach would necessarily take into account some relative misalignment of the sequences on both sides of the AT-rich region, at least during the initiation stage of the denaturation bubble nucleation/closure. The bending contribution can be assessed analytically by modeling the denaturation bubble as a single rotating joint because the typical bubble length bps is on the order of the ssDNA persistence length nm. Denoting the joint bending rigidity, the denaturation bubble’s state can be characterized by the angle and energy , and the associated partition function is
| (S16) | |||||
As compared to the case where the arms are forced to be aligned, the free energy gain in the unconstrained case is . The value of in the present case is difficult to evaluate because the joint is composed of several base-pairs. It can be estimated in a rough approximation as because there are two strands in the bubble of length bps. If nm and bps, one gets and . In all cases, the free energy increase due to arm alignment is lower than , in agreement with the result reported in the main text for DNA.
| -value | -value | ||||||
|---|---|---|---|---|---|---|---|
| ms | s | ||||||
| ms | s | ||||||
| ms | ms | ||||||
| ms | ms | ||||||
| ms | min | — | |||||
| ms | s | — | |||||
| ms | h | — | |||||
| ms | h | — |
References
- (1) M. Manghi and N. Destainville, Phys. Rep. (2016), 631, 1-41.
- (2) A. Dasanna, N. Destainville, J. Palmeri and M. Manghi, Phys. Rev. E (2013), 87, 052703.
- (3) F. Sicard, N. Destainville and M. Manghi, J. Chem. Phys. (2015), 142, 034903.
- (4) T. Hugel, M. Rief, M. Seitz, H. E. Gaub, and R. Netz, Phys. Rev. Lett. (2005), 94, 048301.
- (5) A. Y. Grosberg and A. R. Khokhlov, Statistical Physics of Macromolecules (AIP, Melville, NY, 1994).
- (6) A. K. Dasanna, N. Destainville, J. Palmeri, and M. Manghi, EuroPhys. Lett. (2012), 98, 38002.
- (7) B. Tinland, A. Pluen, J. Sturm, and G. Weill, Macromolecules (1997), 30, 5763.
- (8) S.P. Mielke, W.H. Fink, V.V. Krishnan, N. Grønbech-Jensen and C.J. Benham, J. Chem. Phys. (2004), 121, 8104-8112.
- (9) S.P. Mielke, N. Grønbech-Jensen, V. Krishnan, W. Fink and C. Benham, J. Chem. Phys. (2005), 123, 124911.
- (10) K. Olsen and J. Bohr, New Journal of Physics (2012), 14, 023063.
- (11) T. Cloutier and J. Widom, Mol. Cell (2004), 14, 355-362.
- (12) T. Cloutier and J. Widom, Proc. Nat. Acad. Soc. U.S.A. (2005), 102, 3645-3650.
- (13) L. Bond, J. Peters, N. Becker, J. Kahn and L. M. III, Nucleic Acids Research (2010), 38, 8072-8082.
- (14) Y. Shibata, P. Kumar, R. Layer, S. Willcox, J. Gagan, J. Griffith and A. Dutta, Science (2012), 336, 82-86.
- (15) L. Dillon, P. Kumar, Y. Shibata, Y.-H.Wang, S. Willcox, J. Griffith, Y. Pommier, S. Takeda and A. Dutta, Cell Rep. (2015), 11, 1749-1759.
- (16) M. Sayar, B. Avsaroglu and A. Kabakcioglu, Phys. Rev. E (2010), 81, 041916.
- (17) R. Bowater, Supercoiled DNA: Structure, eLS. John Wiley & Sons, Ltd: Chichester, 2015.
- (18) A. Bates and A. Maxwell, DNA topology (2nd Ed.), Oxford University Press, UK, 2005.
- (19) F. Trovato and V. Tozzini, J. Phys. Chem. B (2008), 112, 13197-13200.
- (20) N. Higgins and A. Vologodskii, Microbiol. Spectr. (2015), 3, 1-49.
- (21) R. Irobalieva, J. Fogg, D. C. Jr., T. Sutthibutpong, M. Chen, A. Barker, S. Ludtke, S. Harris, M. Schmid, W. Chiu and L. Zechiedrich, Nature Comm. (2015), 6, 8440.
- (22) J. Adamcik, J.-H. Jeon, K. Karczewski, R. Metzler and G. Dietler, Soft Matter (2012), 8, 8651.
- (23) J. Marko, Physica A (2015), 418, 126-153.
- (24) T. Murtola, A. Bunker, I. Vattulainen, M. Deserno, and M. Karttunen, Phys. Chem. Chem. Phys. (2009), 11, 1869.
- (25) C. Bustamante, S. B. Smith, J. Liphardt, and D. Smith, Curr. Opin. Struct. Biol. 10, 279 (2000).
- (26) J. White and W. Bauer, J. Mol. Biol. (1986), 189, 329.
- (27) J. Marko and E. Siggia, Phys. Rev. E (1995), 52, 2912-2938.
- (28) A. Barducci, G. Bussi, and M. Parrinello, Phys. Rev. Lett. (2008), 100, 020603.
- (29) J.F. Dama, M. Parrinello, and G.A. Voth, Phys. Rev. Lett. (2014), 112, 240602.
- (30) G.A. Tribello, M. Bonomi, D. Branduardi, C. Camilloni and G. Bussi, Comput. Phys. Comm. (2014), 185, 604-613.
- (31) M. Bonomi, A. Barducci and M. Parrinello, J Comput. Chem. (2009), 30, 1615.
- (32) Y. Xin and D. Hamelberg, J. Chem. Phys. (2010), 132, 224101.
- (33) P. Tiwary and M. Parrinello, Phys. Rev. Lett. (2013), 111, 230602.
- (34) M. Salvalaglio, P. Tiwary and M. Parrinello, J. Chem. Theory Comput. (2014), 10, 1420-1425.
- (35) The Comprehensive R Archive Network. https://cran.r-project.org/ (accessed January 17, 2018).
- (36) I. Gimondi and M. Salvalaglio, J. Chem. Phys. 147, 114502 (2017).
- (37) F. Sicard, arXiv:1803.03490 [cond-mat.stat-mech] (2018).
- (38) C. Chen, Y. Huang, and Y. Xiao, J. Chem. Phys. 138, 164122 (2013).
- (39) T. Ambjornssson and R. Metzler, J. Phys. Condens. Matter 17, S1841 (2005).