Two Thousand Kepler Phase Curves from phasma
keywords:
planets and satellites: detectionDavid Kipping
1
An exoplanet’s optical phase curve constrains the thermal emission and albedo of the planet’s surface and/or atmosphere (e.g. see Kipping & Spiegel 2011; Demory et al. 2013), as well as potentially constraining the mass via gravitational influences on the host star (e.g. see Borucki et al. 2009; Barclay et al. 2012). Recently, Jansen & Kipping (2018) demonstrated that exoplanets with precisely constrained orbital periods, as is typical of transiting planets, enable one to exploit a Fourier-argument to non-parametrically separate optical phase curves from long-term photometric time series in the presence of realistic noise structures. This algorithm, dubbed phasma, was applied to 477 exoplanets in Jansen & Kipping (2018), with the final phase curves made publicly available at github.com/CoolWorlds/phasma.
phasma works best when the baseline of each uninterrupted photometric time series is much greater than the orbital period. Since each Kepler quarter is days in duration, we limited our scope to d period planets. In addition, we required that planets had a NASA Exoplanet Archive (NEA) disposition of “CONFIRMED” and a parent star with . Here, we provide the community with a larger set of detrended phasma phase curves by relaxing these latter two constraints. The surface gravity constraint is removed altogether. The dispostion required is relaxed to anything for which either the Kepler or NEA disposition does not equal “FALSE POSITIVE”, excepting cases where either disposition is “CONFIRMED”. Our processing exactly follows the methods described in Jansen & Kipping (2018) otherwise, using Kepler DR25 PDC data throughout.
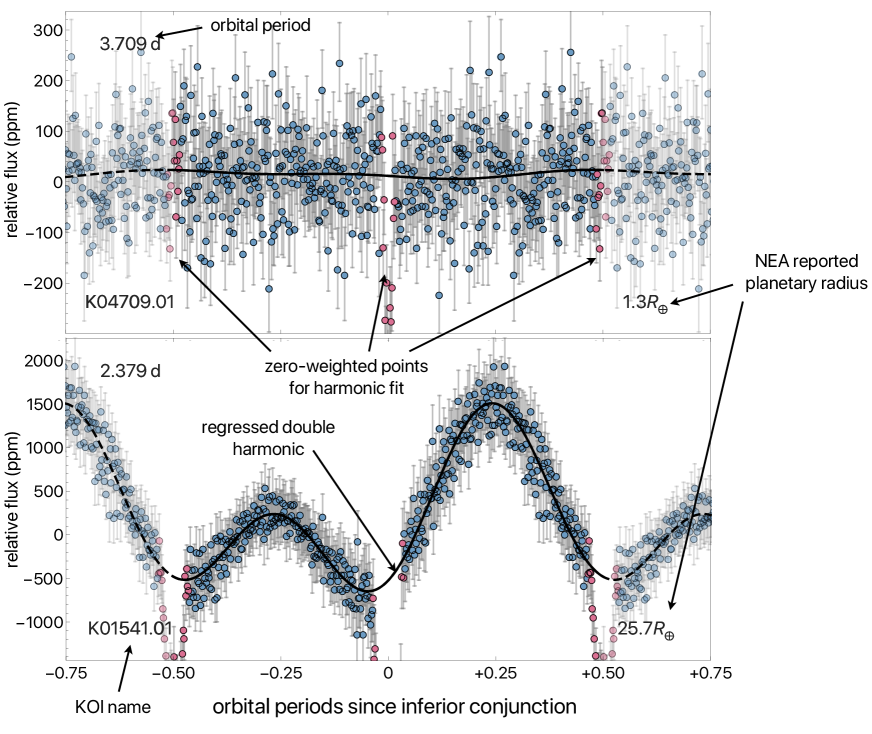
The new sample contains 1,998 KOIs, including the original 477, and we make the detrended lightcurves and summary figures (example shown in Figure 1) publicly available at Columbia’s Academic Commons \dataset[(DOI: 10.7916/D8SB5NR7)]https://doi.org/10.7916/D8SB5NR7. Each summary figure includes a solid-black line representing a double harmonic ( and ) regressed to the points occuring outside of transit and occultation, which should not be treated as a physical fit but rather a means for guiding the eye when intepretting the figures.
In addition, we have recoded the source code into PYTHON to enable the community to implement the package for themselves more easily on K2 and TESS light curves in the future; available at github.com/CoolWorlds/phasma.
phasma provides a powerful non-parametric detrending approach with zero-tuning parameters able to compete with the precision obtained by much more human-intensive approaches (e.g. see comparison to Armstrong et al. 2016 in Jansen & Kipping 2018). These results and software should enable the community to more easily work with phase curve science products from ongoing surveys.
Acknowledgements.
DMK is supported by the Alfred P. Sloan Foundation.References
- Armstrong et al. (2016) Armstrong, D. J., de Mooij, E., Barstow, J., Osborn, H. P., Blake, J. & Fereshteh Saniee, N. 2016, Nature Astronomy, 1, 4
- Barclay et al. (2012) Barclay, T., Huber, D., Rowe, J. F., Fortney, J. J., Morley, C. V., Quintana, E. V., Fabrycky, D. C., Barentsen, G., Bloemen, S., Christiansen, J. L., Demory, B.-O., Fulton, B. J., Jenkins, J. M., Mullally, F., Ragozzine, D., Seader, S. E., Shporer, A., Tenenbaum, P. & Thompson, S. E., 2012, ApJ, 761, 53
- Borucki et al. (2009) Borucki, W. J., Koch, D., Jenkins, J., et al. 2009, Science, 325, 709
- Demory et al. (2013) Demory, B.-O., de Wit, J., Lewis, N., Fortney, J., Zsom, A., Seager, S., Knutson, H., Heng, K., Madhusudhan, N., Gillon, M., Barclay, T., Desert, J.-M., Parmentier, V. & Cowan, N. B., 2013, ApJ, 776, 25
- Jansen & Kipping (2018) Jansen, T. & Kipping, D. M., 2018, MNRAS, submitted
- Kipping & Spiegel (2011) Kipping, D. M., Spiegel, D. S., 2011, MNRAS, 417, L88