Establishing the Galactic Centre distance using VVV Bulge RR Lyrae variables
Abstract
This study’s objective was to exploit infrared VVV (VISTA Variables in the Via Lactea) photometry for high latitude RRab stars to establish an accurate Galactic Centre distance. RRab candidates were discovered and reaffirmed () by matching photometry with templates via minimization, and contaminants were reduced by ensuring targets adhered to a strict period-amplitude () trend and passed the Elorietta et al. classifier. The distance to the Galactic Centre was determined from a high latitude Bulge subsample (, kpc, random uncertainty is relatively negligible), and importantly, the comparatively low color-excess and uncrowded location mitigated uncertainties tied to the extinction law, the magnitude-limited nature of the analysis, and photometric contamination. Circumventing those problems resulted in a key uncertainty being the relation, which was derived using LMC RRab stars (, , assuming ). The Galactic Centre distance was not corrected for the cone-effect. Lastly, a new distance indicator emerged as brighter overdensities in the period-magnitude-amplitude diagrams analyzed, which arise from blended RRab and red clump stars. Blending may thrust faint extragalactic variables into the range of detectability.
1 Introduction
Distance estimates for the Galactic Centre may be fraught with biases that invalidate otherwise precise evaluations. The extinction law tied to that sightline is contested and the impact is exacerbated by sizable interstellar reddening. Majaess et al. (2016) confirmed that optical color-excess ratios may vary with stellar population and Galactic position, whereas the near-infrared results are comparatively constant with Galactic longitude () and Galactocentric distance (e.g., ). Udalski (2003) argued that the optical extinction law ratio transitions significantly from the Solar neighborhood to the Bulge (), and Carraro et al. (2013) advocated that is anomalous in Carina. Near-infrared observations are less sensitive to grain size variations given the implied mean diameter (), although chemistry can play a role at certain wavelengths. Second, a magnitude-limited bias can be concerning for a lower latitude Bulge sample attenuated by significant extinction. Mean distances inferred from that sample may shift the Galactic Centre distance toward nearer values. Blending can magnify that bias, and may be enhanced near the crowded Galactic Centre. Smith et al. (2007) remarked that effect can impact red clump determinations of the Galactic Centre distance and attempts to deduce parameters for the putative bar(s), and blending can be acute within the galaxies and globular clusters used to constrain cosmological models (e.g., Majaess et al., 2012). High resolution HST data imply that multiple stars are in close proximity to RR Lyrae stars near the core, where the stellar density increases markedly, and numerous neighbouring stars remain unresolved in ground-based images.
The aforementioned uncertainties are mitigated in the present analysis owing to the near-infrared nature of the VVV (VISTA Variables in the Via Lactea) survey data utilized, in tandem with the selection of uncrowded high latitude Bulge RR Lyrae stars exhibiting relatively marginal reddening. The discovery of such stars in the VVV survey is important given those objectives, in addition to standard candles generally being employed to characterize interstellar extinction, identify stellar streams and globular clusters, and facilitate efforts to delineate the structure of the Milky Way (e.g., Dékány et al., 2015; Mateu et al., 2018).
In this study, a search is performed for higher latitude Bulge RRab stars in the VVV survey with the aim of establishing an accurate Galactic Center distance. An emphasis is placed on low extinction and relatively uncrowded stars at higher latitudes, thereby reducing the uncertainties. This work is organized as follows: §2.1 and §2.2 describe the VVV survey and the method employed to detect RR Lyrae stars therein; in §2.3 a subsample of the candidates identified are utilized to ascertain the distance to the Galactic Centre, and the zeropoint is tied to LMC variables; §2.4 features a brief characterization of a potential new distance indicator present in the data analyzed; and concluding remarks are provided in §3.

2 Analysis
2.1 VVV Survey
The VVV survey is a near-infrared, wide-field, multi-epoch campaign monitoring stars in the Galactic Bulge, and adjacent regions of the disk (Minniti et al., 2010; Saito et al., 2012). Preliminary analyses of the VVV data have supported important conclusions related to numerous topics, and a brief discussion is warranted. Majaess et al. (2016) relied partly on VVV RR Lyrae variables to investigate properties of dust extinction, which remains a critical topic in the forthcoming Gaia era as parallaxes require conversion to absolute magnitude space, thus ensuring the gains can be transferred to the extragalatic scale and beyond Gaia’s limits. Dékány et al. (2013) and Minniti et al. (2017a) advocated that Bulge RR Lyrae variables sampled by the VVV campaign do not trace the bar(s) outlined by their younger red clump counterparts.111For an alternative interpretation see Collinge et al. (2006) and Pietrukowicz et al. (2015). Furthermore, Gran et al. (2016) concluded that the spatial distribution of VVV RR Lyrae stars differs relative to the X-shaped structure demarcated by red clump stars. Minniti et al. (2017b) discovered an Oosterhoff type I globular cluster (FSR 1716) using RR Lyrae variables identified in the VVV survey, and the effort is part of a broader objective to help rectify an incomplete census of Galactic globular clusters.
The current analysis relies on preliminary VVVDR4 aperture photometry produced by the VISTA Data Flow System (VDFS) pipeline (Cross et al., 2012, and references therein). The vvvDetection, vvvVariability, and vvvSource tables were queried. All VDFS VVV photometry and catalogs will be inevitably released to the public.
2.2 Identifying RRab Stars
A suite of criteria were adopted to avoid stars that mimic RRab characteristics. For example, phased RRab lightcurves may exhibit symmetry owing to the reduced sensitivity to temperature (i.e., Rayleigh-Jeans tail of the Planck function), and can therefore display similar lightcurves to shorter-period contact eclipsing binaries. A period search for RRab candidates was carried out on the VVVDR4 data using the GLS algorithm (Zechmeister & Kürster, 2009), which produces a generalised Lomb-Scargle periodogram. The periods were restricted to days and a power signal strength , whereby the former limit aimed to mitigate contamination by other variables, as the bulk of the RRab distribution lies within that range (Soszyński et al., 2009, their Fig. 1). Second, template lightcurves inferred from OGLE data (Soszyński et al., 2014) were fitted to the targets using minimization. The candidates exhibited multiband colours encompassing the O-M stellar reddening line and adhered to the trend displayed in the period-amplitude diagram (Fig. 2): . That polynomial was approximated using an OGLE subsample, and an amplitude deviation threshold of was adopted. The amplitude criterion may preferentially select RRab of a particular chemical composition, however, near-infrared distances are comparatively insensitive to metallicity (e.g., Muraveva et al., 2015). Importantly, only candidates that were subsequently deemed as RRab stars by the Elorrieta et al. (2016) machine-learned classifier are analyzed here ( targets eliminated with a mean near 10.5 kpc). The objective being to provide an independent check on the classifications and reduce contamination, rather than strive for completeness.
The approach yielded candidate RRab stars, with targets in common with Gran et al. (2016) and OGLE (Soszyński et al., 2014), thereby bolstering the candidate classifications issued by all three studies owing partly to the strict period- constraint. The objects typically feature 50 datapoints, and span a sizable Galactic longitude and latitude baseline (, , ). A digitized table of the data (e.g., number of epochs, etc.) will accompany this work and shall be hosted by CDS. Certain DR4 regions feature additional epochs and depth, thereby fostering potential biases. Those issues shall be ameliorated by the forthcoming DR5 release and the desirable VVVx (extended) survey, and VVV sourceIDs for the targets will be cited within the table to facilitate the acquisition of the latest data.

2.3 Galactic Centre Distance
The Galactic Centre distance was computed using near-infrared photometry for a higher latitude subsample of the RR Lyrae stars identified (). A mean distance of kpc was inferred from simulations (n=10000) where coefficients and parameters (period-magnitude, extinction law, histogram binsize, etc.) were varied. A single example iteration is conveyed as Fig. 3, and the distance tied to the distribution’s maximum was adopted. The distance derived agrees with other recent estimates (Turner, 2014; de Grijs & Bono, 2016; Bhardwaj et al., 2017), including Bland-Hawthorn & Gerhard (2016), who obtained kpc. Majaess (2010) discussed the uncertainty in characterizing how the mean distance to a group of variable stars relates to , however, solace is taken in the convergence of several semi-independent VVV estimates. The distances, heliocentric and projected onto the Galactic plane, were evaluated via the relations derived below (, ). Distances for a lower latitude subsample were expectedly closer owing to increased extinction and photometric contamination. Brighter candidates detected by 2MASS exhibit an even nearer distance, reiterating the prominent role minimization and extinction play in shifting the results. The example histogram’s asymmetry at smaller distances emphasizes those points, which dominate over the reputed cone-effect in this instance (see Dékány et al., 2013; Bhardwaj et al., 2017, and discussion therein). The distance was not corrected for that effect. Finally, the selection of a higher latitude sample is likewise beneficial because the VVV-2MASS standardization is complicated at lower latitudes where extinction is highest (González-Fernández et al., 2017), and the VDFS VVV data used were extracted by aperture photometry which is sensitive to crowding inherent to such regions.

The distances were evaluated using and relations inferred from LMC stars. The strategy employed to reduce the biases described above ensured that key uncertainties stem partly from those functions. Muraveva et al. (2015) summarized the ambiguity surrounding the relation in their Table 3. The topic was therefore investigated using LMC RRab identified by OGLE and possessing VMCDR4 data (Soszyński et al., 2009; Cioni et al., 2011). The VISTA VMC data, in concert with the VISTA VVV data, will invariably be publicly available. Means were adopted verbatim from the preliminary VDFS VMCDR4 source table (aperture photometry), and are used in the absence of the final data release when multiband template fitting to PSF photometry will be performed (Hajdu et al., in prep.). The coefficients determined from that sample support the Muraveva et al. (2015) findings and are: . The relation was established by first applying a robust fit, removing outliers, and subsequently taking the mean of robust and least-squares algorithms (Fig. 4). Brighter blends between RRab and red clump stars were excluded from the fitting process (§2.4). Reddenings associated with the Bulge RRab distances were computed via the following expression derived from the VMC sample: . An LMC reddening and distance modulus of and were assumed (Majaess, 2010; Majaess et al., 2011b), accordingly. The following color-excess ratio and extinction law of and (Majaess et al., 2016) were likewise adopted, respectively. The former was evaluated by correlating optical and near-infrared photometry tabulated for Galactic Cepheids by Berdnikov et al. (2000) and Monson & Pierce (2011), and drawing upon the expressions conveyed by Majaess et al. (2016), and the latter was selected owing to the reduced extinction at and the ratio is corroborated by Minniti et al. (2018) who obtained (see also Alonso-García et al., 2017). Formal fitting uncertainties are cited and ignore the metallicity sensitivity of the color index (Majaess et al., 2016). However, overall, the resulting corrections in the infrared domain are advantageously small and the uncertainties comparatively negligible. The uncertainty for the zeropoint was enlarged to account for differences between the Majaess et al. (2011b) and Auracaria-OGLE distances to the LMC (Pietrzyński et al., 2013; Gieren et al., 2015). The latter obtained , which shifts the zeropoint to . Those interested in adopting an alternative LMC distance may use: . Note that the relations conveyed are on the 2MASS system, and the VVV-VMC DR4 data were transformed from the VISTA system using common stars.
The analysis could be admittedly improved by enhanced determinations of the mean magnitudes from multiband template fitting to PSF photometry (Hajdu et al., in prep.). The preliminary DR4 aperture photometry utilized here would benefit from that approach, which shall bolster the reddenings, distances, and the photometry’s accuracy. Shorter-wavelength DR4 VISTA YZJH observations also possess few epochs relative to (e.g., one sampling in VVVDR4), and that shall be expanded in subsequent releases.
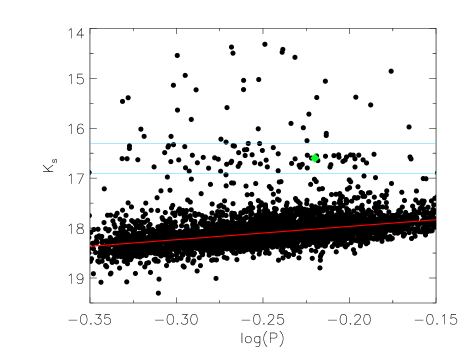
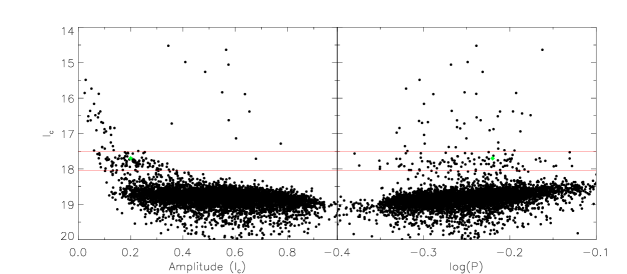
2.4 Blended Distance Indicator
The period-magnitude diagram exhibited an overdensity brighter than canonical RR Lyrae stars (Fig. 4). OGLE data were subsequently examined in amplitude-magnitude space, and the overdensities are associated with brighter targets mimicking smaller-amplitude RRab lightcurves (Fig. 5). The objects are forged from blends between RRab stars and the common field red clump giant. Advantages of red clump stars include their sizable statistics and ubiquity. Alves et al. (2002) deduced apparent magnitudes of and for red clump stars in the LMC, which when paired with brightness estimates for a canonical RRab match the observed overdensity locations (green diamond, Figs. 4, 5). Fig. 5 displays a RRab impacted by blending, and a diminished amplitude is noticeable as a result. The overdensity could be a distance indicator governed by a mean or maximum (edge detection) magnitude threshold, in a fashion reminiscent of red clump or TRGB analyses. A viable methodology may emerge with subsequent iterations and independent input, with the frequency (not location) of single RRab and red clump blends being partly dictated by instrumentation and seeing. Furthermore, the period-amplitude diagram (Fig. 5) may contain blends constituted by multiple stars, and thus modelling could proceed on an individual target basis rather than overdensities. Amplitude and brightness ratios in multiple passbands can constrain the quantity of red clump stars involved. At remote distances blending may thrust RR Lyrae stars and other variables beyond faint-limit thresholds. A subsequent work will explore whether the approach can be utilized to establish relative distances between the Milky Way, LMC, SMC, IC1613, and comparatively nearby galaxies. Relative distances can be employed to constrain the impact of metallicity (e.g., []) for separate standard candles (e.g., classical Cepheids, Majaess et al., 2011a).

3 Conclusion
In this study near-infrared VVV photometry for higher latitude RRab stars were employed to determine the Galactic Centre distance, thus minimizing numerous uncertainties.
RRab candidates (e.g., Fig. 1) were classified by matching photometry to templates via minimization, and contaminants were mitigated by relying on the period- diagram and a machine-learned classifier (Elorrieta et al., 2016). 4194 RRab candidates were identified, with targets in common with Gran et al. (2016) and OGLE, thus strengthening the candidate classifications of all three research initiatives owing in part to the inclusion of a conservative near-infrared period-amplitude criterion (Fig. 2).
A low extinction and high latitude () subsample was exploited to determine the distance to the Galactic Centre ( kpc, Fig. 3). The candidates were selected to reduce the impact of certain biases, granted sampling high extinction targets in crowded regions will yield nearer distances owing to the magnitude-limited nature of the analysis, the minimization adopted to identify the variable class, and photometric contamination. The computed distance to the Galactic Centre is linked to and relations inferred from LMC RR Lyrae variables (, ). Overdensities were identified and culled from the LMC data used to establish the period-magnitude relation (Fig. 4), and arise from blends of RRab and red clump giants (Fig. 5). The objects could be a viable distance indicator owing to the enhanced brightness and lightcurve morphology.
Lastly, with subsequent iterations the final VVV catalog, in tandem with other surveys (e.g., OGLE), may continue to deliver pertinent information regarding the distance, reddening, age, and metallicity of stellar populations throughout the Galaxy’s central region (e.g., Minniti et al., 2018; Dékány et al., 2018).
References
- Alonso-García et al. (2017) Alonso-García, J., Minniti, D., Catelan, M., et al. 2017, ApJ, 849, L13
- Alves et al. (2002) Alves, D. R., Rejkuba, M., Minniti, D., & Cook, K. H. 2002, ApJ, 573, L51
- Bhardwaj et al. (2017) Bhardwaj, A., Rejkuba, M., Minniti, D., et al. 2017, A&A, 605, A100
- Berdnikov et al. (2000) Berdnikov, L. N., Dambis, A. K., & Vozyakova, O. V. 2000, A&AS, 143, 211
- Bland-Hawthorn & Gerhard (2016) Bland-Hawthorn, J., & Gerhard, O. 2016, ARA&A, 54, 529
- Carraro et al. (2013) Carraro, G., Turner, D., Majaess, D., & Baume, G. 2013, A&A, 555, A50
- Cioni et al. (2011) Cioni, M.-R. L., Clementini, G., Girardi, L., et al. 2011, A&A, 527, A116
- Collinge et al. (2006) Collinge, M. J., Sumi, T., & Fabrycky, D. 2006, ApJ, 651, 197
- Cross et al. (2012) Cross, N. J. G., Collins, R. S., Mann, R. G., et al. 2012, A&A, 548, A119
- Dékány et al. (2013) Dékány, I., Minniti, D., Catelan, M., et al. 2013, ApJ, 776, L19
- Dékány et al. (2015) Dékány, I., Minniti, D., Majaess, D., et al. 2015, ApJ, 812, L29
- Dékány et al. (2018) Dékány, I., Hajdu, G., Grebel, E. K., et al. 2018, ApJ, 857, 54
- de Grijs & Bono (2016) de Grijs, R., & Bono, G. 2016, ApJS, 227, 5
- Elorrieta et al. (2016) Elorrieta, F., Eyheramendy, S., Jordán, A., et al. 2016, A&A, 595, A82
- Gieren et al. (2015) Gieren, W., Pilecki, B., Pietrzyński, G., et al. 2015, ApJ, 815, 28
- González-Fernández et al. (2017) González-Fernández, C., Hodgkin, S. T., Irwin, M. J., et al. 2017, arXiv:1711.08805
- Gran et al. (2016) Gran, F., Minniti, D., Saito, R. K., et al. 2016, A&A, 591, A145
- Majaess (2010) Majaess, D. 2010, Acta Astron., 60, 121
- Majaess et al. (2011a) Majaess, D., Turner, D., & Gieren, W. 2011 (a), ApJ, 741, L36
- Majaess et al. (2011b) Majaess, D. J., Turner, D. G., Lane, D. J., Henden, A. A., & Krajci, T. 2011 (b), JAAVSO, 39, 122
- Majaess et al. (2012) Majaess, D., Turner, D., Gieren, W., & Lane, D. 2012, ApJ, 752, L10
- Majaess et al. (2016) Majaess, D., Turner, D., Dékány, I., Minniti, D., & Gieren, W. 2016, A&A, 593, A124
- Mateu et al. (2018) Mateu, C., Read, J. I., & Kawata, D. 2018, MNRAS, 474, 4112
- Minniti et al. (2010) Minniti, D., Lucas, P. W., Emerson, J. P., et al. 2010, New A, 15, 433
- Minniti et al. (2017a) Minniti, D., Dékány, I., Majaess, D., et al. 2017 (a), AJ, 153, 179
- Minniti et al. (2017b) Minniti, D., Palma, T., Dékány, I., et al. 2017 (b), ApJ, 838, L14
- Minniti et al. (2018) Minniti, D., Saito, R. K., Gonzalez, O. A., et al. 2018, arXiv:1804.07785
- Monson & Pierce (2011) Monson, A. J., & Pierce, M. J. 2011, ApJS, 193, 12
- Muraveva et al. (2015) Muraveva, T., Palmer, M., Clementini, G., et al. 2015, ApJ, 807, 127
- Pietrukowicz et al. (2015) Pietrukowicz, P., Kozłowski, S., Skowron, J., et al. 2015, ApJ, 811, 113
- Pietrzyński et al. (2013) Pietrzyński, G., Graczyk, D., Gieren, W., et al. 2013, Nature, 495, 76
- Saito et al. (2012) Saito, R. K., Hempel, M., Minniti, D., et al. 2012, A&A, 537, A107
- Smith et al. (2007) Smith, M. C., Woźniak, P., Mao, S., & Sumi, T. 2007, MNRAS, 380, 805
- Soszyński et al. (2009) Soszyński, I., Udalski, A., Szymański, M. K., et al. 2009, Acta Astron., 59, 1
- Soszyński et al. (2014) Soszyński, I., Udalski, A., Szymański, M. K., et al. 2014, Acta Astron., 64, 177
- Turner (2014) Turner, D. G. 2014, Canadian Journal of Physics, 92, 959
- Udalski (2003) Udalski, A. 2003, ApJ, 590, 284
- Zechmeister & Kürster (2009) Zechmeister, M., & Kürster, M. 2009, A&A, 496, 577