The dearth of difference between central and satellite galaxies I. Perspectives on star formation quenching and AGN activities
Abstract
We investigate the quenching properties of central and satellite galaxies, utilizing the halo masses and central-satellite identifications from the SDSS galaxy group catalog of Yang et al. We find that the quenched fractions of centrals and satellites of similar stellar masses have similar dependence on host halo mass. The similarity of the two populations is also found in terms of specific star formation rate and 4000 Å break. The quenched fractions of centrals and satellites of similar masses show similar dependencies on bulge-to-total light ratio, central velocity dispersion and halo-centric distance in halos of given halo masses. The prevalence of optical/radio-loud AGNs is found to be similar for centrals and satellites at given stellar masses. All these findings strongly suggest that centrals and satellites of similar masses experience similar quenching processes in their host halos. We discuss implications of our results for the understanding of galaxy quenching.
Subject headings:
galaxies: general – methods: observational1. Introduction
Large imaging and spectroscopic surveys of galaxies have revealed a pronounced bimodality in the distributions of the rest-frame color and star formation rate of galaxies (e.g. Strateva et al., 2001; Baldry et al., 2004; Bell et al., 2004; Blanton et al., 2005b; Faber et al., 2007; Wetzel et al., 2012). Hence, galaxies are naturally divided into a population of star forming galaxies, and a quenched (or quiescent) population. Galaxies in the star-forming population typically have on-going star formation activity with disk-like morphology, while the quenched population typically reveals little to no ongoing star formation, and a spheroid-like morphology (Strateva et al., 2001; Kauffmann et al., 2003; Baldry et al., 2004; Brinchmann et al., 2004; Li et al., 2006; Muzzin et al., 2013; Barro et al., 2017). This bimodality persists out to redshift of at least 2.5 (e.g. Bundy et al., 2006; Faber et al., 2007; Martin et al., 2007; Brammer et al., 2009; Muzzin et al., 2012; Huang et al., 2013). In addition the prevalence of the quenched fraction has increased significantly since redshift (Muzzin et al., 2013; Tomczak et al., 2014; Barro et al., 2017), indicating that star formation cessation is one of the theme songs in galaxy evolution over the past 8 Gyr. Following convention in the literature, we refer to this star formation cessation as “quenching”.
Although a complete picture of star formation quenching is still lacking, recent studies have shown that the quenched fraction of galaxies exhibits strong dependence both on the galaxy’s internal structure, such as bulge-to-total ratio, Sérsic index, central stellar mass density and central velocity dispersion (e.g. Driver et al., 2006; Cameron et al., 2009; Wuyts et al., 2011; Mendel et al., 2013; Fang et al., 2013; Bluck et al., 2014; Lang et al., 2014; Bluck et al., 2016; Barro et al., 2017; Wang et al., 2017, 2018a), and on properties of the environment within which the galaxy resides, such as local matter/galaxy density, morphology of the large scale structure, and host halo mass (e.g. Balogh et al., 2004; Weinmann et al., 2006; van den Bosch et al., 2008a; Peng et al., 2010, 2012; Wetzel et al., 2013; Woo et al., 2013; Bluck et al., 2014; Woo et al., 2015; Wang et al., 2016). These findings suggest that both internal and environmental mechanisms may be important in quenching star formation.
In the current cold dark matter (CDM) cosmogony, galaxies are assumed to form and evolve within dark matter halos (e.g. White & Rees, 1978; Mo et al., 2010). In a halo, the dominant galaxy, which usually resides near the halo center (e.g., Lange et al., 2018), is referred to as the central galaxy, while other galaxies that orbit the central are referred to as satellites. Central and satellite galaxies are often investigated separately, as the dominating quenching mechanisms for the two populations are believed to be different (e.g. Weinmann et al., 2006; van den Bosch et al., 2008a; Peng et al., 2010; Woo et al., 2013; Bluck et al., 2014; Woo et al., 2015; Knobel et al., 2015).
For centrals, the quenched fraction is found to be strongly correlated with their internal structure, but only weakly with the environmental density and host halo mass (Peng et al., 2010; Fang et al., 2013; Bluck et al., 2014; Woo et al., 2015). For example, the presence of a massive bulge appears to be a necessary condition for quenching star formation, as claimed in Bell (2008), Cheung et al. (2012) and Fang et al. (2013). More recently, Teimoorinia et al. (2016) argued that the central velocity dispersion of galaxies is more closely linked to the cessation of star formation than any other variable considered, including bulge mass and halo mass, suggesting that quenching is related to the central supermassive black holes through active galactic nucleus (AGN) feedback (e.g Croton et al., 2006; Henriques et al., 2015; Schaye et al., 2015). Indeed, hydrodynamic simulations have shown that the AGN-driven radiation, jets and winds can lead to the ejection or heating of the interstellar medium of galaxies and/or intra-cluster medium, thereby suppressing star formation and maintaining quiescence (e.g. Sijacki et al., 2007; Dubois et al., 2012; Cicone et al., 2014). However, observational evidence for star formation quenching by AGN feedback remains elusive. In fact, both positive and negative feedback effects have been claimed in the literature (e.g. Fabian, 2012; Mullaney et al., 2012, 2015; Delvecchio et al., 2015; Rodighiero et al., 2015; Mahoro et al., 2017; Kalfountzou et al., 2017). Finally, in halos with massed above a few , shock heating may effectively reduce gas cooling, thereby reducing star formation efficiency in central galaxies (Rees & Ostriker, 1977; Birnboim & Dekel, 2003; Dekel & Birnboim, 2006), although it is not obvious whether this can explain the dependence of quenching on the intrinsic properties of galaxies.
For satellites, a number of additional ‘satellite-specific’ quenching processes have been suggested, including galaxy mergers (e.g. Conselice et al., 2003; Cox et al., 2006; Cheung et al., 2012), tidal interaction (Toomre & Toomre, 1972; Read et al., 2006), ram-pressure stripping (e.g. Gunn & Gott, 1972; Abadi et al., 1999; Hester, 2006; Wang et al., 2015), strangulation (Larson et al., 1980; Balogh et al., 2000; van den Bosch et al., 2008a; Weinmann et al., 2009), and galaxy harassment (Farouki & Shapiro, 1981; Moore et al., 1996, 1998). Different from centrals, the quenched fraction of satellites has been found to depend on the number density of surrounding galaxies (Peng et al., 2010, 2012). More recently, Woo et al. (2015) found that quenching of satellites is strongly correlated with the distance to cluster/group center, indicating that denser environments are more effective at quenching galaxies (see also Gómez et al., 2003; Balogh et al., 2004; Blanton & Roweis, 2007; Haines et al., 2007; Wolf et al., 2009; Wetzel et al., 2012; Woo et al., 2013). Note, though, that such a trend may also arise from the stellar mass dependence of quenching combined with mass segregation (van den Bosch et al., 2008b), and/or from the fact that satellites at smaller halo-centric distances have, on average, been accreted earlier (e.g., van den Bosch et al., 2016), and therefore exposed to satellite-specific quenching processes longer.
Given that environmental effects may affect centrals and satellites differently, a comparison between the two galaxy populations in their star formation properties may provide an avenue to understand the importance of environmental quenching (van den Bosch et al., 2008a; Wetzel et al., 2012; Peng et al., 2012; Hirschmann et al., 2014; Knobel et al., 2015; Spindler & Wake, 2017; Wang et al., 2018b). Indeed, numerous earlier investigations have found that satellites tend to be more quenched than centrals of the same stellar mass (van den Bosch et al., 2008a; Wetzel et al., 2012; Peng et al., 2012; Woo et al., 2013; Bluck et al., 2014, 2016). These results have been widely interpreted as evidence for satellites experiencing some specific quenching processes. However, there are also indications that centrals and satellites may actually not be that different. For example, Hirschmann et al. (2014) found that centrals and satellites show similar quenching behavior with local densities, when dividing galaxies into a series of narrow stellar mass bins. Knobel et al. (2015) found that centrals that have massive satellites respond to environments in the same way as satellites of the same stellar mass. More recently, Wang et al. (2018b) analyzed the environmental quenching efficiency that quantifies the quenched fraction as a function of halo mass, and found that centrals and satellites respond to their halo masses in a similar way. Furthermore, they found that the difference between centrals and satellites seen in previous investigations arises largely from the fact that centrals and satellites of the same stellar mass reside, on average, in halos of different masses. These results strongly suggest that host halo mass is the prime environmental parameter that regulates the quenching of both centrals and satellites.
As many galaxy properties are correlated, well controlled samples are needed in order to investigate whether or not the differences seen between centrals and satellites are truly due to different evolutionary processes instead of due to sample selections. In this paper, we extend the analysis of our previous work (Wang et al., 2018b) and present a comprehensive comparison between the central and satellite populations in a number of properties related to star formation and quenching. These include the quenched fraction, the 4000 Å break, specific star formation rate and the prevalence of optical/radio-loud AGNs for galaxies controlled both in stellar mass and host halo mass, as well as the quenched fraction as a function of bulge-to-total ratio, galaxy central velocity dispersion and halo-centric radius. The remainder of the paper is structured as follows. Section 2 presents the observational data and the definitions of physical properties we use in our analysis. We present our results for star formation quenching in §3, and for AGN activities in §4. Finally, we summarize our results and discuss their implications in §5. The cosmology used is that of WMAP3 (Spergel et al., 2007): , and , which is the same as that adopted for the group catalog used here (Yang et al., 2007).
2. Observational data
2.1. Galaxies
2.1.1 The galaxy sample
Our galaxy sample is selected from the New York University Value Added Galaxy Catalog111http://cosmo.nyu.edu/blanton/vagc (NYU-VAGC; Blanton et al., 2005a) of the SDSS DR7 (Abazajian et al., 2009). We selected galaxies with redshift in the range of , with spectroscopic completeness () greater than 0.7, and with the -band flux-limited of , which result in 544,328 galaxies. The first two criteria ensure that the selected galaxies are the same as those used in the construction of the group catalog (Yang et al., 2007, 2009) adopted here. We combine the sample with MPA-JHU catalog222http://wwwmpa.mpa-garching.mpg.de/SDSS/DR7 (Kauffmann et al., 2003; Brinchmann et al., 2004) and the bulge+disk decomposition catalog of Simard et al. (2011) to obtain derived quantities of individual galaxies, with excluding the unmatched sources ().
The MPA-JHU catalog provides the measurements of the main physical parameters used in this paper, such as star formation rate (SFR), 4000 Å break (Dn(4000)), stellar velocity dispersion (), and the emission line flux. The SFRs are measured by an updated version of the method of Brinchmann et al. (2004) using the Kroupa initial mass function (Kroupa & Weidner, 2003). The 4000 Å break is defined as the ratio of the flux between the red and blue continua at 4000 Å (Balogh et al., 1999). The measurements of the stellar velocity dispersion are based on the SDSS 3-arcsec fiber spectra of the galaxy center. We correct the measurements to the same effective aperture, using the formula of Cappellari et al. (2006):
| (1) |
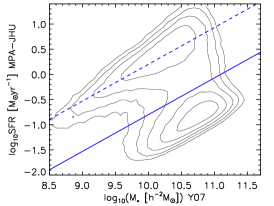
where is the aperture radius, the velocity dispersion measured within the aperture, and the effective radius taken from the NYU-VAGC. The factor of is chosen to be consistent with the measurements in the literature. The catalog of Simard et al. (2011) provides the bulge-to-total light ratios of individual galaxies obtained from the decomposition of the SDSS -band imaging data, with the assumption of a Sérsic () bulge plus an exponential disk. Figure 1 presents the SFR and Dn(4000) as a function of stellar mass, bulge-to-total light ratio and central velocity dispersion, which provides a global impression of the distributions of these parameters for the sample galaxies.


Our final sample contains 524,852 galaxies with measured SFRs, among which about are satellite galaxies. Since the sample is flux-limited at , we assign each galaxy a weight to correct for Malmquist bias and redshift incompleteness. We use these weights throughout, when deriving statistics for our sample of galaxies. Here is the comoving volume between the minimum redshift, , and the maximum redshift, , out to which the galaxy falls within the flux limit of the survey, and is computed using the -correction utilities (v4_2) of Blanton & Roweis (2007).
2.1.2 AGN properties
The optical AGNs used here are identified on the basis of the BPT diagram (Baldwin et al., 1981), which can be used to separate type II AGNs (ones with only narrow lines) from star forming galaxies and composite galaxies (Kewley et al., 2001). The fluxes of the relevant emission lines, such as H, H, [OIII]5007 and [NII]6583, are taken from the MPA-JHU catalog (Brinchmann et al., 2004). We only identify strong AGNs (Seyfert galaxies) using the Seyfert-LINER333Low Ionization Nuclear Emission-line Region demarcation given by Cid Fernandes et al. (2010). Following Pasquali et al. (2009), we require the relevant emission lines to have signal-to-noise ratios greater than , and the emission line fluxes are corrected for intrinsic extinction based on the Balmer decrement and a dust attenuation curve of the form (Charlot & Fall, 2000), assuming an intrinsic ratio (Osterbrock, 1989).
The radio-loud AGNs are obtained by matching the galaxies in our sample with the radio galaxy catalog of Best & Heckman (2012). This radio galaxy catalog is constructed by cross-matching the MPA-JHU catalog with both the NVSS (the National Radio Astronomy Observatory (NRAO) Very Large Array (VLA) Sky Survey; Condon et al., 1998) and FIRST (the Faint Images of the Radio Sky at Twenty centimetres; Becker et al., 1995) survey following the method of Best et al. (2005). The radio catalog has a flux-density limit of 5 mJy, which corresponds to a luminosity of W Hz-1 at . We therefore restrict our sample to and cross-match with sources with W Hz-1. Radio sources associated with star-forming galaxies are not included in the sample, as the classification used in Best & Heckman (2012) puts radio-AGNs and star-forming galaxies into two mutually exclusive classes. The correction is recalculated for the resulting sample, which is used only for calculating the radio loud-AGN fractions of centrals and satellites.
2.2. Groups of galaxies
The galaxy groups used in our analysis are taken from the SDSS DR7 group catalog of Yang et al. (2007), which is based on the halo-based group finding algorithm developed in Yang et al. (2005). For each galaxy in our sample, this group catalog provides properties of the inferred host halo (e.g., mass and size), and indicates whether the galaxy is a central or a satellite. The WMAP3 cosmology (Spergel et al., 2007) is assumed both in the group finder and in calculating quantities of groups and member galaxies. For each galaxy group, two different halo masses are assigned; one based on its characteristic stellar mass and one based on its characteristic luminosity. Here we use the former definition, and identify the central galaxy to be the most massive one in a given group, as recommended in the original papers. For of all groups, no halo mass is available due to limitations of the ranking-based halo mass assignment method. Since these groups are the least massive ones, we assign them to our lowest halo mass bin () in the statistics that follow. Finally, in order to reduce boundary effects, we exclude groups with , where is the fraction of the volume of a group that lies within the survey boundary. We refer the reader to Yang et al. (2005) and Yang et al. (2007) for details.
The stellar masses used for the group finder were taken from the NYU-VAGC (Blanton et al., 2005a), and were calculated using the relation between the stellar mass-to-light ratio and the color, as given in Bell et al. (2003). Since the halo masses are based on these stellar mass estimates, we use these stellar masses for all our analyses. The halo radius of a group is estimated as
| (2) |
where is the redshift of the group center, and is the radius within which the dark matter halo has an overdensity of . For each galaxy, we define a scaled halo-centric radius , which is the projected distance from the galaxy to the host group center in units of the halo virial radius of the host group. The group center used here is the luminosity-weighted center of galaxies, which means that central galaxies do not always locate in the group center.
2.3. Statistical quantities
The bimodal distribution of galaxies in the color-magnitude diagram is observed both in the local universe and in high redshift (e.g. Strateva et al., 2001; Baldry et al., 2004; Faber et al., 2007; Erfanianfar et al., 2016). Based on this bimodality, galaxies can be divided into a star-forming (SF) population and a quenched population according to the color-magnitude diagram or the SFR-stellar mass diagram. As shown in Figure 1, a bimodal distribution is seen in each of the panels, indicating how the star-forming and quenched populations are separated in the corresponding parameter space. The top left panel of Figure 1 shows the SFR - stellar mass relation for galaxies in our sample. To separate galaxies in our sample into a star-forming population and a quenched population, we adopt the demarcation line suggested by Bluck et al. (2016), which is parallel to but 1 dex below the star formation main sequence and can be written as:
| (3) |
where the reduced Hubble constant (the Hubble constant in the units of ) is included here to convert the units of the stellar mass from used in Bluck et al. (2016) to used here. According to this separation, a quenched galaxy is defined to be the one that has a star formation rate at least a factor of 10 times lower than that of a typical SF galaxy of the same stellar mass. We note that our main result is not sensitive to the definition of quenching. Actually, we have examined the results by adopting a flatter division from Woo et al. (2013) with respect to that of Bluck et al. (2016), and find that the main result still holds.
For a given subsample (S), the quenched fraction () is defined as:
| (4) |
where represents the quenched status of the th galaxy in the subsample ( if the galaxy is quenched, else ), and is the weight of the th galaxy (see §2.1). For a given subsample, the error of the quenched fraction is estimated by using 1000 bootstrap samples. Similarly, the AGN fraction is defined as
| (5) |
where if the th galaxy hosts an AGN, and otherwise.
3. Results of quenched fraction
3.1. Dependence on halo mass and stellar mass
Stellar mass is one of the most important properties of a galaxy, which reflect the total amount of stars that formed in the past, while the host halo mass is one of the most important properties of a dark matter halo. In the standard model, galaxies are believed to form and evolve in dark matter halos. Thus, the properties of galaxies are expected to depend on the properties of their host halos. Halo mass has been widely used to link galaxies to dark matter halos through models such as the halo occupation distribution (e.g. Jing et al., 1998; Zheng et al., 2005; Li et al., 2008), conditional luminosity function (e.g. Yang et al., 2003; van den Bosch et al., 2007), abundance matching (e.g. Mo et al., 1999; Vale & Ostriker, 2006), and empirical parameterization (e.g. Lu et al., 2014; Moster et al., 2017). More recently, Wang et al. (2018b) showed that halo mass is the primary environmental parameter in regulating the quenching of centrals and satellites. In this section, we follow Wang et al. (2018b), and study the relationships between the quenched fraction, stellar mass and host halo mass for centrals and satellites.
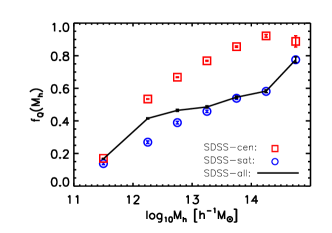
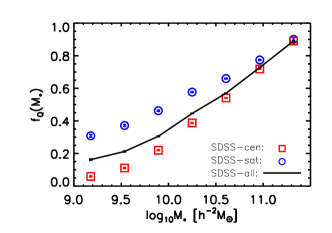
Figure 2 shows the quenched fraction as a function of halo mass (left panel) and stellar mass (right panel) for centrals, satellites and all galaxies, respectively. As expected, the quenched fraction increases with increasing stellar mass and halo mass for both centrals and satellites, and the result is in good agreement with previous findings (e.g. Strateva et al., 2001; Brinchmann et al., 2004; Weinmann et al., 2006; Wetzel et al., 2012; Woo et al., 2013; Bluck et al., 2016). Moreover, centrals are more frequently quenched than satellite galaxies at given halo mass, which is due the fact that centrals are usually more massive than satellites for a given halo mass. This trend is reversed for a given stellar mass (see also van den Bosch et al., 2008a; Weinmann et al., 2009; Knobel et al., 2013; Bluck et al., 2016; Grootes et al., 2017; Fossati et al., 2017; Wang et al., 2018b), which is usually taken as the evidence for “environmental quenching” of satellite galaxies.
However, when comparing centrals and satellites at a given halo mass, we are comparing two populations with different stellar mass; similarly, when comparison is made at a given stellar mass, we are comparing centrals and satellites in halos of different mass. Hence, it is not clear whether the differences between centrals and satellites arise from ‘being a satellite’ versus ‘being a central’, or from the fact that quenching depends on halo mass and/or stellar mass. Put differently, the data presented above does not rule out, for example, a scenario in which there are no satellite-specific processes that cause quenching; rather, quenching is (probabilistically) governed by the mass of the host halo, and operates equally on centrals and satellites. We can test this, though, by comparing the quenched fractions of centrals and satellites that are controlled for both stellar stellar and halo mass.
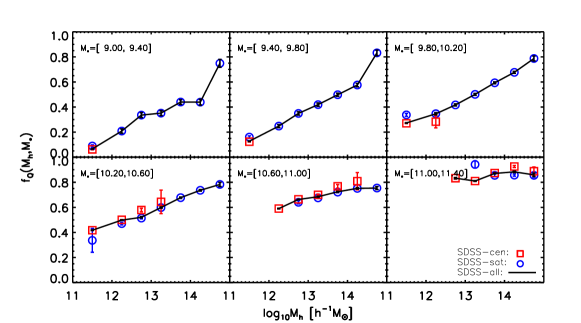
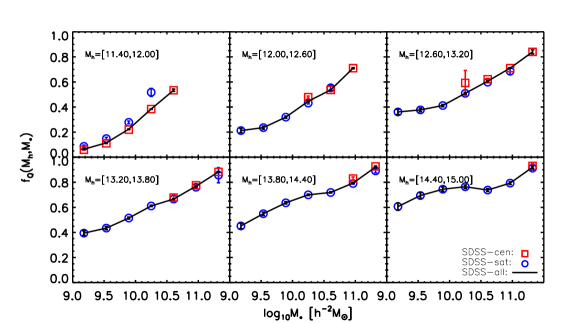
To do this, we separate galaxies into six stellar mass bins of the same width in logarithmic space. The quenched fraction as a function of halo mass for centrals and satellites are shown in the top group of panels in Figure 3. The large differences between centrals and satellites seen in Figure 2 are very much reduced here when comparisons are made in narrow stellar mass bins. Here we see that centrals and satellites have similar fractions of quenched population at given stellar and halo masses. The quenched fraction increases with increasing halo mass over the entire stellar mass range, except the most massive bin. The dependence of the quenched fraction on halo mass becomes weaker as the stellar mass increases, which may indicate a transition of the dominated quenching mechanism from environmental to internal processes (Peng et al., 2010; Woo et al., 2015).
We also form samples by dividing galaxies into six uniform halo mass bins in logarithmic space and present the quenched fractions as a function of stellar mass in the bottom group of panels in Figure 3. Quenched fraction increases with increasing stellar mass for both centrals and satellites over the whole stellar mass range. Centrals and satellites exhibit virtually identical trends in the - relation in all bins of halo mass. The dependence of the quenched fraction on stellar mass become weaker as halo mass increases.
Using a larger galaxy sample, we have thus confirmed the result of Wang et al. (2018b), that centrals and satellites at a given stellar mass have similar - relations. Although this can be naturally interpreted as evidence that central and satellite galaxies in a given halo are quenched by similar physical processes, we note that there are several alternative interpretations, which are discussed in more detail in §5.
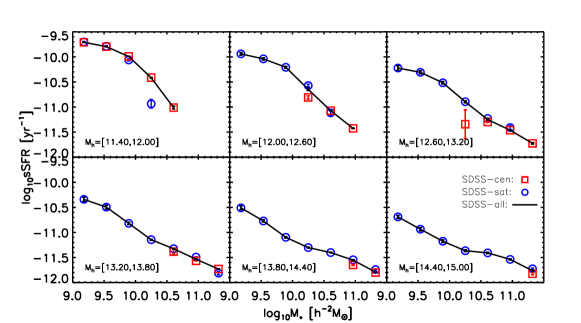
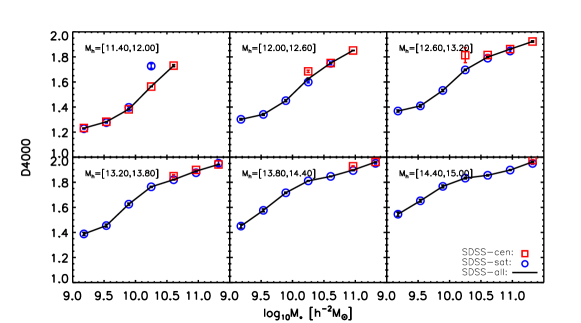
In addition to the quenched fraction, we also present results based on the specific SFR (sSFR) and the 4000 Å break. These two quantities are indicators of the star formation history of a galaxy at different epochs (e.g. Kauffmann et al., 2003; Li et al., 2015). While the sSFR, defined as SFR/, is sensitive to the strength of very recent (within 50 Myr) or on-going star formation, the Dn(4000) is sensitive to the star formation of the galaxy over the past 1-2 Gyr. Figure 4 plots the median sSFRs and median Dn(4000) of centrals and satellites as functions of stellar mass, for different bins in halo mass. Overall, sSFR decreases, and Dn(4000) increases with increasing stellar mass, in each halo mass bin, in agreement with the fact that more massive galaxies tend to host older stellar populations and are more likely to be quenched. More importantly, there is no significant difference in the stellar mass dependence of sSFR and Dn(4000) between centrals and satellites in a given halo mass bin, indicating that the two populations experience, on average, a similar star formation history over the past 2 Gyrs. We have also compared the full distributions of sSFR and Dn(4000) for bins in stellar mass and halo mass, and find that centrals and satellites have distributions, not just medians, that are extremely similar. These results strengthen the notion that the star formation and quenching of centrals and satellites in a halo are governed by the same set of physical processes.
3.2. Dependence on and
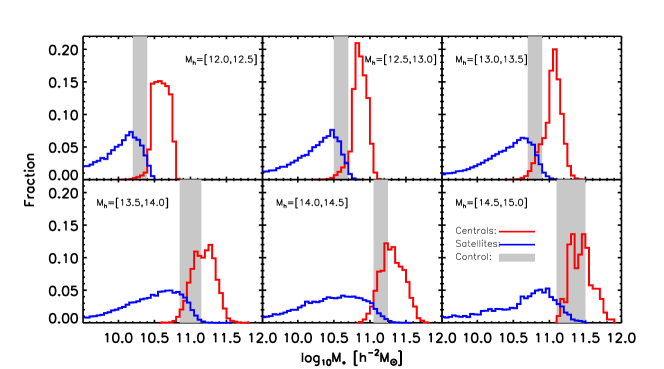
It has been suggested that the structural properties of (central) galaxies may be more closely related to the quenched fraction than stellar mass (e.g. Driver et al., 2006; Bell, 2008; Cameron et al., 2009; Bell et al., 2012; Fang et al., 2013; Bluck et al., 2014; Woo et al., 2015; Bluck et al., 2016; Teimoorinia et al., 2016). Indeed, as shown in Figure 1, SFR and Dn(4000) show strong correlations with and , indicating that galaxies with more pronounced bulge or higher central velocity dispersion are more likely to be quenched. Motivated by this, we investigate the quenched fraction as a function of the bulge-to-total light ratio and central velocity dispersion for centrals and satellites. The goal is to find out whether quenching of star formation in centrals and satellites depends on the structural properties in the same way. Figure 5 shows the normalized stellar mass distributions for centrals and satellites in a series of halo mass bins. As expected, at given halo mass centrals tend to be more massive than satellites. In order to facilitate a comparison of centrals and satellites that are matched in both halo and stellar mass, we select a narrow stellar mass range in each halo mass bin (indicated by the shaded region in each panel), where centrals and satellites overlap, and which is broad enough such that the samples are not too small. We refer to these samples as the ‘controlled’ central/satellite samples, in contrast to the parent samples, to which we refer as ‘total’ central/satellite samples.
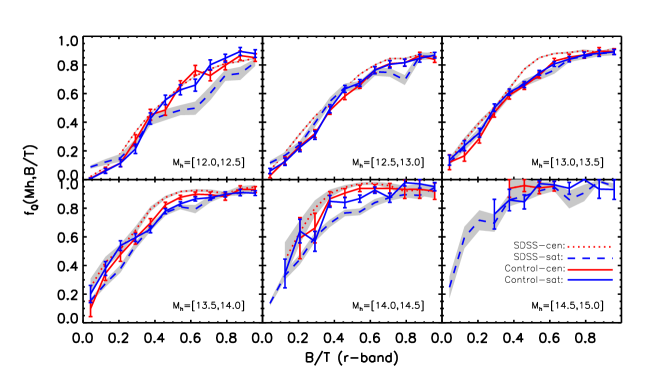
Figure 6 shows the quenched fraction as a function of for centrals and satellites in the six halo mass bins. In each panel, the dotted and dashed lines show the results for the total central and satellites samples, respectively, while the red and blue lines show the results for the corresponding controlled samples. In general, the quenched fraction increases sharply with bulge-to-total light ratio for both centrals and satellites, which is consistent with the previous findings that a massive bulge seems to be a necessary condition for quenching of a central galaxy (Bell, 2008; Fang et al., 2013; Bluck et al., 2014; Barro et al., 2017). Small, but significant differences are apparent between the ‘total’ central and satellite samples in almost all halo mass bins to the extent that, at fixed bulge-to-total light ratio, centrals are more likely to be quenched than satellites. However, this is almost entirely due to the different stellar mass distributions of the two populations. Indeed, the differences disappear, as judged from the error bars, when stellar mass ranges are controlled (red and blue lines in Figure 6). This indicates a dependence of the -B/T relation on stellar mass. We have checked this dependence in a series of halo mass bins, and find that the -B/T relation varies a little at low-to-intermediate stellar mass, while significantly changes at the high stellar mass end (()11.0).
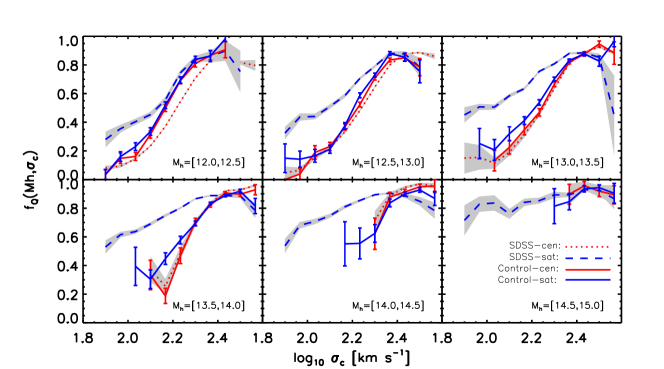
Recently, Teimoorinia et al. (2016) and Bluck et al. (2016) found that central velocity dispersion is more closely linked to the quenching of central galaxies than any other property, including stellar mass, halo mass and bulge mass. Figure 7 shows the quenched fraction as a function of central velocity dispersion separately for centrals and satellites. As in Figure 6, we present the - relations for the total (black line), central (dotted line) and satellite (dashed line) samples, and for the controlled central versus satellite samples (red versus blue solid lines). In general, the quenched fraction increases rapidly with increasing central velocity dispersion for both centrals and satellites. For the total central and satellite samples, significant differences in the - relation are apparent between the two populations at halo masses below . This is in good agreement with Bluck et al. (2016), who found that satellites as a whole are more frequently quenched than centrals at a fixed central velocity dispersion. In addition, the centrals seem to show a steeper - relation than satellites in almost every halo mass bin, except for the most massive one. However, this is almost entirely due to the different stellar mass distribution of the two populations, because the - relation strongly depends on stellar mass at given halos. Indeed, when using the controlled samples instead, the differences are almost entirely eliminated. Hence, we conclude that the data suggests that centrals and satellites obey the same - and - relations, and with similar dependencies on halo mass and stellar mass. This furter supports the notion that there is nothing special about ‘being a satellite’ versus ‘being a central’; rather, quenching is governed by stellar mass and/or halo mass, with no additional dependence on the central vs. satellite nature (but see discussion in §5 below.
3.3. Dependence on halo-centric radius
The various ‘satellite-specific’ quenching processes discussed in the literature (tidal stripping, ram-pressure stripping, strangulation, harassment) all are expected to have an efficiency that depends on the location of a satellite galaxy within its host halo. Indeed, recent analyses have revealed that the quenched population of satellite galaxies becomes more dominant towards the halo center (e.g. Weinmann et al., 2006; van den Bosch et al., 2008b; Wetzel et al., 2012; Woo et al., 2013; Kauffmann et al., 2013). Here we use our data to examine how the quenched fraction depends on halo-centric distance, and in particular, how centrals and satellites compare in this regard.
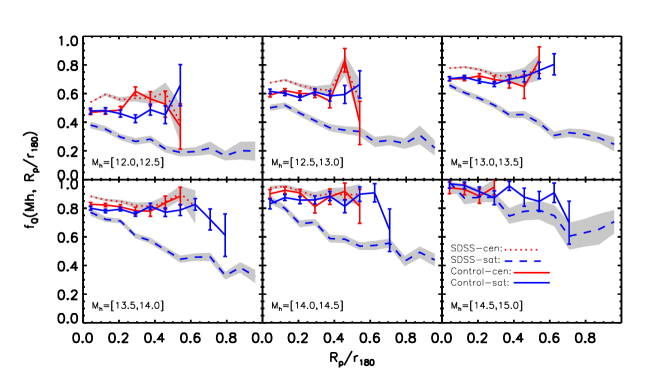
Figure 8 shows the quenched fraction as a function of halo-centric radius for both centrals and satellites in the same six halo mass bins as used in Figures 6 and 7. The halo-centric radius is defined as the projected distance of a galaxy to the (luminosity-weighted) group center (Yang et al., 2007), scaled by the halo virial radius. The latter corresponds to the radius within which the dark matter halo has an overdensity of 180 (see Equation 2).444Since the group center is defined as the luminosity weighted position of all group members, the central galaxy is not necessarily located at the center of the group if it has one or more satellites. As in Figures 6 and 7, we display the relation for the total central and satellite samples in dotted and dashed lines, respectively, and for the controlled centrals and satellites samples in red and blue lines, respectively. For the total satellite sample, the quenched fraction depends strongly on the halo-centric radius, with the quenched fraction decreasing with . These results indicate that galaxies in the inner region of halos may be more affected by environmental processes than galaxies in the outer regions, as expected if quenching arises from, for example, tidal interactions or ram-pressure stripping. Since B/T is found to be a good predictor of star formation quenching, we have examined the B/T as a function of halo-centric radius in a series of stellar mass bins at given halo mass. We find that the shape of - relation resembles the shape of B/T- relation as a whole, suggesting that the dependence on halo-centric radius could be explained by the B/T dependence of halo-centric radius. However, that the existence of massive bulge is the driving factor or the by-product of star formation quenching is still under debate (e.g. Martig et al., 2009; Lilly & Carollo, 2016; Wang et al., 2018a).
For the total central sample, on the other hand, the dependence is rather weak. However, for the controlled samples, these differences between centrals and satellites are almost entirely eliminated, and the quenched fractions for both the central and satellite populations show no significant -dependence. Note that satellites in the controlled sample are located in the high mass tail of the distribution of the total sample (see Figure 5). It is conceivable that more massive satellites are less affected by environmental effects than the less massive ones, which may be the reason why the - relation seen for the controlled satellite sample is flat. This result is also consistent with Wang et al. (2018b) who found that the dependence of the quenched fraction on halo-centric radius appears only for galaxies with masses much lower than that of the central galaxies in their corresponding host halos.
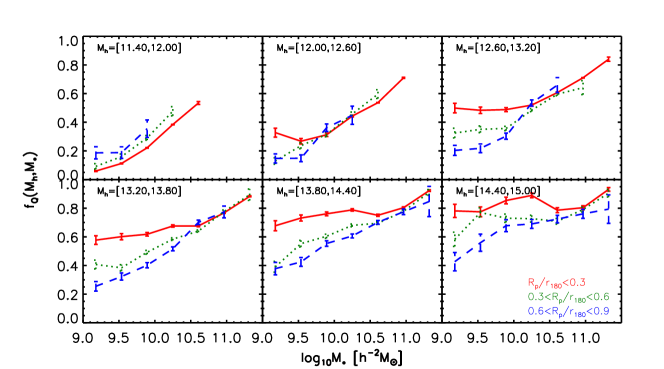
Since the quenching fractions of centrals and satellites of similar stellar mass do not show significant differences in their dependencies on or halo-centric radius, in halos of similar mass, we can look at the - relation without separating centrals and satellites, but for galaxies divided according to their halo-centric distances. Figure 9 shows the quenched fraction versus stellar mass for three intervals of . As one can see, the quenched fraction only depends significantly on halo-centric distance at the low stellar mass end, with galaxies located closer to the group center being more likely to be quenched. This result is in good agreement with previous studies (e.g. Weinmann et al., 2006; Wetzel et al., 2012; Woo et al., 2015; Wang et al., 2018b). Note that, for a given halo mass bin, there appears to be a stellar mass threshold, above which the quenched fraction becomes independent of halo-centric distance. This stellar mass threshold increases with increasing halo mass, from to , as the halo mass increases from to . This agrees with the fact that the quenched fractions of centrals and massive satellites do not show significant dependence on halo-centric distance (cf. Figure 8). It also suggests that, as long as the stellar mass of a galaxy is sufficiently large, the probability for it to be quenched does not depend on its location in the host halo, no matter whether it is a central or a satellite.
4. Results of AGN activities
AGN feedback has been suggested as an important internal quenching process in many galaxy formation models, although its details and efficiency are still unclear and under debate. To shed light on the problem, it is interesting to check whether centrals and satellites have different AGN properties. Here we investigate the populations of optical-selected and radio-loud AGNs in both centrals and satellites.
4.1. The Seyfert fraction
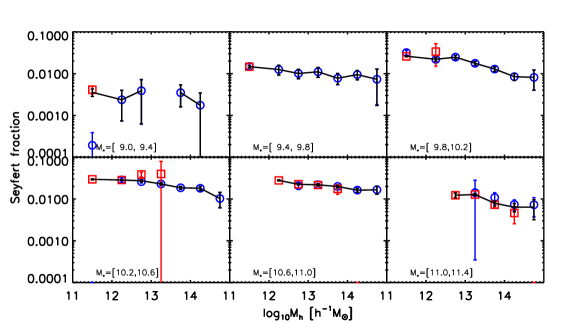
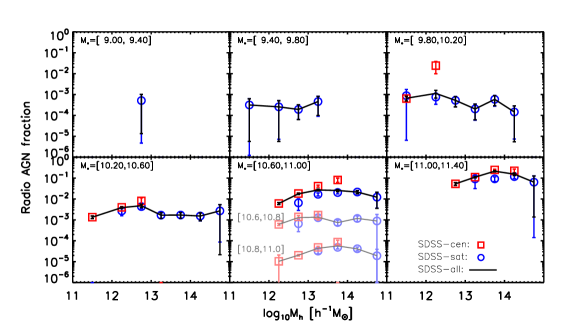
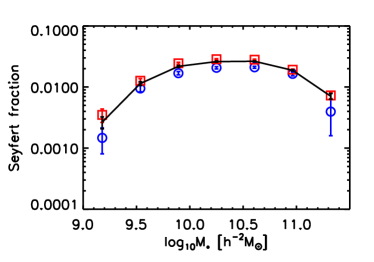
The top panels of Figure 10 shows the fraction of optical-selected AGNs (Seyfert fraction) as a function of halo mass for centrals and satellites in different stellar mass bins. As one can see, the fraction of Seyfert galaxies decreases with increasing halo mass, albeit slowly, in almost all the stellar mass bins. In addition, centrals and satellites of similar stellar masses do not show any significant difference in the Seyfert fraction at fixed halo mass. Since the Seyfert fraction depends only weakly on halo mass for both centrals and satellites, Figure 11 presents the results as a function of stellar mass, without binning in halo mass. As one can see, the fraction of optical-selected AGN peaks around a stellar mass of , in good agreement with the results of Pasquali et al. (2009). In addition, at a given stellar mass, centrals appear to have a slightly higher AGN fraction than satellites. This is caused by the weak anti-correlation between the AGN fraction with halo mass seen in Figure 10, and indeed the difference between centrals and satellites are eliminated when comparisons are made within narrow halo mass bins. The fraction of Seyfert galaxies among centrals and satellites is about 2%-3% in the intermediate stellar mass range, between and , in broad agreement with the percentage, 3%-4%, found in Pasquali et al. (2009) using a different definition of optical AGNs.
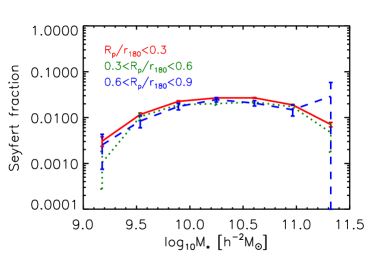
We also examine the dependence of Seyfert fraction on the halo-centric distance without distinguishing centrals from satellites, and the result is shown in the left panel of Figure 12. Remarkably, there is only a very weak dependence of Seyfert fraction on halo-centric distance; galaxies located closer towards the centers of their halos have a slightly enhanced probability of being Seyfert galaxies. However, the slightly higher Seyfert fraction seen in the inner bin is consistent with the slightly higher Seyfert fraction among central galaxies shown in the left panel of Figure 11, combined with the fact that the innermost radial bin has a much higher central fraction than the other bins. Hence, this slight enhancement ultimately owes to the weak anti-correlation between the Seyfert fraction and halo mass seen in Figure 10. No significant difference is found for the other two bins, and . We thus conclude that the Seyfert fraction of galaxies does not depend significantly on halo-centric distance in halos of similar masses, and that there is no discernable difference in the Seyfert fraction of centrals and satellites.
4.2. Radio-loud AGN fraction
The bottom panels of Figure 10 show the radio AGN fraction as a function of halo mass for centrals and satellites in a series of stellar mass bins. In all stellar mass bins shown, the radio-loud AGN fraction of centrals and satellites only depends very weakly on halo mass, if at all. This is in stark contrast to the strong dependence on stellar mass, which is evident from a comparison of the different panels, and is depicted more clearly in the right panel of Figure 11 and discussed below. As for the Seyfert and quenched fractions, the radio loud fractions of centrals and satellites (matched in both stellar and halo mass) are virtually indistinguishable. An exception is the stellar mass bin of (), where centrals appear to have a slightly enhanced radio loud fraction. However, the large difference seen in this stellar mass bin is largely due to the different stellar mass distribution between the two populations. In this bin, the number of satellites shows a rapid decrease, while that of centrals shows a rapid increase, with increasing stellar mass, so that difference in the stellar mass distribution is significant between the two populations. Indeed, when galaxies are further divided into two narrower stellar mass bins, [10.6,10.8] and [10.8,11.0], the difference in radio-loud AGN fraction between centrals and satellites in each of the two bins disappears.
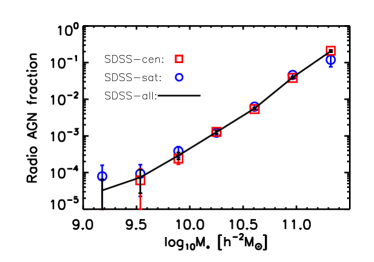
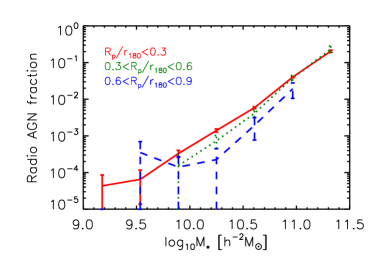
Since the fraction of radio-loud AGN exhibits no significant dependence on halo mass at fixed stellar mass, we show, in the right panel of Figure 11, the fraction of radio-loud AGN as a function of stellar mass without separating galaxies into different halo mass bins. For both centrals and satellites, the radio-loud AGN fraction is strongly correlated with stellar mass (see also Best et al., 2005). The radio-loud fraction increases by more than three orders of magnitude over the stellar mass range covered by our sample. More importantly, there is no significant difference between centrals and satellites over the entire stellar mass range. This is in good agreement with Pasquali et al. (2009), who also used the Yang et al. (2007) group catalog, but appears to be in conflict with the results of Best et al. (2007), who found that brightest cluster galaxies (BCGs) are more likely to host a radio-loud AGN than other galaxies of the same stellar mass. This inconsistency may be due to (1) a difference between our ‘central’ galaxies and the BCGs identified by Best et al. (2007), and (2) the lack of a rigorous control sample in the analysis of Best et al. (2007). In fact, the BCGs used by Best et al. (2007) are defined as the galaxies closest to the deepest point of the gravitational potential well of the cluster (see Von Der Linden et al., 2007, for details). However, the central galaxies used here, are simply defined to be the brightest group members, which do not necessarily reside at the bottoms of their gravitational potential wells (van den Bosch et al., 2005; Von Der Linden et al., 2007; Skibba et al., 2011). As shown in the right panel of Figure 12, the radio-loud fraction does depend weakly, but significantly, on halo-centric distance, in the sense that galaxies in the inner regions of groups/clusters are more likely to host a radio-loud AGN than those of similar stellar mass in the outer regions. The dependence appears to be stronger in the intermediate stellar mass range and becomes insignificant at the massive end. Although the statistics are definitely poor, this may explain the discrepancy between our results and those of Best et al. (2007), if a significant fraction of the centrals they identified are not the most massive cluster galaxies.
Based on the results presented above, we conclude that the likelihood for a central galaxy (defined as the most massive group member) to be an optical or radio-loud AGN is similar to that of a satellite with similar stellar masses. This suggests that both the central engine (the supermassive black hole) and the fuel-supply are similar for centrals and satellites that are matched in both stellar and halo mass.
5. Summary and discussion
It is well established that central and satellite galaxies of the same stellar mass have substantially different properties. In particular, satellites are more likely quenched. This is often interpreted as evidence for ‘satellite-specific’ quenching mechanisms, such as strangulation, ram-pressure stripping, or galaxy harassment. However, at fixed stellar mass, satellite galaxies typically reside in much more massive halos than central galaxies. Hence, an alternative explanation for the difference could be that there is nothing special about being a satellite versus being a central, but there is a strong dependence of quenching on galaxy environment (halo mass in particular). In this paper we have carried out a detailed comparison between central and satellite galaxies with regard to their starformation and AGN activity. In particular, we used the SDSS galaxy group catalog of Yang et al. (2007) to examine the quenched fractions and AGN fractions of centrals and satellites as functions of galaxy stellar mass, host halo mass, galaxy structural properties and halo-centric distances. In order to break the degeneracy between the two ‘alternative interpretations’ mentioned above, and to assess to what extent ‘being a central’ versus ‘being a satellite’ impacts the star formation and/or AGN activity, we compared central and satellite samples that are matched in both stellar mass and halo mass. Our main results are:
-
•
Centrals and satellites show similar - and - relations. This strongly suggests, but does not prove, that centrals and satellites of similar stellar mass experience similar quenching processes. Moreover, the median sSFR and Dn(4000) of the two populations are similar at given stellar mass and halo mass, suggesting similar star formation histories.
-
•
Tight and strong correlations of the quenched fraction with the bulge-to-total light ratio and central velocity dispersion are found for both centrals and satellites. When both halo mass and stellar mass are controlled, centrals and satellites follow identical - and - relations.
-
•
The quenched fraction of centrals exhibits weak or no correlation with the halo-centric distance (), while satellites, in a given bin of halo mass, show a decreasing trend in the quenched fraction from the group center outward. However, when controlling for both stellar and halo mass, the quenched fraction is once again similar for both centrals and satellites.
-
•
Satellite galaxies with stellar masses that are comparable to that of their centrals, have quenched fractions that are not correlated with halo-centric radius. Less massive satellites, however, reveal a clear trend whereby the quenched fraction increases with decreasing halo-centric distance.
-
•
The fraction of central and satellite galaxies that host an optical or radio-loud AGN depends strongly on stellar mass, but only very weakly on halo mass, in excellent agreement with the previous findings. In addition, when controlling for both stellar and halo mass, centrals and satellites have optical/radio-loud AGN fractions that are indistinguishable. All these results suggest that triggering AGN activity has little to no dependence on halo mass, or on being a central versus a satellite.
To summarize, we confirm the finding of Wang et al. (2018b) that, in halos of a given halo mass, the quenched fraction for central galaxies is similar to that for satellites of the same stellar mass. In addition, we have demonstrated that the dependence of the quenched fraction on bulge-to-total light ratio, , central velocity dispersion, , and halo-centric distance, for satellites are indistinguishable from the same relations for centrals, once galaxy stellar mass and host halo mass are controlled for in the comparison. These results suggest that centrals and satellites are indistinguishable in their star formation quenching, namely
| (6) |
Earlier studies by Bell (2008); Cheung et al. (2012); Fang et al. (2013); Bluck et al. (2014, 2016) show that the quenched fraction of central galaxies depends strongly on the central velocity dispersion and bulge-to-total light ratio. In particular, the central velocity dispersion is found to be the most relevant quantity for quenching among a number of other quantities considered (Teimoorinia et al., 2016). Since and are both internal properties of galaxies, their strong relations to quenching may indicate that quenching is predominantly be driven by internal processes. We find that the - and - relations for centrals and satellites are similar once their stellar masses and host halo masses are properly controlled. We also find that the optical/radio-loud AGN fractions in centrals and satellites are also similar. The two results together suggest that the internal quenching processes may operate in a similar way in both centrals and satellites.
The dependence on the halo-centric distance shown in Figure 8 is usually considered as an evidence for environmental effects in galaxy quenching. When a galaxy falls into a galaxy group or a galaxy cluster, it is expected to suffer from a series of environmental effects, such as strangulation, tidal stripping, ram-pressure stripping, and merging with companions (e.g. Gunn & Gott, 1972; Moore et al., 1996; Cox et al., 2006; Read et al., 2006; Boselli & Gavazzi, 2006; Weinmann et al., 2009). These processes, which are thought to operate only on satellites, are expected to be more effective in the central parts of galaxy groups than in the outer regions. However, as pointed out by Wang et al. (2018b), if these processes (or part of them) are indeed the dominant processes quenching star formation in satellites, it would be difficult to understand the similarity in the quenched fraction between centrals and satellites. Our results show that the dependence of the quenched fraction on halo-centric distance is very weak for massive galaxies, regardless whether they are classified as centrals or satellites.
The dependence on halo mass can be produced by various processes, including both internal and environmental processes. If the accretion rate of radio AGNs is positively correlated with the hot gas mass in halo, as is assumed in some semi-analytic models (e.g. Croton et al., 2006; Guo et al., 2011; Henriques et al., 2015), the efficiency of radio AGN feedback is expected to increase with host halo mass. Ram-pressure stripping can also produce a halo-mass dependence, since it is expected to be more important in higher mass halos that contain more hot gas. In addition, shock heating, which heats cold gas through accretion shocks and subsequently reduces gas supply for further star formation, is another mechanism to quench star formation (e.g. Rees & Ostriker, 1977; Dekel & Birnboim, 2006). This quenching process is also expected to be more important in higher mass halos where gas can be heated to higher temperatures. More recently, Gabor & Davé (2015) found that a recipe, in which quenching occurs in regions dominated by hot gas (K) in the hydro-dynamical simulations, can roughly reproduce the trends of the quenched fraction with halo mass, stellar mass and halo-centric distances. Interestingly, their simulations also show that the hot gas has the same quenching effect on centrals and satellites, which is consistent with our results.
We note the readers that there are also alternative explanations for our results. If a central galaxy in a halo of mass falls into, and thus becomes a satellite of, a much bigger halo of mass , it is likely to experience a variety of processes that may cause it to quench. And some off these processes may well be ‘satellite-specific’ in that they only operate on satellite galaxies, with ram-pressure stripping being a good example. However, if the galaxy falls into a halo that is only slightly more massive (i.e., ), our results suggest that this accretion (transition from being a central to being a satellite) has little to no influence on the galaxy’s star formation and/or AGN activity. This is not too surprising. After all, when two halos of comparable mass merge, the dynamical friction time is relatively short, and one expects the two systems to quickly merge. Hence, if we catch the system prior to coalescence of the two galaxies, it means we probably observe the system fairly shortly after the satellite was accreted, and there may simply not have been enough time for (satellite-specific) quenching processes to operate. Indeed, Wetzel et al. (2013) have advocated a fairly long (2-4 Gyr) ‘delay’ time between accretion and the onset of (rapid) quenching. However, it is unclear whether this mechanism can establish the similar dependence of quenching efficiency on halo mass for centrals and satellites (See e.g. Wang et al., 2018b).
Another potential explanation for our results relates to group finder errors. As pointed out in Campbell et al. (2015), group finders are not perfect, and introduce a variety of systematic errors due to the combined effect of errors in group membership determination, central/satellite designation, and halo mass assignments. One of the main tendencies of these errors is to reduce the real difference between centrals and satellites, and to make them appear more similar than they really are. In the second paper of this series (Wang et al., 2018, in preparation), we compare the results obtained here with predictions of the L-GALAXIES semi-analytic galaxy formation model developed by Henriques et al. (2015), and the state-of-the-art hydro-dynamic EAGLE (Evolution and Assembly of GaLaxies and their Environments simulation presented in Schaye et al. (2015). In particular, in order to facilitate a fair and meaningful comparison, we run the same halo-based group finder of Yang et al. (2005) over mock data sets constructed from these models and examine (i) to what extent the group finders wash away potential differences between true centrals and true satellites, and (ii) to what extent L-GALAXIES and EAGLE are able to reproduce the SDSS data.
References
- Abadi et al. (1999) Abadi, M. G., Moore, B., & Bower, R. G. 1999, MNRAS, 308, 947
- Abazajian et al. (2009) Abazajian, K. N., Adelman-McCarthy, J. K., Agüeros, M. A., et al. 2009, ApJS, 182, 543
- Baldry et al. (2004) Baldry, I. K., Glazebrook, K., Brinkmann, J., et al. 2004, ApJ, 600, 681
- Baldwin et al. (1981) Baldwin, J. A., Phillips, M. M., & Terlevich, R. 1981, PASP, 93, 5
- Balogh et al. (2004) Balogh, M. L., Baldry, I. K., Nichol, R., et al. 2004, ApJ, 615, L101
- Balogh et al. (1999) Balogh, M. L., Morris, S. L., Yee, H. K. C., Carlberg, R. G., & Ellingson, E. 1999, ApJ, 527, 54
- Balogh et al. (2000) Balogh, M. L., Navarro, J. F., & Morris, S. L. 2000, ApJ, 540, 113
- Barro et al. (2017) Barro, G., Faber, S. M., Koo, D. C., et al. 2017, ApJ, 840, 47
- Becker et al. (1995) Becker, R. H., White, R. L., & Helfand, D. J. 1995, ApJ, 450, 559
- Bell (2008) Bell, E. F. 2008, ApJ, 682, 355
- Bell et al. (2003) Bell, E. F., McIntosh, D. H., Katz, N., & Weinberg, M. D. 2003, ApJS, 149, 289
- Bell et al. (2004) Bell, E. F., Wolf, C., Meisenheimer, K., et al. 2004, ApJ, 608, 752
- Bell et al. (2012) Bell, E. F., van der Wel, A., Papovich, C., et al. 2012, ApJ, 753, 167
- Best & Heckman (2012) Best, P. N., & Heckman, T. M. 2012, MNRAS, 421, 1569
- Best et al. (2005) Best, P. N., Kauffmann, G., Heckman, T. M., et al. 2005, MNRAS, 362, 25
- Best et al. (2007) Best, P. N., von der Linden, A., Kauffmann, G., Heckman, T. M., & Kaiser, C. R. 2007, MNRAS, 379, 894
- Birnboim & Dekel (2003) Birnboim, Y., & Dekel, A. 2003, MNRAS, 345, 349
- Blanton et al. (2005a) Blanton, M. R., Eisenstein, D., Hogg, D. W., Schlegel, D. J., & Brinkmann, J. 2005a, ApJ, 629, 143
- Blanton & Roweis (2007) Blanton, M. R., & Roweis, S. 2007, AJ, 133, 734
- Blanton et al. (2005b) Blanton, M. R., Schlegel, D. J., Strauss, M. A., et al. 2005b, AJ, 129, 2562
- Bluck et al. (2014) Bluck, A. F. L., Mendel, J. T., Ellison, S. L., et al. 2014, MNRAS, 441, 599
- Bluck et al. (2016) —. 2016, MNRAS, 462, 2559
- Boselli & Gavazzi (2006) Boselli, A., & Gavazzi, G. 2006, PASP, 118, 517
- Brammer et al. (2009) Brammer, G. B., Whitaker, K. E., van Dokkum, P. G., et al. 2009, ApJ, 706, L173
- Brinchmann et al. (2004) Brinchmann, J., Charlot, S., White, S. D. M., et al. 2004, MNRAS, 351, 1151
- Bundy et al. (2006) Bundy, K., Ellis, R. S., Conselice, C. J., et al. 2006, ApJ, 651, 120
- Cameron et al. (2009) Cameron, E., Driver, S. P., Graham, A. W., & Liske, J. 2009, ApJ, 699, 105
- Campbell et al. (2015) Campbell, D., van den Bosch, F. C., Hearin, A., et al. 2015, MNRAS, 452, 444
- Cappellari et al. (2006) Cappellari, M., Bacon, R., Bureau, M., et al. 2006, MNRAS, 366, 1126
- Charlot & Fall (2000) Charlot, S., & Fall, S. M. 2000, ApJ, 539, 718
- Cheung et al. (2012) Cheung, E., Faber, S. M., Koo, D. C., et al. 2012, ApJ, 760, 131
- Cicone et al. (2014) Cicone, C., Maiolino, R., Sturm, E., et al. 2014, A&A, 562, A21
- Cid Fernandes et al. (2010) Cid Fernandes, R., Stasińska, G., Schlickmann, M. S., et al. 2010, MNRAS, 403, 1036
- Condon et al. (1998) Condon, J. J., Cotton, W. D., Greisen, E. W., et al. 1998, AJ, 115, 1693
- Conselice et al. (2003) Conselice, C. J., Chapman, S. C., & Windhorst, R. A. 2003, ApJ, 596, L5
- Cox et al. (2006) Cox, T. J., Jonsson, P., Primack, J. R., & Somerville, R. S. 2006, MNRAS, 373, 1013
- Croton et al. (2006) Croton, D. J., Springel, V., White, S. D. M., et al. 2006, MNRAS, 365, 11
- Dekel & Birnboim (2006) Dekel, A., & Birnboim, Y. 2006, MNRAS, 368, 2
- Delvecchio et al. (2015) Delvecchio, I., Lutz, D., Berta, S., et al. 2015, MNRAS, 449, 373
- Driver et al. (2006) Driver, S. P., Allen, P. D., Graham, A. W., et al. 2006, MNRAS, 368, 414
- Dubois et al. (2012) Dubois, Y., Devriendt, J., Slyz, A., & Teyssier, R. 2012, MNRAS, 420, 2662
- Erfanianfar et al. (2016) Erfanianfar, G., Popesso, P., Finoguenov, A., et al. 2016, MNRAS, 455, 2839
- Faber et al. (2007) Faber, S. M., Willmer, C. N. A., Wolf, C., et al. 2007, ApJ, 665, 265
- Fabian (2012) Fabian, A. C. 2012, ARA&A, 50, 455
- Fang et al. (2013) Fang, J. J., Faber, S. M., Koo, D. C., & Dekel, A. 2013, ApJ, 776, 63
- Farouki & Shapiro (1981) Farouki, R., & Shapiro, S. L. 1981, ApJ, 243, 32
- Fossati et al. (2017) Fossati, M., Wilman, D. J., Mendel, J. T., et al. 2017, ApJ, 835, 153
- Gabor & Davé (2015) Gabor, J. M., & Davé, R. 2015, MNRAS, 447, 374
- Gómez et al. (2003) Gómez, P. L., Nichol, R. C., Miller, C. J., et al. 2003, ApJ, 584, 210
- Grootes et al. (2017) Grootes, M. W., Tuffs, R. J., Popescu, C. C., et al. 2017, AJ, 153, 111
- Gunn & Gott (1972) Gunn, J. E., & Gott, III, J. R. 1972, ApJ, 176, 1
- Guo et al. (2011) Guo, Q., White, S., Boylan-Kolchin, M., et al. 2011, MNRAS, 413, 101
- Haines et al. (2007) Haines, C. P., Gargiulo, A., Mercurio, A., et al. 2007, in Cosmic Frontiers, ed. N. Metcalfe & T. Shanks, Vol. 379, 206
- Henriques et al. (2015) Henriques, B. M. B., White, S. D. M., Thomas, P. A., et al. 2015, MNRAS, 451, 2663
- Hester (2006) Hester, J. A. 2006, ApJ, 647, 910
- Hirschmann et al. (2014) Hirschmann, M., De Lucia, G., Wilman, D., et al. 2014, MNRAS, 444, 2938
- Huang et al. (2013) Huang, J.-S., Faber, S. M., Willmer, C. N. A., et al. 2013, ApJ, 766, 21
- Jing et al. (1998) Jing, Y. P., Mo, H. J., & Börner, G. 1998, ApJ, 494, 1
- Kalfountzou et al. (2017) Kalfountzou, E., Stevens, J. A., Jarvis, M. J., et al. 2017, MNRAS, 471, 28
- Kauffmann et al. (2013) Kauffmann, G., Li, C., Zhang, W., & Weinmann, S. 2013, MNRAS, 430, 1447
- Kauffmann et al. (2003) Kauffmann, G., Heckman, T. M., White, S. D. M., et al. 2003, MNRAS, 341, 54
- Kewley et al. (2001) Kewley, L. J., Dopita, M. A., Sutherland, R. S., Heisler, C. A., & Trevena, J. 2001, ApJ, 556, 121
- Knobel et al. (2015) Knobel, C., Lilly, S. J., Woo, J., & Kovač, K. 2015, ApJ, 800, 24
- Knobel et al. (2013) Knobel, C., Lilly, S. J., Kovač, K., et al. 2013, ApJ, 769, 24
- Kroupa & Weidner (2003) Kroupa, P., & Weidner, C. 2003, ApJ, 598, 1076
- Lang et al. (2014) Lang, P., Wuyts, S., Somerville, R. S., et al. 2014, ApJ, 788, 11
- Lange et al. (2018) Lange, J. U., van den Bosch, F. C., Hearin, A., et al. 2018, MNRAS, 473, 2830
- Larson et al. (1980) Larson, R. B., Tinsley, B. M., & Caldwell, C. N. 1980, ApJ, 237, 692
- Li et al. (2008) Li, C., Kauffmann, G., Heckman, T. M., White, S. D. M., & Jing, Y. P. 2008, MNRAS, 385, 1915
- Li et al. (2006) Li, C., Kauffmann, G., Jing, Y. P., et al. 2006, MNRAS, 368, 21
- Li et al. (2015) Li, C., Wang, E., Lin, L., et al. 2015, ApJ, 804, 125
- Lilly & Carollo (2016) Lilly, S. J., & Carollo, C. M. 2016, ApJ, 833, 1
- Lu et al. (2014) Lu, Z., Mo, H. J., Lu, Y., et al. 2014, MNRAS, 439, 1294
- Mahoro et al. (2017) Mahoro, A., Pović, M., & Nkundabakura, P. 2017, MNRAS, 471, 3226
- Martig et al. (2009) Martig, M., Bournaud, F., Teyssier, R., & Dekel, A. 2009, ApJ, 707, 250
- Martin et al. (2007) Martin, D. C., Wyder, T. K., Schiminovich, D., et al. 2007, ApJS, 173, 342
- Mendel et al. (2013) Mendel, J. T., Simard, L., Ellison, S. L., & Patton, D. R. 2013, MNRAS, 429, 2212
- Mo et al. (2010) Mo, H., van den Bosch, F. C., & White, S. 2010, Galaxy Formation and Evolution
- Mo et al. (1999) Mo, H. J., Mao, S., & White, S. D. M. 1999, MNRAS, 304, 175
- Moore et al. (1996) Moore, B., Katz, N., Lake, G., Dressler, A., & Oemler, A. 1996, Nature, 379, 613
- Moore et al. (1998) Moore, B., Lake, G., & Katz, N. 1998, ApJ, 495, 139
- Moster et al. (2017) Moster, B. P., Naab, T., & White, S. D. M. 2017, ArXiv e-prints
- Mullaney et al. (2012) Mullaney, J. R., Daddi, E., Béthermin, M., et al. 2012, ApJ, 753, L30
- Mullaney et al. (2015) Mullaney, J. R., Alexander, D. M., Aird, J., et al. 2015, MNRAS, 453, L83
- Muzzin et al. (2012) Muzzin, A., Wilson, G., Yee, H. K. C., et al. 2012, ApJ, 746, 188
- Muzzin et al. (2013) Muzzin, A., Marchesini, D., Stefanon, M., et al. 2013, ApJ, 777, 18
- Osterbrock (1989) Osterbrock, D. E. 1989, Astrophysics of gaseous nebulae and active galactic nuclei
- Pasquali et al. (2009) Pasquali, A., van den Bosch, F. C., Mo, H. J., Yang, X., & Somerville, R. 2009, MNRAS, 394, 38
- Peng et al. (2012) Peng, Y.-j., Lilly, S. J., Renzini, A., & Carollo, M. 2012, ApJ, 757, 4
- Peng et al. (2010) Peng, Y.-j., Lilly, S. J., Kovač, K., et al. 2010, ApJ, 721, 193
- Read et al. (2006) Read, J. I., Wilkinson, M. I., Evans, N. W., Gilmore, G., & Kleyna, J. T. 2006, MNRAS, 366, 429
- Rees & Ostriker (1977) Rees, M. J., & Ostriker, J. P. 1977, MNRAS, 179, 541
- Rodighiero et al. (2015) Rodighiero, G., Brusa, M., Daddi, E., et al. 2015, ApJ, 800, L10
- Schaye et al. (2015) Schaye, J., Crain, R. A., Bower, R. G., et al. 2015, MNRAS, 446, 521
- Sijacki et al. (2007) Sijacki, D., Springel, V., Di Matteo, T., & Hernquist, L. 2007, MNRAS, 380, 877
- Simard et al. (2011) Simard, L., Mendel, J. T., Patton, D. R., Ellison, S. L., & McConnachie, A. W. 2011, ApJS, 196, 11
- Skibba et al. (2011) Skibba, R. A., van den Bosch, F. C., Yang, X., et al. 2011, MNRAS, 410, 417
- Spergel et al. (2007) Spergel, D. N., Bean, R., Doré, O., et al. 2007, ApJS, 170, 377
- Spindler & Wake (2017) Spindler, A., & Wake, D. 2017, MNRAS, 468, 333
- Strateva et al. (2001) Strateva, I., Ivezić, Ž., Knapp, G. R., et al. 2001, AJ, 122, 1861
- Teimoorinia et al. (2016) Teimoorinia, H., Bluck, A. F. L., & Ellison, S. L. 2016, MNRAS, 457, 2086
- Tomczak et al. (2014) Tomczak, A. R., Quadri, R. F., Tran, K.-V. H., et al. 2014, ApJ, 783, 85
- Toomre & Toomre (1972) Toomre, A., & Toomre, J. 1972, ApJ, 178, 623
- Vale & Ostriker (2006) Vale, A., & Ostriker, J. P. 2006, MNRAS, 371, 1173
- van den Bosch et al. (2008a) van den Bosch, F. C., Aquino, D., Yang, X., et al. 2008a, MNRAS, 387, 79
- van den Bosch et al. (2016) van den Bosch, F. C., Jiang, F., Campbell, D., & Behroozi, P. 2016, MNRAS, 455, 158
- van den Bosch et al. (2008b) van den Bosch, F. C., Pasquali, A., Yang, X., et al. 2008b, ArXiv e-prints
- van den Bosch et al. (2005) van den Bosch, F. C., Weinmann, S. M., Yang, X., et al. 2005, MNRAS, 361, 1203
- van den Bosch et al. (2007) van den Bosch, F. C., Yang, X., Mo, H. J., et al. 2007, MNRAS, 376, 841
- Von Der Linden et al. (2007) Von Der Linden, A., Best, P. N., Kauffmann, G., & White, S. D. M. 2007, MNRAS, 379, 867
- Wang et al. (2017) Wang, E., Kong, X., Wang, H., et al. 2017, ApJ, 844, 144
- Wang et al. (2015) Wang, E., Wang, J., Kauffmann, G., Józsa, G. I. G., & Li, C. 2015, MNRAS, 449, 2010
- Wang et al. (2018a) Wang, E., Li, C., Xiao, T., et al. 2018a, ApJ, 856, 137
- Wang et al. (2016) Wang, H., Mo, H. J., Yang, X., et al. 2016, ApJ, 831, 164
- Wang et al. (2018b) Wang, H., Mo, H. J., Chen, S., et al. 2018b, ApJ, 852, 31
- Weinmann et al. (2009) Weinmann, S. M., Kauffmann, G., van den Bosch, F. C., et al. 2009, MNRAS, 394, 1213
- Weinmann et al. (2006) Weinmann, S. M., van den Bosch, F. C., Yang, X., & Mo, H. J. 2006, MNRAS, 366, 2
- Wetzel et al. (2012) Wetzel, A. R., Tinker, J. L., & Conroy, C. 2012, MNRAS, 424, 232
- Wetzel et al. (2013) Wetzel, A. R., Tinker, J. L., Conroy, C., & van den Bosch, F. C. 2013, MNRAS, 432, 336
- White & Rees (1978) White, S. D. M., & Rees, M. J. 1978, MNRAS, 183, 341
- Wolf et al. (2009) Wolf, C., Aragón-Salamanca, A., Balogh, M., et al. 2009, MNRAS, 393, 1302
- Woo et al. (2015) Woo, J., Dekel, A., Faber, S. M., & Koo, D. C. 2015, MNRAS, 448, 237
- Woo et al. (2013) Woo, J., Dekel, A., Faber, S. M., et al. 2013, MNRAS, 428, 3306
- Wuyts et al. (2011) Wuyts, S., Förster Schreiber, N. M., van der Wel, A., et al. 2011, ApJ, 742, 96
- Yang et al. (2003) Yang, X., Mo, H. J., & van den Bosch, F. C. 2003, MNRAS, 339, 1057
- Yang et al. (2009) —. 2009, ApJ, 695, 900
- Yang et al. (2005) Yang, X., Mo, H. J., van den Bosch, F. C., & Jing, Y. P. 2005, MNRAS, 356, 1293
- Yang et al. (2007) Yang, X., Mo, H. J., van den Bosch, F. C., et al. 2007, ApJ, 671, 153
- Zheng et al. (2005) Zheng, Z., Berlind, A. A., Weinberg, D. H., et al. 2005, ApJ, 633, 791