A First Principles Investigation of Native Interstitial Diffusion in \ceCr2O3
Abstract
First principles density functional theory (DFT) investigation of native interstitials and the associated self-diffusion mechanisms in -\ceCr2O3 reveals that interstitials are more mobile than vacancies of corresponding species. Cr interstitials occupy the unoccupied Cr sublattice sites that are octahedrally coordinated by 6 O atoms, and O interstitials form a dumbbell configuration orientated along the [221] direction (diagonal) of the corundum lattice. Calculations predict that neutral O interstitials are predominant in O-rich conditions and Cr interstitials in +2 and +1 charge states are the dominant interstitial defects in Cr-rich conditions. Similar to that of the vacancies, the charge transition levels of both O and Cr interstitials are located deep within the bandgap. Transport calculations reveal a rich variety of interstitial diffusion mechanisms that are species, charge, and orientation dependent. Cr interstitials diffuse preferably along the diagonal of corundum lattice in a two step process via an intermediate defect complex comprising a Cr interstitial and an adjacent Cr Frenkel defect in the neighboring Cr bilayer. This mechanism is similar to that of the vacancy mediated Cr diffusion along the c-axis with intermediate Cr vacancy and Cr Frenkel defect combination. In contrast, O interstitials diffuse via bond switching mechanism. O interstitials in -1 and -2 charge states have very high mobility compared to neutral O interstitials.
1 Introduction
The global cost of corrosion is estimated to be US $2.5 trillion annually [1]. To prevent corrosion, many Ni and Fe-based alloys utilize Cr as an alloying element due to its ability to form \ceCr2O3 as a protective oxide coating [2, 3, 4, 5, 6]. These alloys are often used in extreme operating conditions such as in nuclear reactors, where the irradiating conditions can create defects within the protective oxide film, or in turbine blades with high operating temperatures. The effectiveness of these alloys under such extreme conditions has been the subject of many experimental studies [7, 8]. Understanding the mechanism and the limits of corrosion protection offered by \ceCr2O3 requires detailed atomistic models of defect formation and transport in this oxide. Towards this objective, many experimental studies of defects, oxidation mechanisms, and diffusion in \ceCr2O3 were carried out[9, 10, 11, 12, 13, 14, 15]. Some of these studies indicated that Cr interstitials could be the dominant defects in \ceCr2O3 under reducing conditions [14, 15]. Classical Monte Carlo simulations also predicted that Cr interstitials had lower barrier energies and, therefore, higher mobility than vacancies [16]. These studies suggest that interstitials could be controlling the effectiveness of \ceCr2O3 as a protective layer in pressurized water reactors (PWR), where reducing conditions prevail due to the use of hydrogenated water as a coolant.
Advances in experimental, theoretical and computational methods led to a renewed focus on defects and their diffusion mechanisms in \ceCr2O3 in recent years[17, 18, 19, 16, 15, 20, 21]. Within the last decade, first principles density functional theory (DFT) [22, 23, 24] has emerged as a reliable tool to model point defects in bandgap materials in part due to the development of a posteriori correction techniques [25]. However, DFT simulations of defects and their diffusion in \ceCr2O3 were focused exclusively on vacancies [17, 18, 19], while diffusion of interstitials defects has not been studied. To obtain a comprehensive atomistic picture of native defects and their diffusion in \ceCr2O3, here, we investigated Cr and O interstitials in \ceCr2O3 in the charge states ranging between [0, 3] and [-2, 0], respectively, using density functional theory and identified their diffusion mechanisms and pathways.
2 Methods
2.1 Interstitial Site Selection
| Defect | Charge | K-V Notation | Notation in this study |
|---|---|---|---|
| Cr interstitial | 0 | ||
| 1 | |||
| 2 | |||
| 3 | |||
| O interstitial | 0 | ||
| -1 | |||
| -2 |
This work is a continuation from our previous study of vacancies and vacancy mediated self-diffusion in \ceCr2O3 [18]. Therefore, the methods and associated parameters used in this study are the same as those in our study on the vacancies in \ceCr2O3. The notation used in this work for interstitials with different charge states and the corresponding Kroger-Vink notation are provided in Table 1. We used PyCDT [26] and pymatgen [27] to identify potential interstitial sites in \ceCr2O3. The interstitial finding procedure [28] implemented in pymatgen systematically performs a grid based search for potential interstitial sites by evaluating the coordination pattern at each grid point. Grid points that exhibit the coordination patterns resembling basic structural motifs (e.g., tetrahedral and octahedral environments) with high symmetry are identified by this algorithm as potential interstitial sites.
2.2 Density Functional Calculations
Interstitials were modeled with periodic supercell formalism. For charged interstitials, neutralizing background charge was automatically added by the DFT software, making the supercells neutral. Geometry relaxation, barrier energy, and phonon calculations for this study were performed within the DFT framework implemented in the Vienna ab initio simulation package (VASP) [29, 30, 31]. We included Hubbard on-site Coulombic correction (U) using GGA+U method[32, 33]. The basis sets of Cr and O consist of 12 and 6 valence electrons in the configurations of [He]2s22p4 and [Ne 3s2]3p64s23d4 respectively. Further details of GGA+U simulations are given in Supplementary Information (SI). The DFT settings used in this study were unchanged from those used in our previous work on vacancies in \ceCr2O3 [18], and the bulk properties of \ceCr2O3 obtained with these settings can be found in our previous publication. [18]
We used the thermodynamic formalism proposed by Zhang and Northrup [34] to evaluate the formation energies of the interstitials. The formation energy of an interstitial of species with charge , , was calculated as
| (1) |
where is the total energy of the defect supercell, is the total energy of the bulk supercell, is the chemical potential contribution resulting from the removal of the atom/ion of specie X, is the Fermi level and is the correction term, which encompasses the correction to finite-size electrostatic interactions and bandgap underestimation in DFT [18]. The barrier energies were computed using CI-NEB method [35].
The stability of predicted interstitial sites and transition states was evaluated using phonon density of states (PDOS) calculations. The PDOS of stable interstitial sites should exhibit no imaginary frequencies, while the transition states, being saddle points, should have one imaginary frequency in their PDOS. Additional details about the phonon calculations are provided in the SI.
3 Results and Discussion
3.1 Potential Interstitial Sites
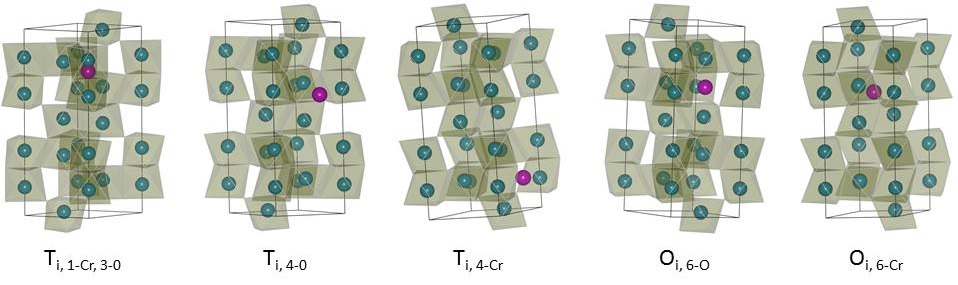
The order-parameter based interstitial finding algorithm introduced by Zimmerman et al. [28] identified five potential interstitial sites and their positions are shown in Figure 1. Among the potential interstitial sites, three are tetrahedral sites and the remaining two are octahedral sites, which are defined by their coordination numbers as well as the coordinating elements. represents an octahedral interstitial site surrounded by Cr sites and O sites. Similarly represents a tetrahedral interstitial site with Cr sites and O sites as neighbors. Of these sites, the site was found to be too close to the regular corundum lattice sites and ignored. The remaining four sites were populated either by Cr or O and the structure of the resultant defect supercells were optimized. The Cr and O interstitial defects were initially assigned with charge states in the range of [0,6] and [-2, 0] respectively.
The resulting uncorrected interstitial formation energies are shown in Figure S1 in SI. The large differences in the calculated formation energies for the different interstitial positions in the lattice indicate that site is the most favorable interstitial site for both O and Cr interstitials (denoted as and respectively). Hence for further analysis, we considered only the 6-O coordinated octahedral interstitial site. Further on, we use standard notation of and for Cr and O interstitials at the 6-O coordinated octahedral site instead of and , respectively. The uncorrected formation energies for charge states of 4, 5 and 6 are very high when compared to those of the charge states in the range [0, 3], and hence the charge states of 46 for are ignored in this study.
3.2 Interstitials
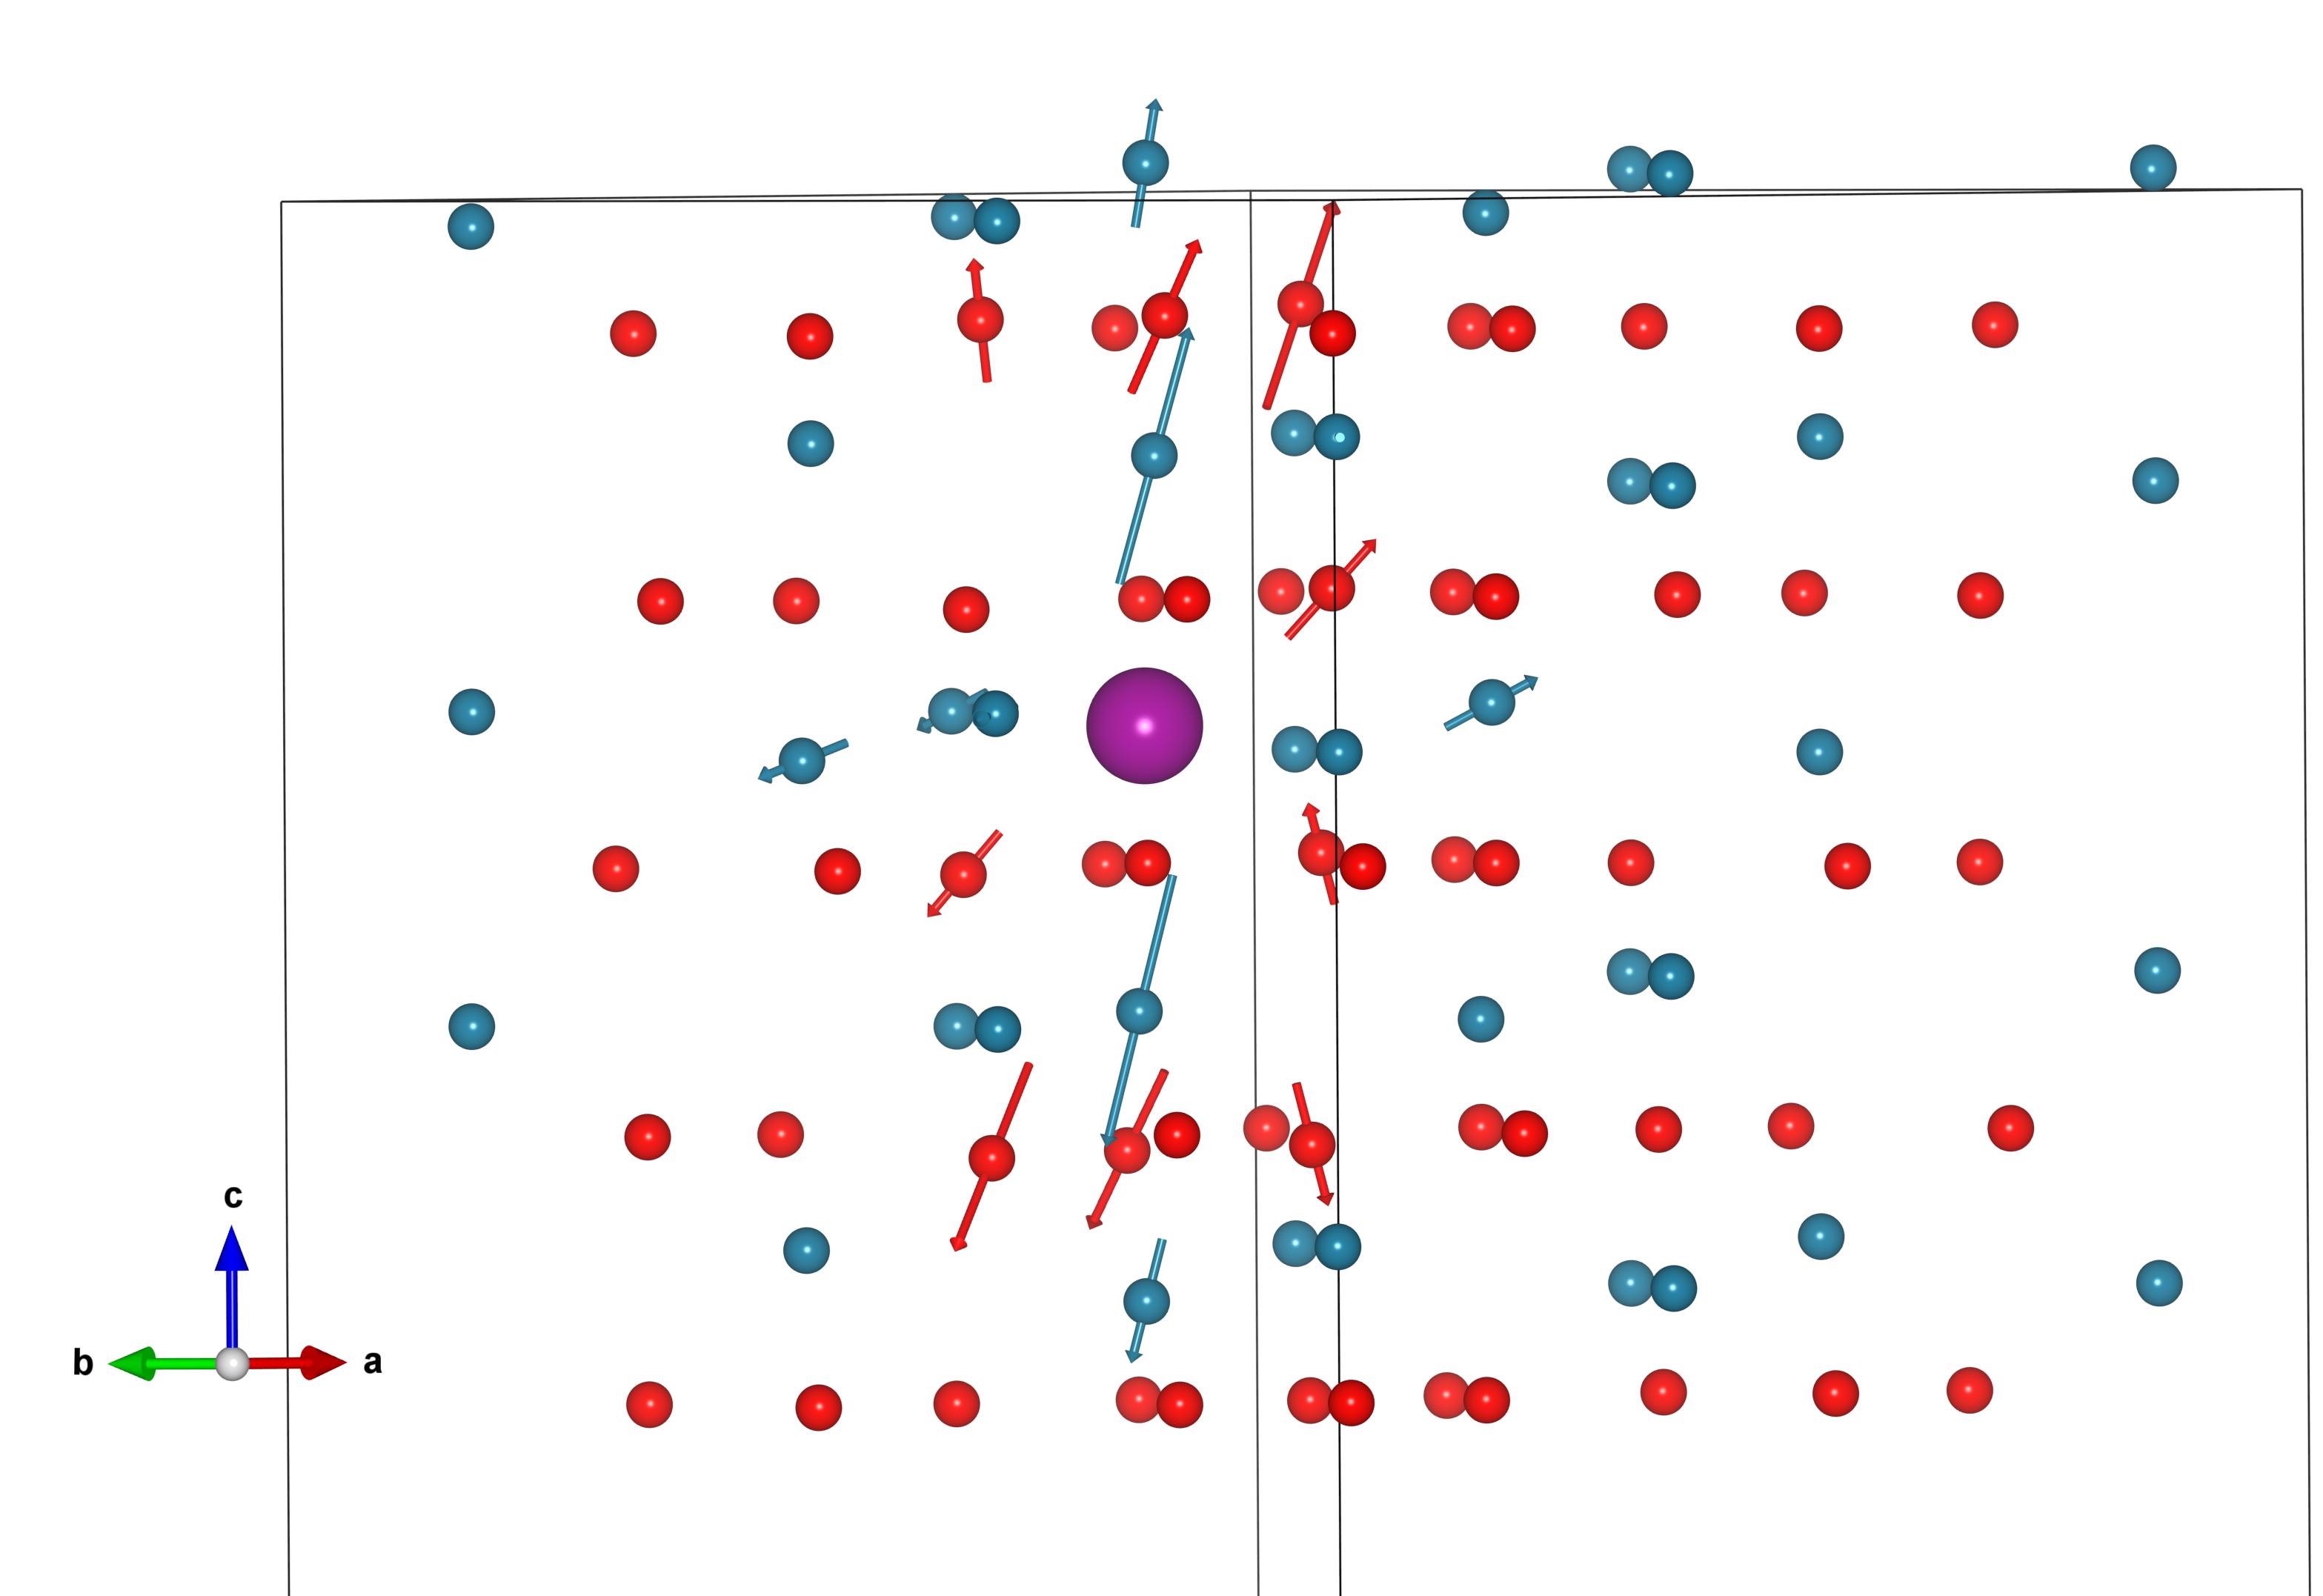
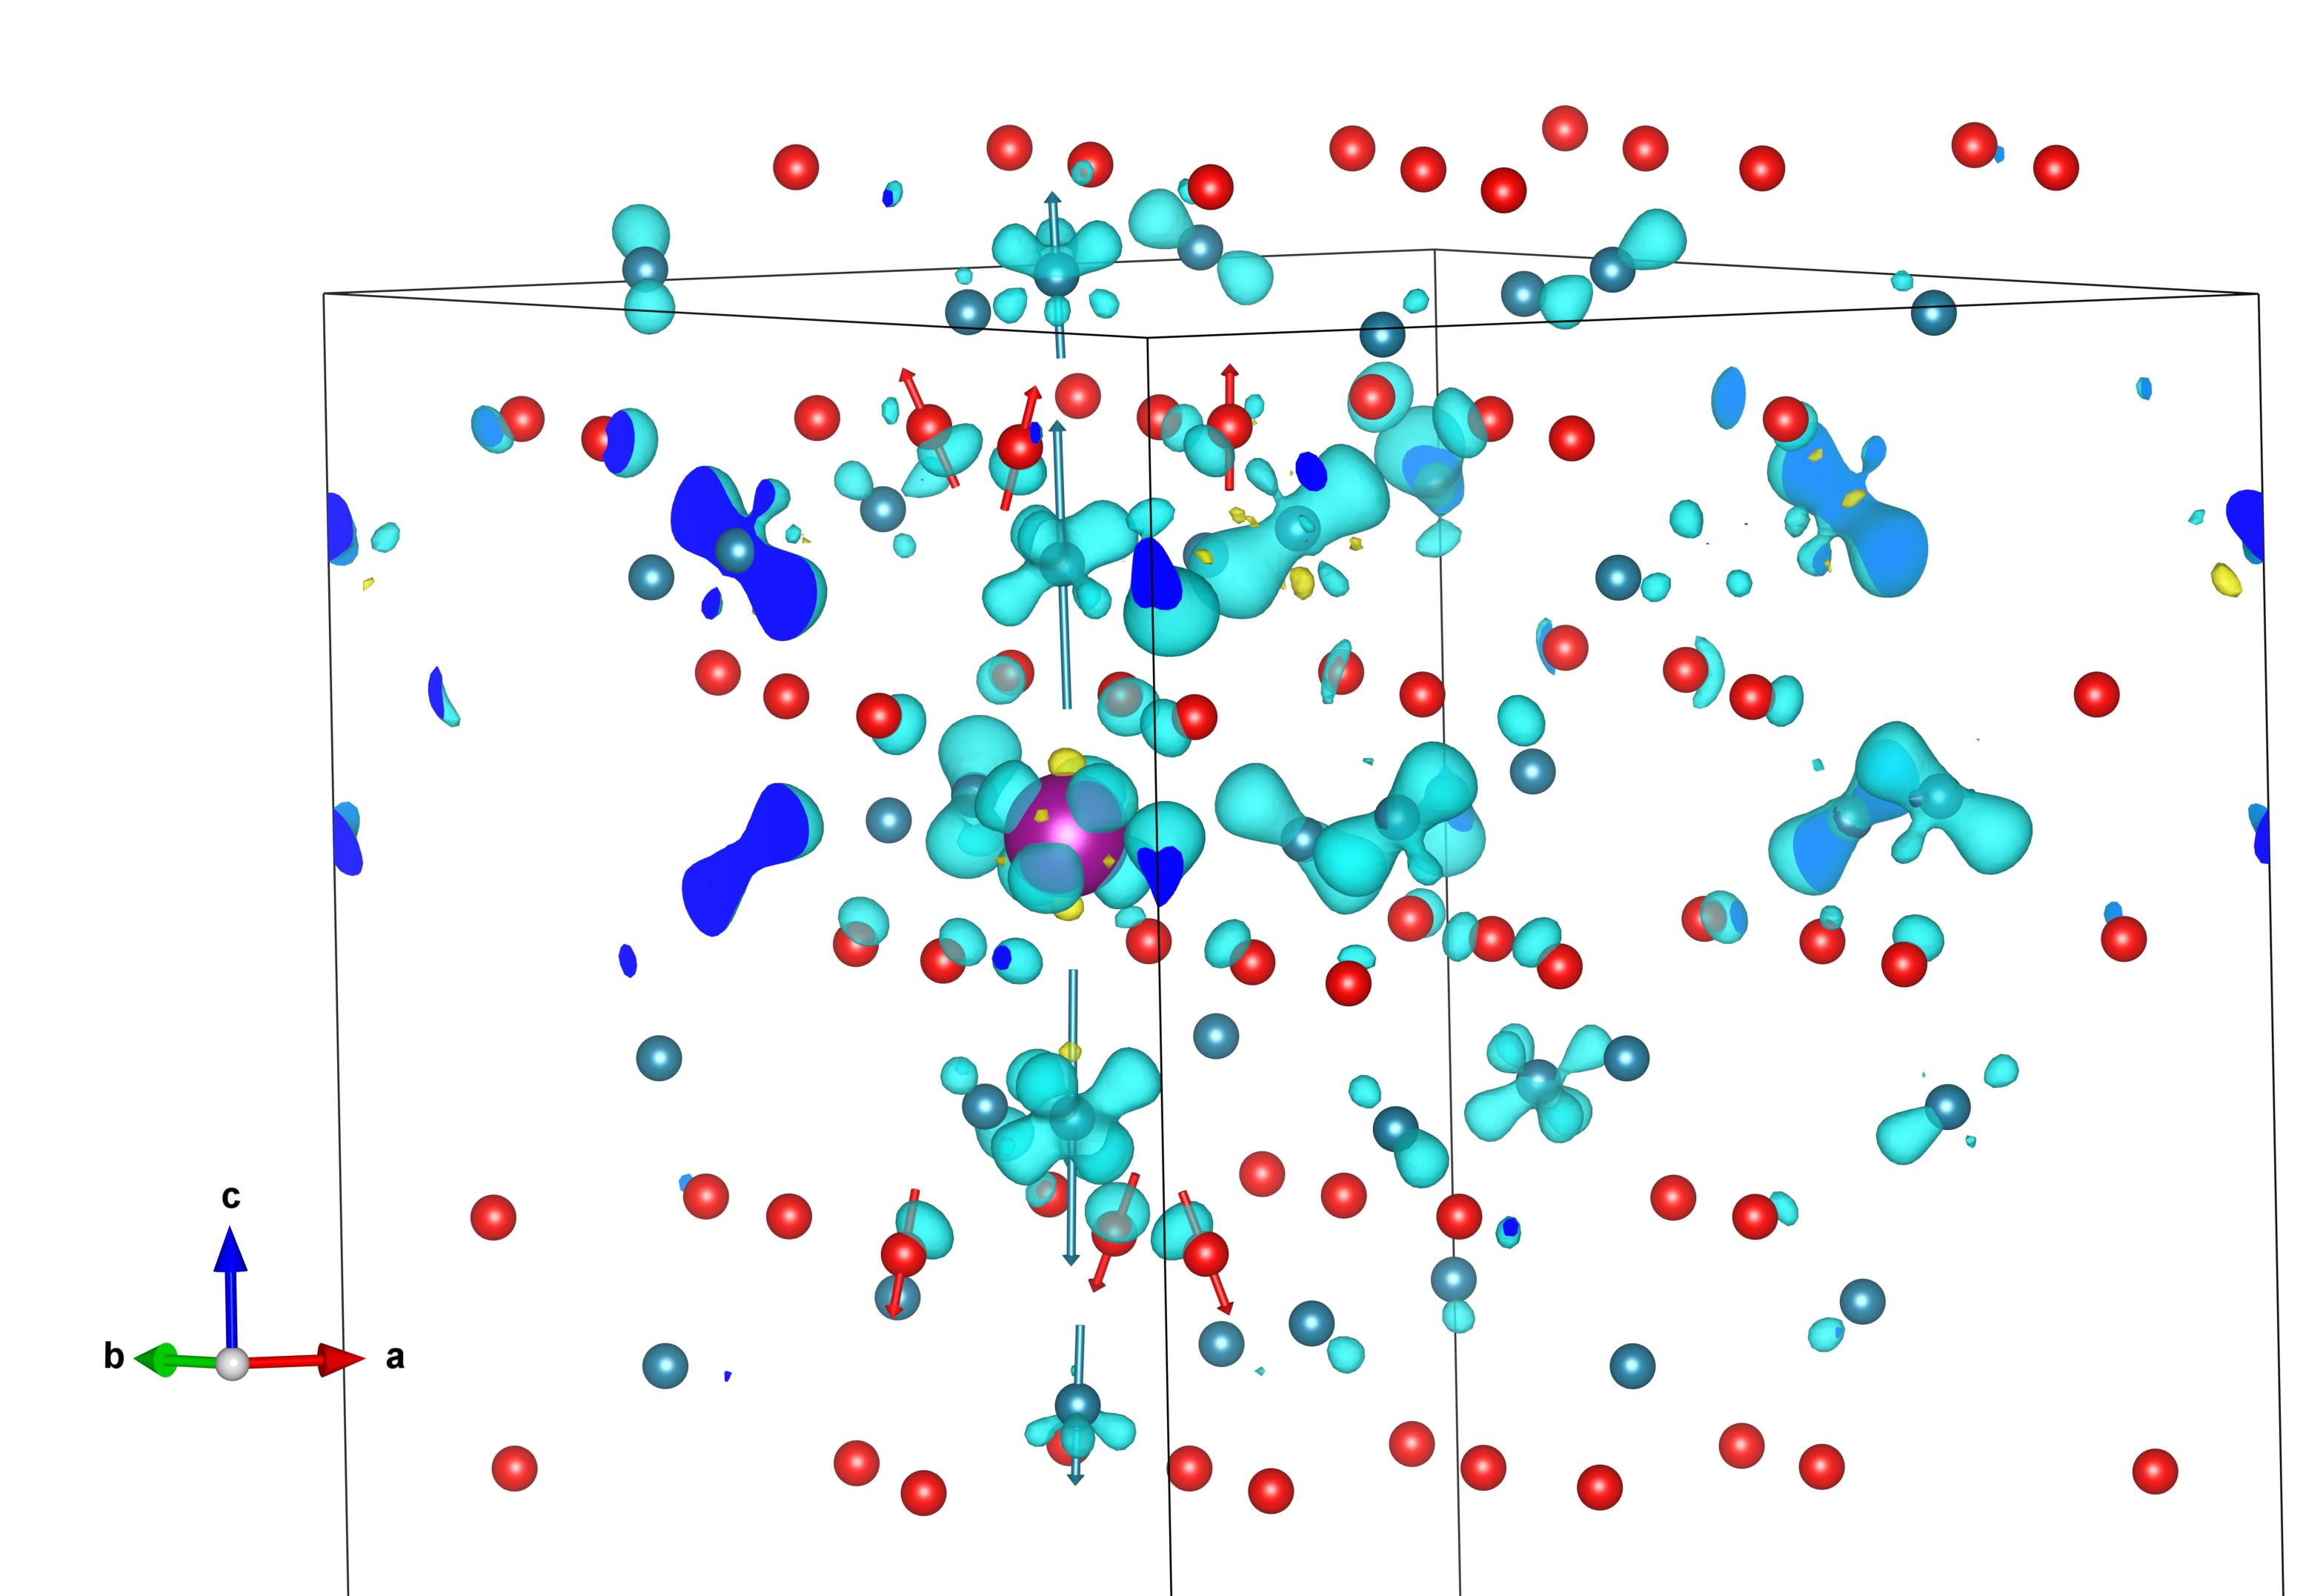
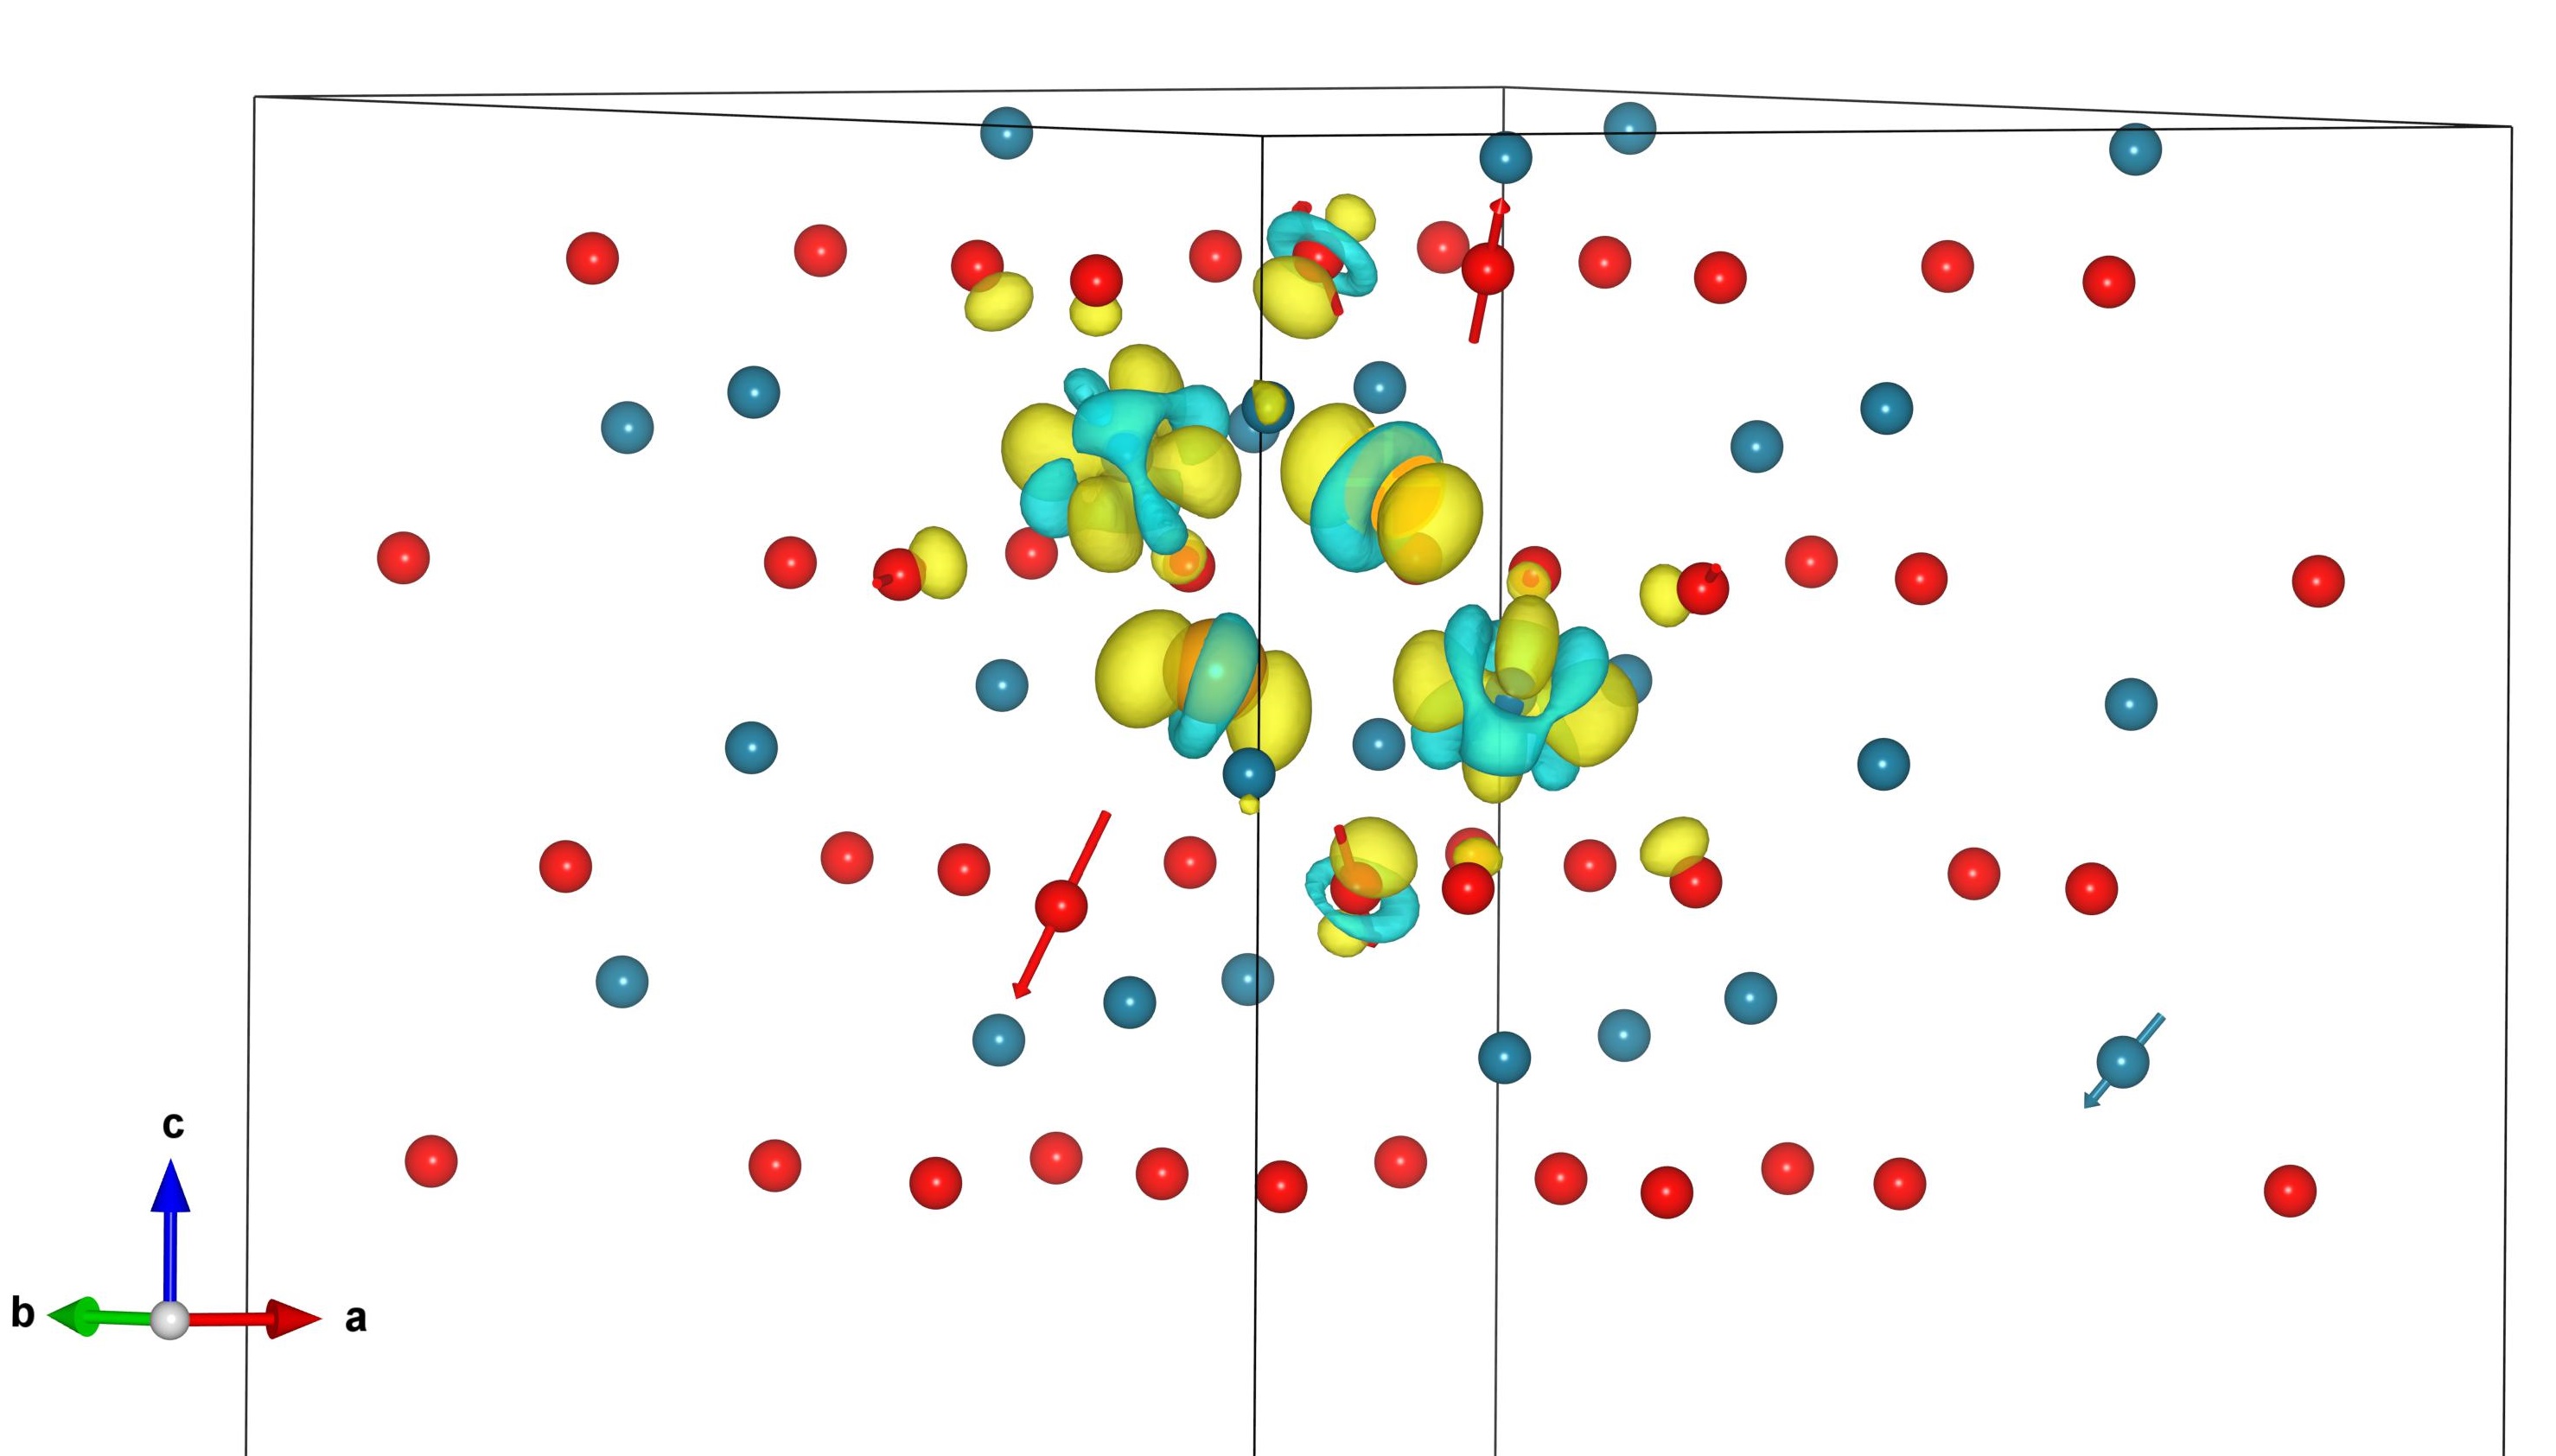
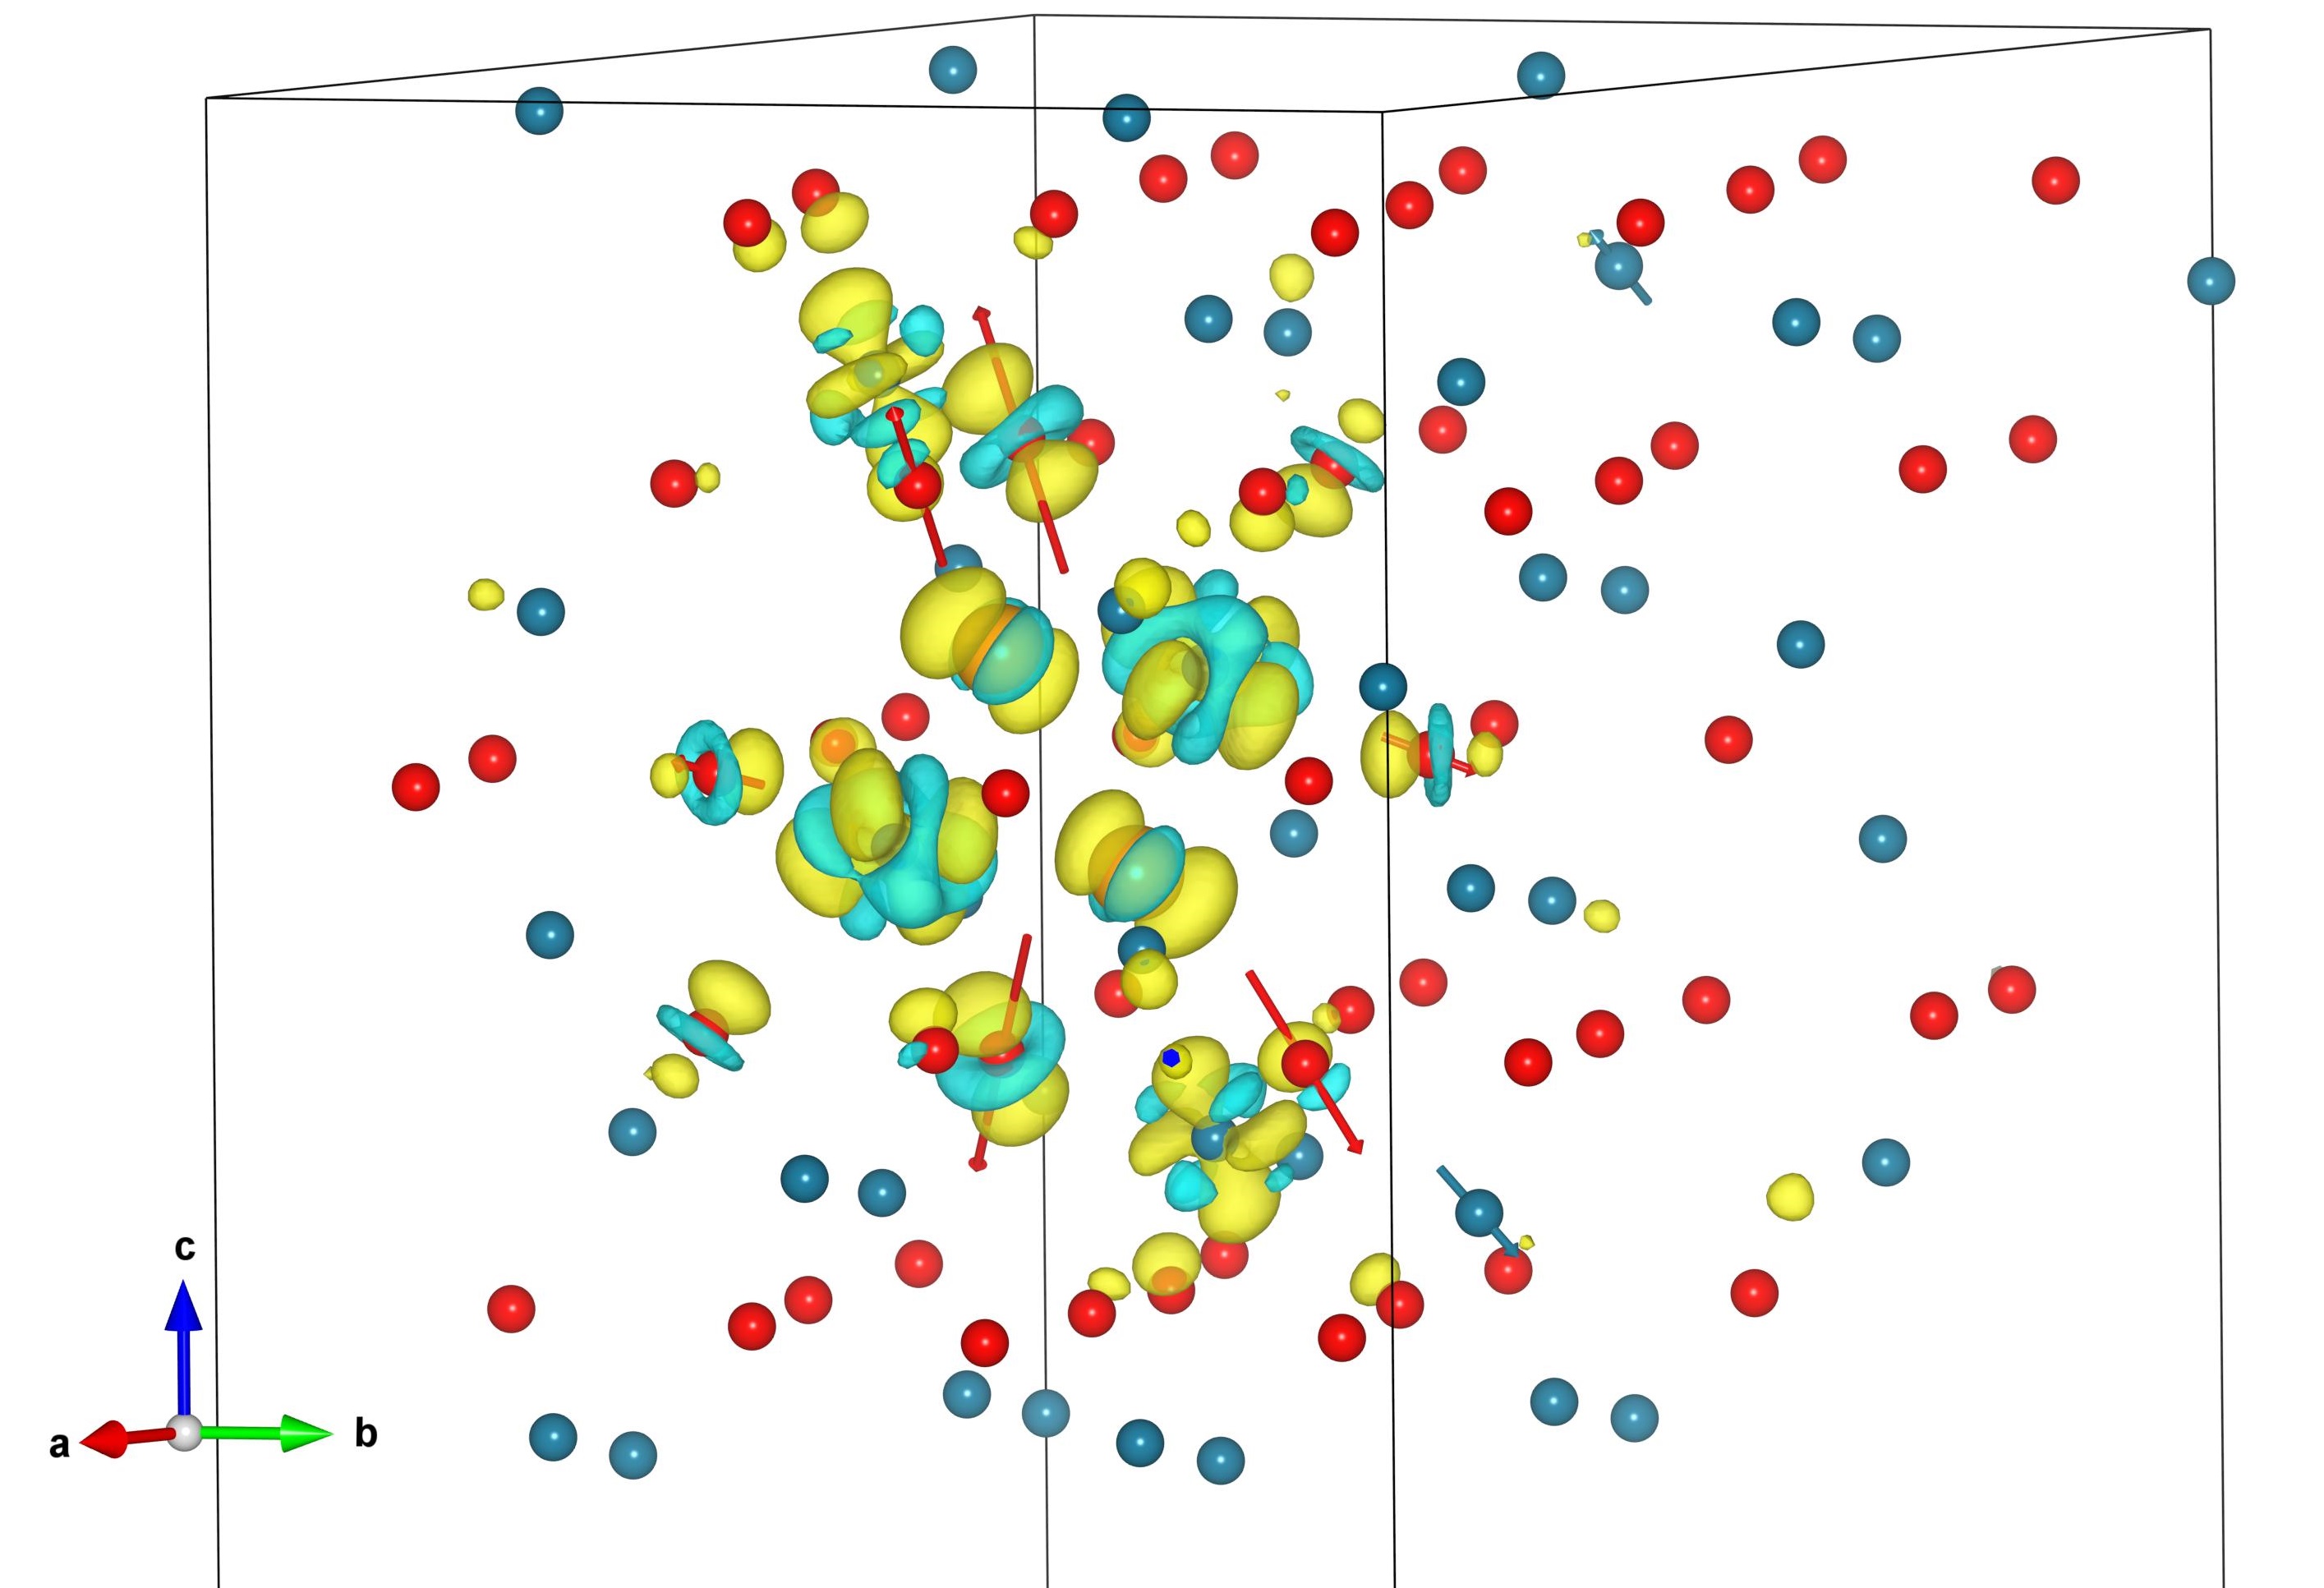
The relaxed interstitial structures shown in Figure 2 indicate that Cr interstitials occupy the unoccupied octahedral sites in the Cr bilayer coordinated by the O sublattice. In contrast, the O interstitials shown in Figure 3 relax to a dumbbell configuration with each of the O ion in the dumbbell lobes residing at the unoccupied octahedral sites.
The effect of interstitial charge on the displacement of the lattice ions around the interstitial is shown by the ion displacement vectors in Figures 2 and 3 and the magnitudes of ionic displacements are summarized in Tables S1 and S2 in SI for Cr and O interstitials, respectively. The relaxation of the ions surrounding the interstitials was found to be anisotropic. The nearest Cr ions to a Cr interstitial shift away from the interstitial with the maximum displacement at 0.3 Å. The amount of displacement was found to be dependent on the interstitial charge and the distance of the ions from the interstitial. In particular, the nearest O ions have an outward displacement of up to 0.22 Å except in the case of , where the nearest O ions move towards the Cr interstitial by 0.12 – 0.15Å. For neutral O interstitials, only two Cr ions that are at 1.9 Å distance move away from the interstitial. For charged O interstitials, O ions at 2.7 and 2.9 Å distance are displaced by 0.36 Å and 0.23 Å respectively for -2 charge, and undergo even less shifting for q . The relatively small magnitude of displacements and the small number of ions with any noticeable displacement indicate that interstitials do not introduce any significant local distortion in the lattice of \ceCr2O3.
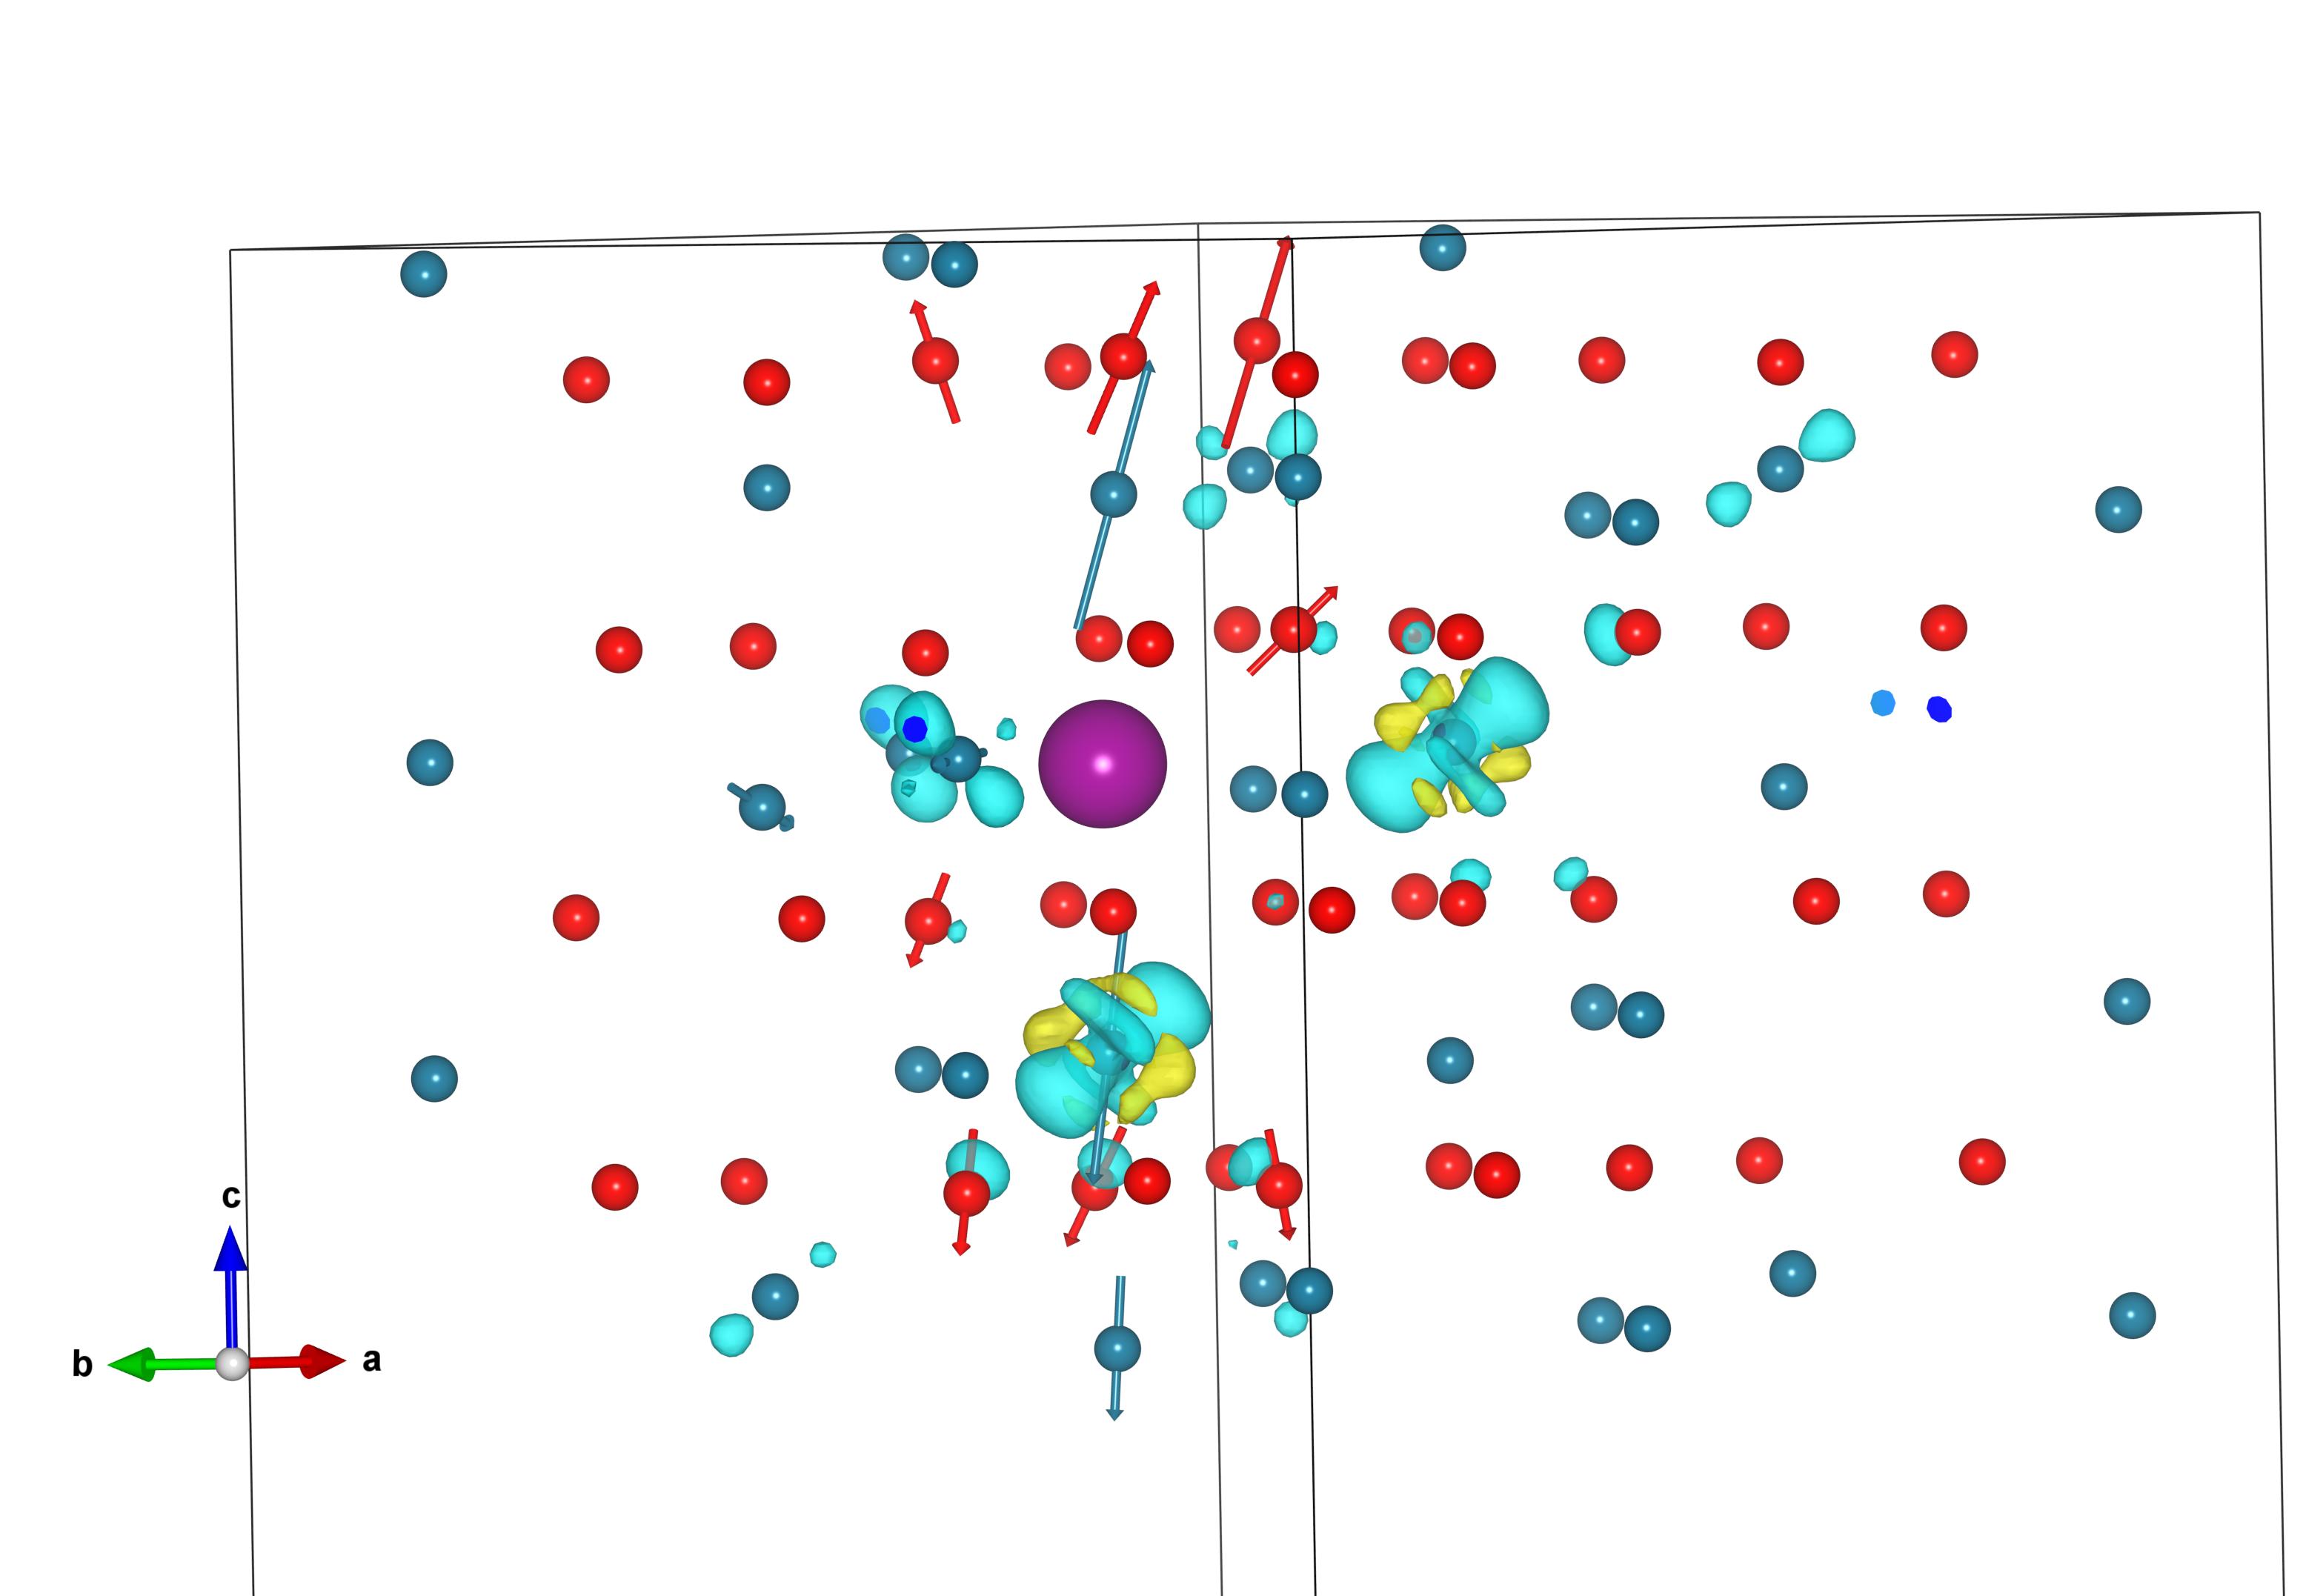
To evaluate the localization of holes in charged and electrons in charged , the difference between charge distribution in a charged interstitial and the charge distribution of the corresponding neutral interstitial with identical structure is plotted in Figures 2 and 3. In some of the previous studies of defects in oxides with excess holes, a non-zero Hubbard correction in the range of 4.0 5.5 eV was applied for O-2p orbitals to properly account for the hole charge distribution[38, 39, 40]. However, in undoped \ceCr2O3, applying , did not produce any noticeable difference in the hole charge distribution (see Figure S2 in SI). For , the hole charge shown in Figure 2(b) is mainly localized on two lattice Cr ions closest to the interstitials located at a distance of 2.45 Å along the c-axis and 2.99 Å in the basal plane from the interstitial. The major portion of the remaining hole charge is localized on two Cr ions in the basal plane at a distance of 2.94 Å from the interstitial. In the case of , the majority of the 2-hole charge is localized on the Cr interstitial itself. Some of the hole charge is distributed on the two nearest Cr ions along the c-axis at 2.4 Å, two Cr ions in the basal plane at 2.94 Å and two Cr ions at 3.8 Å along the [221] direction. For , the 3-hole charge

The charge distribution plots of excess holes indicate that the holes are neither completely localized on individual ions nor completely delocalized. This result is consistent with the predictions of Lany [41] and Kehoe et al [39]. According to Lany, the non-bonding Cr-3d orbitals at the top of the valence band are responsible for the delocalized nature of the holes. The holes in \ceCr2O3 are predicted to be band conducting with heavy effective mass [41].
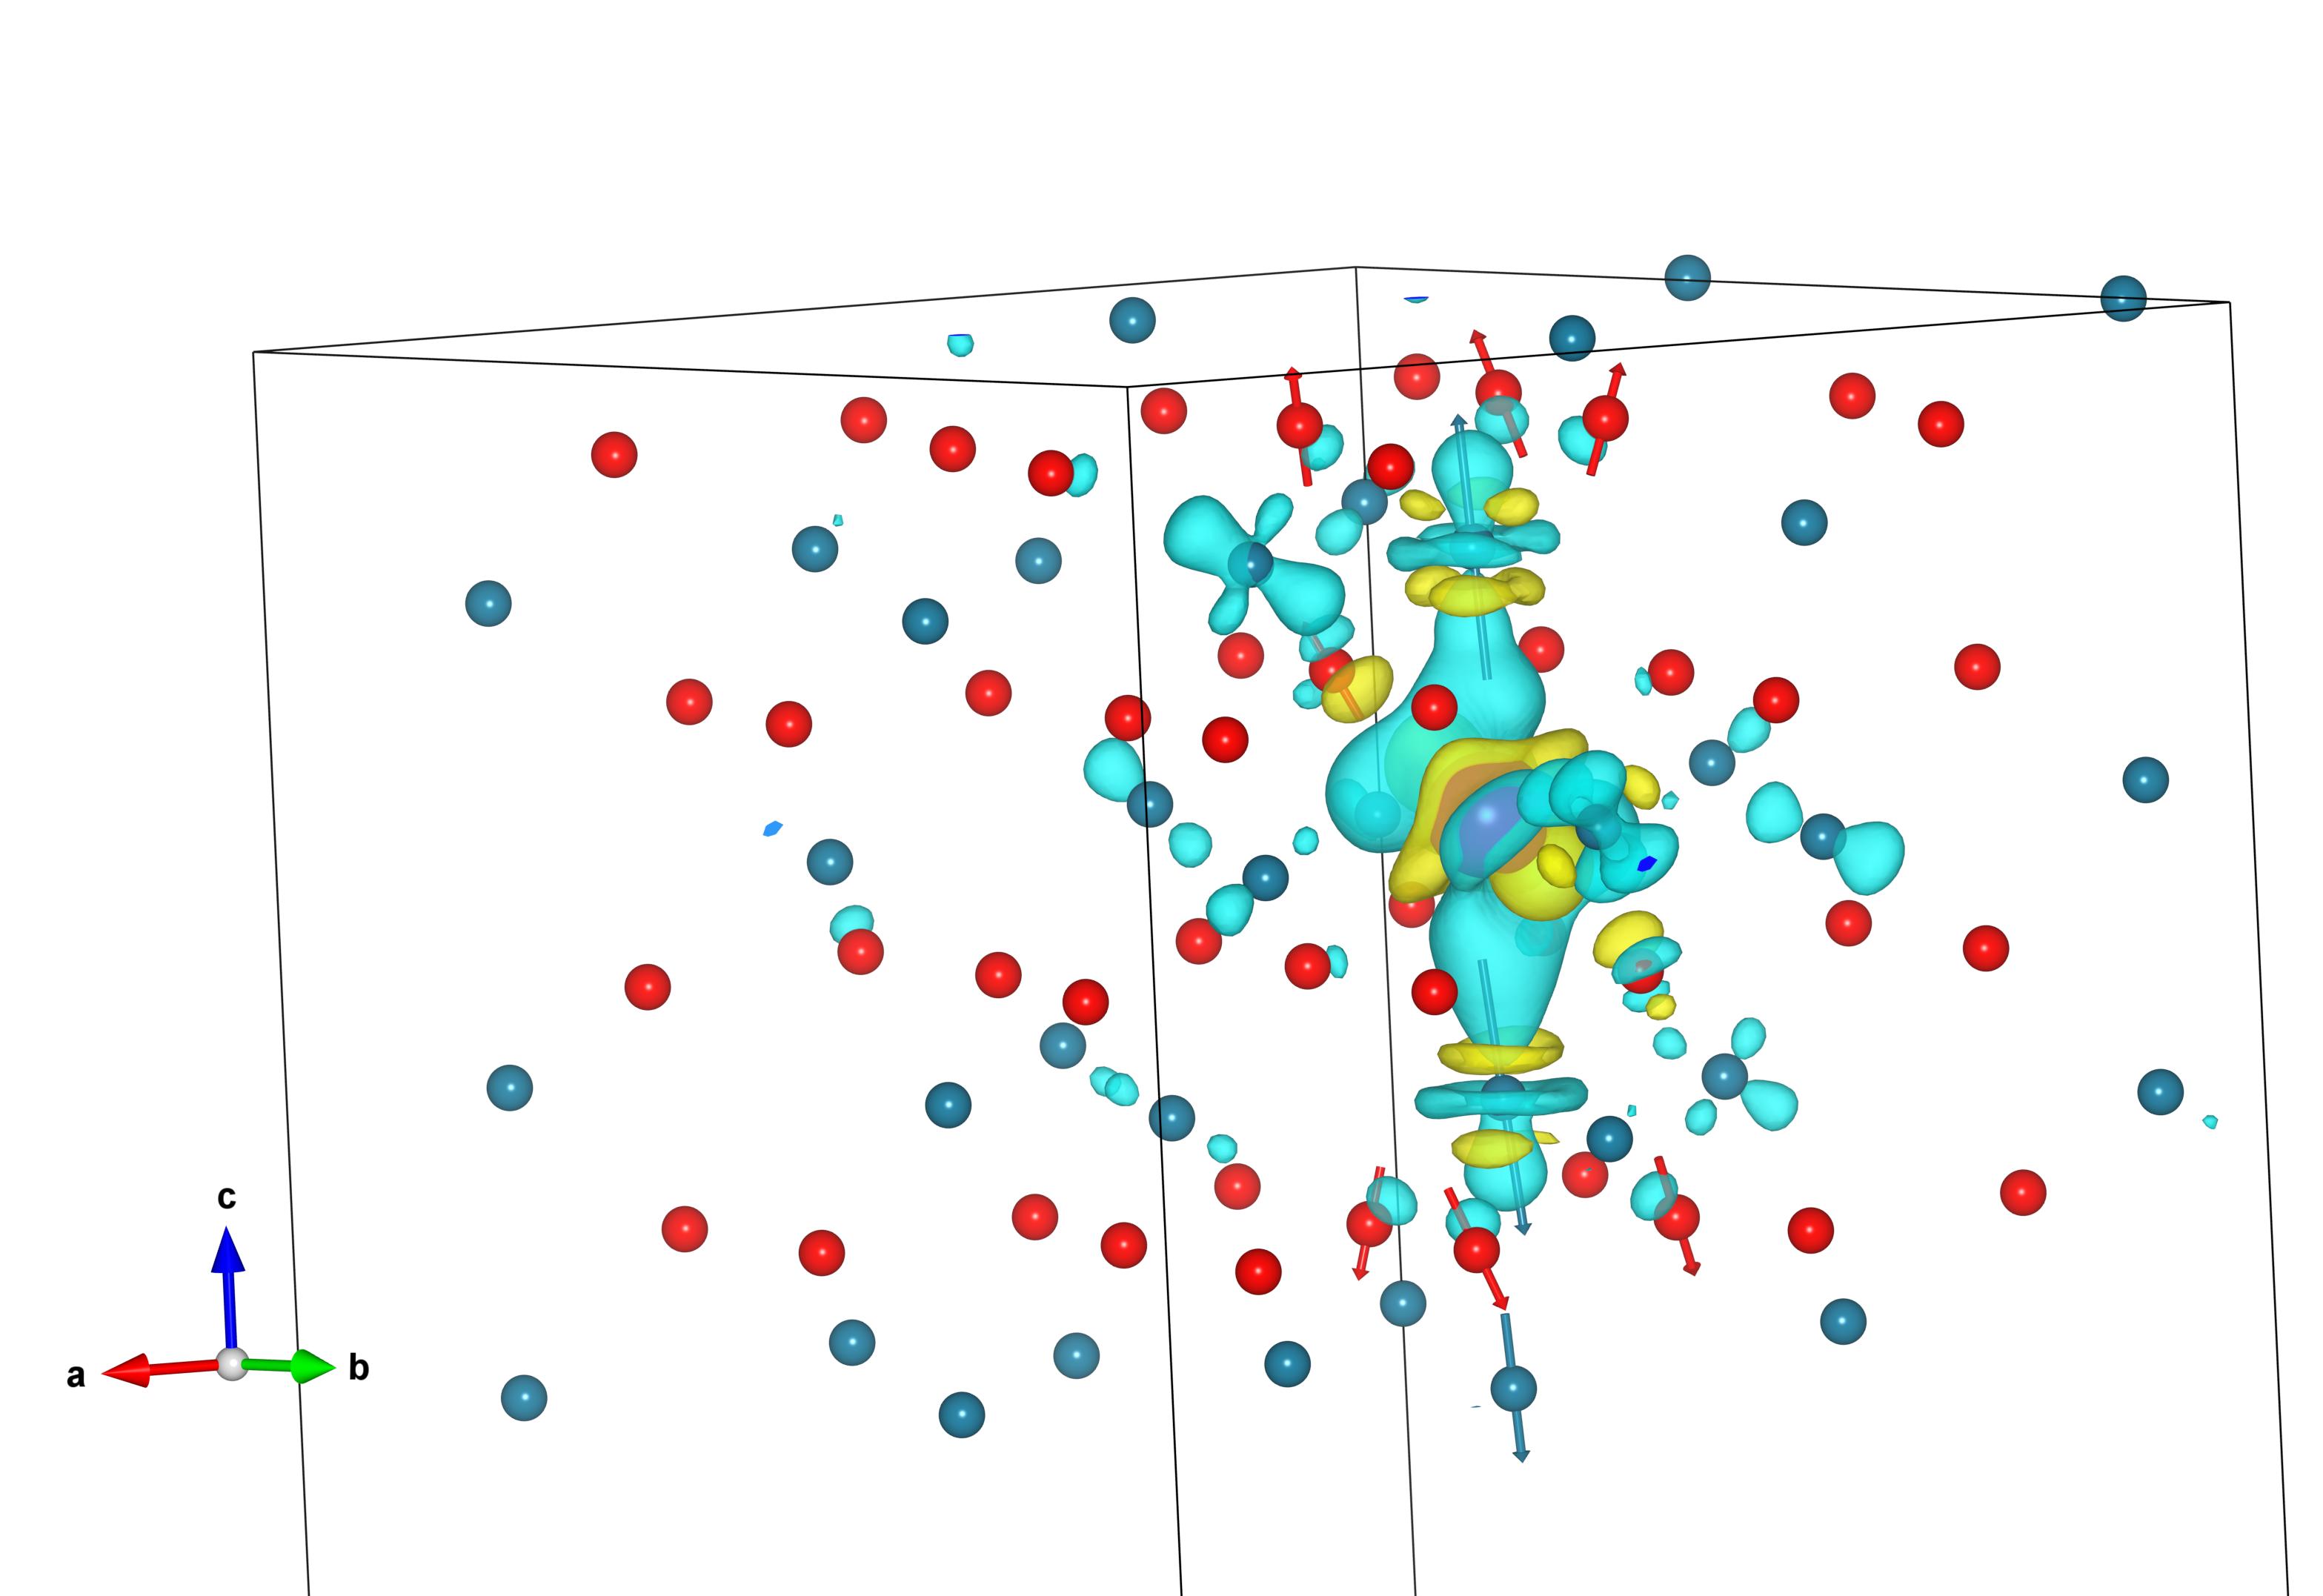
The excess electron density of is localized mainly on the O ions forming the lobes of a dumbbell interstitial and the two nearest Cr ions. For , the excess 2-electron charge is also distributed over the adjacent Cr and the O ions in the basal planes that are at 2.4 2.5 Å distance from either of the interstitial O ions.
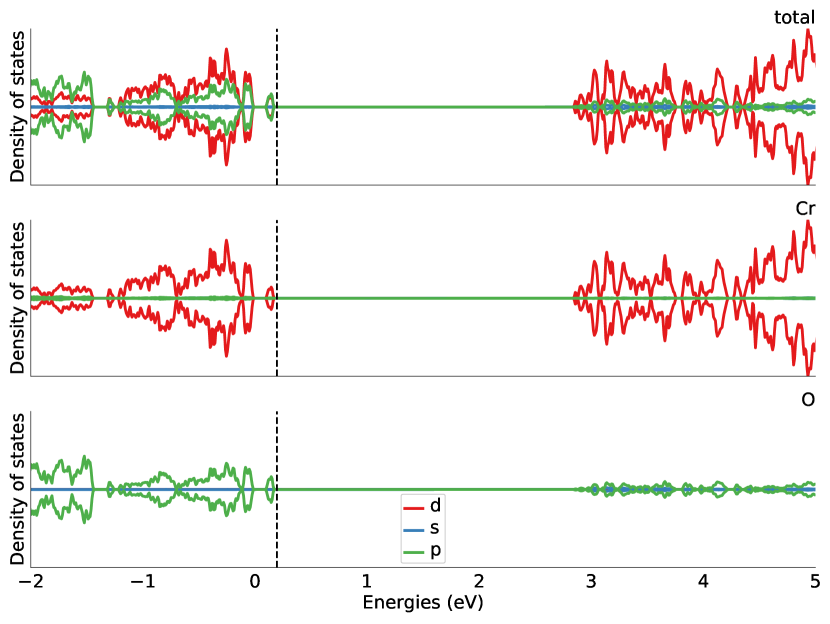
The electronic density of states (DOS) plots of the optimized Cr and O interstitial structures are presented in Figures 4 and 5, respectively. The computed bandgap in these figures is 2.8 eV [18]. The plots reveal that the energy states corresponding to both Cr and O interstitials are located in the bandgap, and are of hybrid O- and Cr- character, which is similar to the nature of the vacancy states [18]. The defect levels of the neutral Cr interstitial, which are located in both the lower and upper parts of the bandgap, are occupied with electrons and the Fermi level is closer to the conduction band. For positively charged Cr interstitials, the unoccupied defect levels are shifted up on the energy scale. The upward shift of the empty interstitial levels increases with the charge of Cr interstitial. This effect can be attributed to the reduction in their screening due to the loss of electrons. For , the majority of the defect levels are empty and are shifted closer of the conduction band.
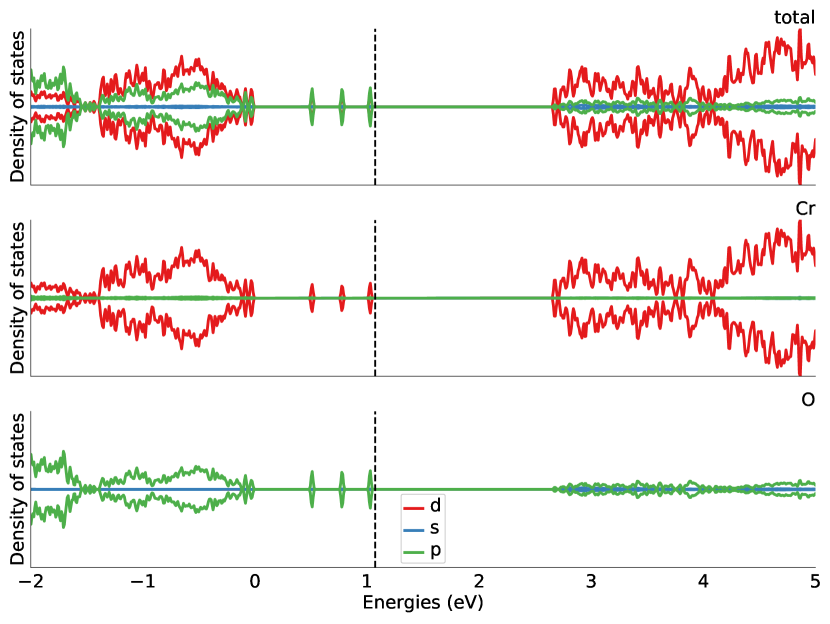
The DOS plots of indicate that occupied levels are located at the bottom of the bandgap region near the valence band maximum (VBM) (Figure 5). The unoccupied levels are in resonance with the conduction band. When the interstitial charge is increased negatively, the interstitial gains electrons and the newly occupied defect levels shift down towards the center of the bandgap. For , the occupied defect levels reside in the lower half of the bandgap. Interestingly, the highest occupied level of is higher than that of the and is characterized by spin splitting of the defect levels. Such relative position of defect levels can be attributed to the relatively lower screening experienced by highest occupied defect level in compared to that of .
| Defect | q | Interstitial Formation Energy | |||||
|---|---|---|---|---|---|---|---|
| () | VBM+0.1 eV | CBM-0.1 eV | VBM+/2 | ||||
| Cr rich | O rich | Cr rich | O rich | Cr rich | O rich | ||
| 0 | 5.57 | 2.18 | 5.57 | 2.18 | 5.57 | 2.18 | |
| -1 | 8.69 | 5.29 | 5.49 | 2.09 | 7.09 | 3.69 | |
| -2 | 10.98 | 7.58 | 4.58 | 1.18 | 7.78 | 4.38 | |
| 0 | 7.51 | 10.13 | 7.51 | 10.13 | 7.51 | 10.13 | |
| 1 | 4.60 | 7.21 | 7.80 | 10.42 | 6.20 | 8.82 | |
| 2 | 2.09 | 4.71 | 8.49 | 11.11 | 5.29 | 7.91 | |
| 3 | 0.55 | 3.17 | 10.15 | 12.77 | 5.35 | 7.97 | |
The interstitial formation energies were corrected for electrostatic interactions between periodic images of charged simulation cells and for the under-predicted DFT bandgap. Electrostatic corrections were obtained using anisotropic FNV (Freysoldt, Neugebauer, and Vande Walle) method [42, 43] (see Table S3 in SI for details). The transition levels of Cr and O interstitials with respect to the VBM were corrected for the DFT bandgap error using the scheme proposed by Janotti and Vande Walle[44]. The resulting corrections to the transition levels and the associated corrections to the interstitial formation energies are summarized in SI Tables S4 and S5, respectively. The resultant formation energies were plotted with respect to the position of the Fermi level in Figure 6 for both O-rich and Cr-rich conditions. These conditions were defined by the upper and lower limits of Cr and O chemical potentials determined in our previous study [18]. Here, we focused on the 0 K DFT computed phase stability, and the investigation of the effect of and temperature on interstitial formation energies is deferred to a future study.
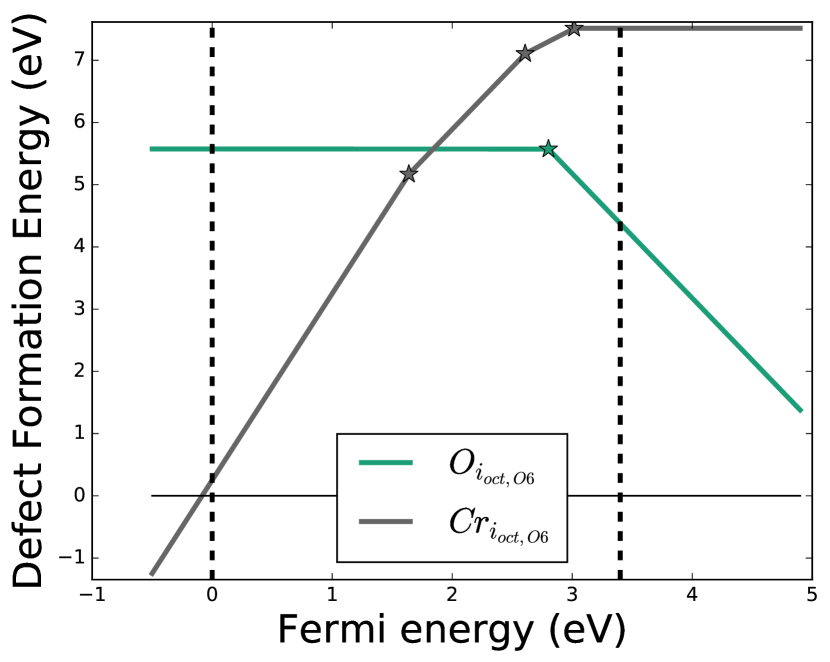
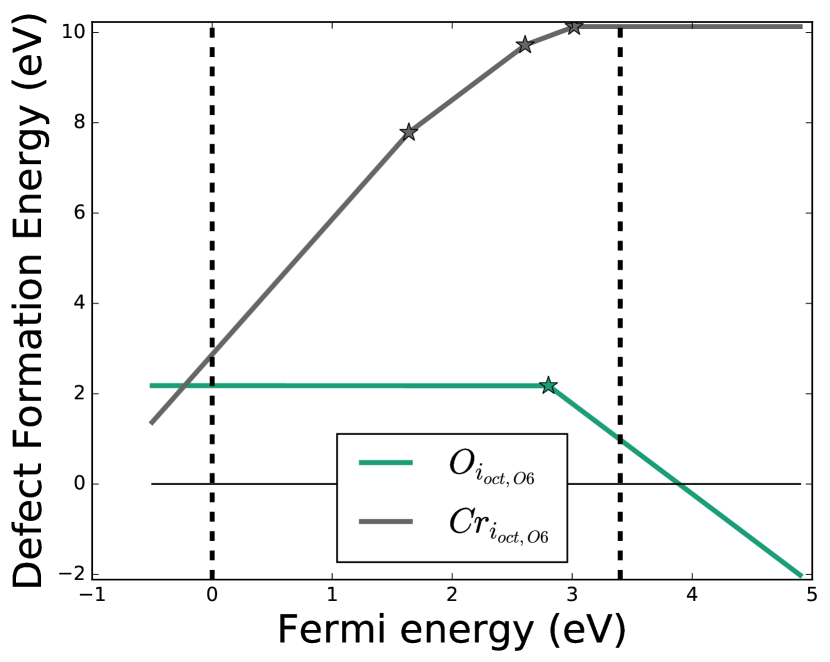
The formation energies reveal that for Cr-rich and p-type conditions, as the Fermi level is in the lower half of the bandgap, Cr interstitials are energetically more favorable compared to O interstitials. Under n-doped conditions, corresponding to the Fermi level being in the upper half of bandgap, O interstitials become the dominant interstitial defects even in Cr rich conditions (Figure 6). However, under n-doped, Cr-rich conditions, both and have lower formation energies than interstitials. For O rich conditions, O interstitials are energetically more favorable over Cr interstitials under all doping conditions. The transition levels of both Cr and O interstitials, which are denoted as stars in the Figure 6 (see also the last column of SI Table S4), are deep in the bandgap. While the +3/+2 transition level is very deep and 1.64 eV above VBM, the other transition levels are relatively shallow and are less then 0.6 eV below the conduction band minimum (CBM). The predicted transition levels for O interstitials (last column of SI Table S4) indicate that either of neutral or -2 charge states has lower formation energy when compared to -1 charge state at any Fermi level in the bandgap. The phonon DOS plot in SI Figure S4 (a) shows that is a stable defect with no soft modes. This suggests that the concentration of would be relatively insignificant under any physical condition.
Our grand canonical calculations of defect chemistry at finite temperatures (Figure S3 and S4 in SI) indicate that undoped \ceCr2O3 is a stable semiconductor with the Fermi level located in the center region of the band gap. Our calculations predict that at high temperatures ( 800 K), intrinsic \ceCr2O3 is weakly n-type and at low (300 400 K) and intermediate (400 800 K) temperatures, intrinsic \ceCr2O3 is slightly p-type. When \ceCr2O3 acts as a protecting layer on a metal substrate, the metal-oxide boundary has effectively very low . At low , the formation energies of and at eV, are equal to 2.6 eV and 4.0 eV respectively [18], and are lower than those of and , which are equal to 5.3 and 5.6 eV, respectively. This indicates that at low , could be the dominant defect in undoped \ceCr2O3 followed by . This contradicts the conclusions from some of the experimental studies on self-diffusion in \ceCr2O3 [14, 15], where and were suggested as the dominant defects in \ceCr2O3 at very low . It is noteworthy, that \ceCr2O3 passivation films on Ni alloy substrate could be p-type doped due to trace amounts of Ni substitution [40]. For Ni doping, Fermi level in \ceCr2O3 stabilizes at 0.4 eV above VBM [40]. Under such conditions, defects have lower formation energy compared to and both and have formation energies approximately equal to 1.5 eV, making and the dominant defects. Similarly, bulk \ceCr2O3 samples can be strongly p-type doped with close to VBM, when divalent ions such as Mg are present as impurities [40]. Under such conditions, our calculations suggest that could be the dominant defect in bulk \ceCr2O3 in place of . Based on these results, the \ceCr2O3 samples used Ref.14 and 15 could be inadvertently p-type doped due to trace impurities. Furthermore, the presence of either an additional spinel layer or hydrogenated water opposite to the metal-oxide side could result in reducing conditions for the entire \ceCr2O3 layer in the PWR environments. In such conditions, the dominant defects could be either Cr interstitials or Cr vacancies depending on the Fermi level.
With vacancies included, under heavily oxidizing conditions, and are the dominant defects. When the Fermi level is above 2.2 eV, \ceCr2O3 is unstable against [18] indicating that compensating Cr vacancies will form if \ceCr2O3 is heavily doped with electron donating species. Under p-doped conditions, and both have formation energies of 2.0 eV, indicating that both defects have near equal concentrations. For both defects, neutral charge state is the dominant charge state under p-doped conditions.
3.3 Interstitial Diffusion
3.3.1 Cr diffusion
We have studied the diffusion of Cr and O interstitials in charge states ranging from [0, 3] and [-2, 0], respectively. The preferential diffusion pathways for both Cr and O interstitials are identified to be either in the basal plane or along the diagonal of the standard corundum lattice.
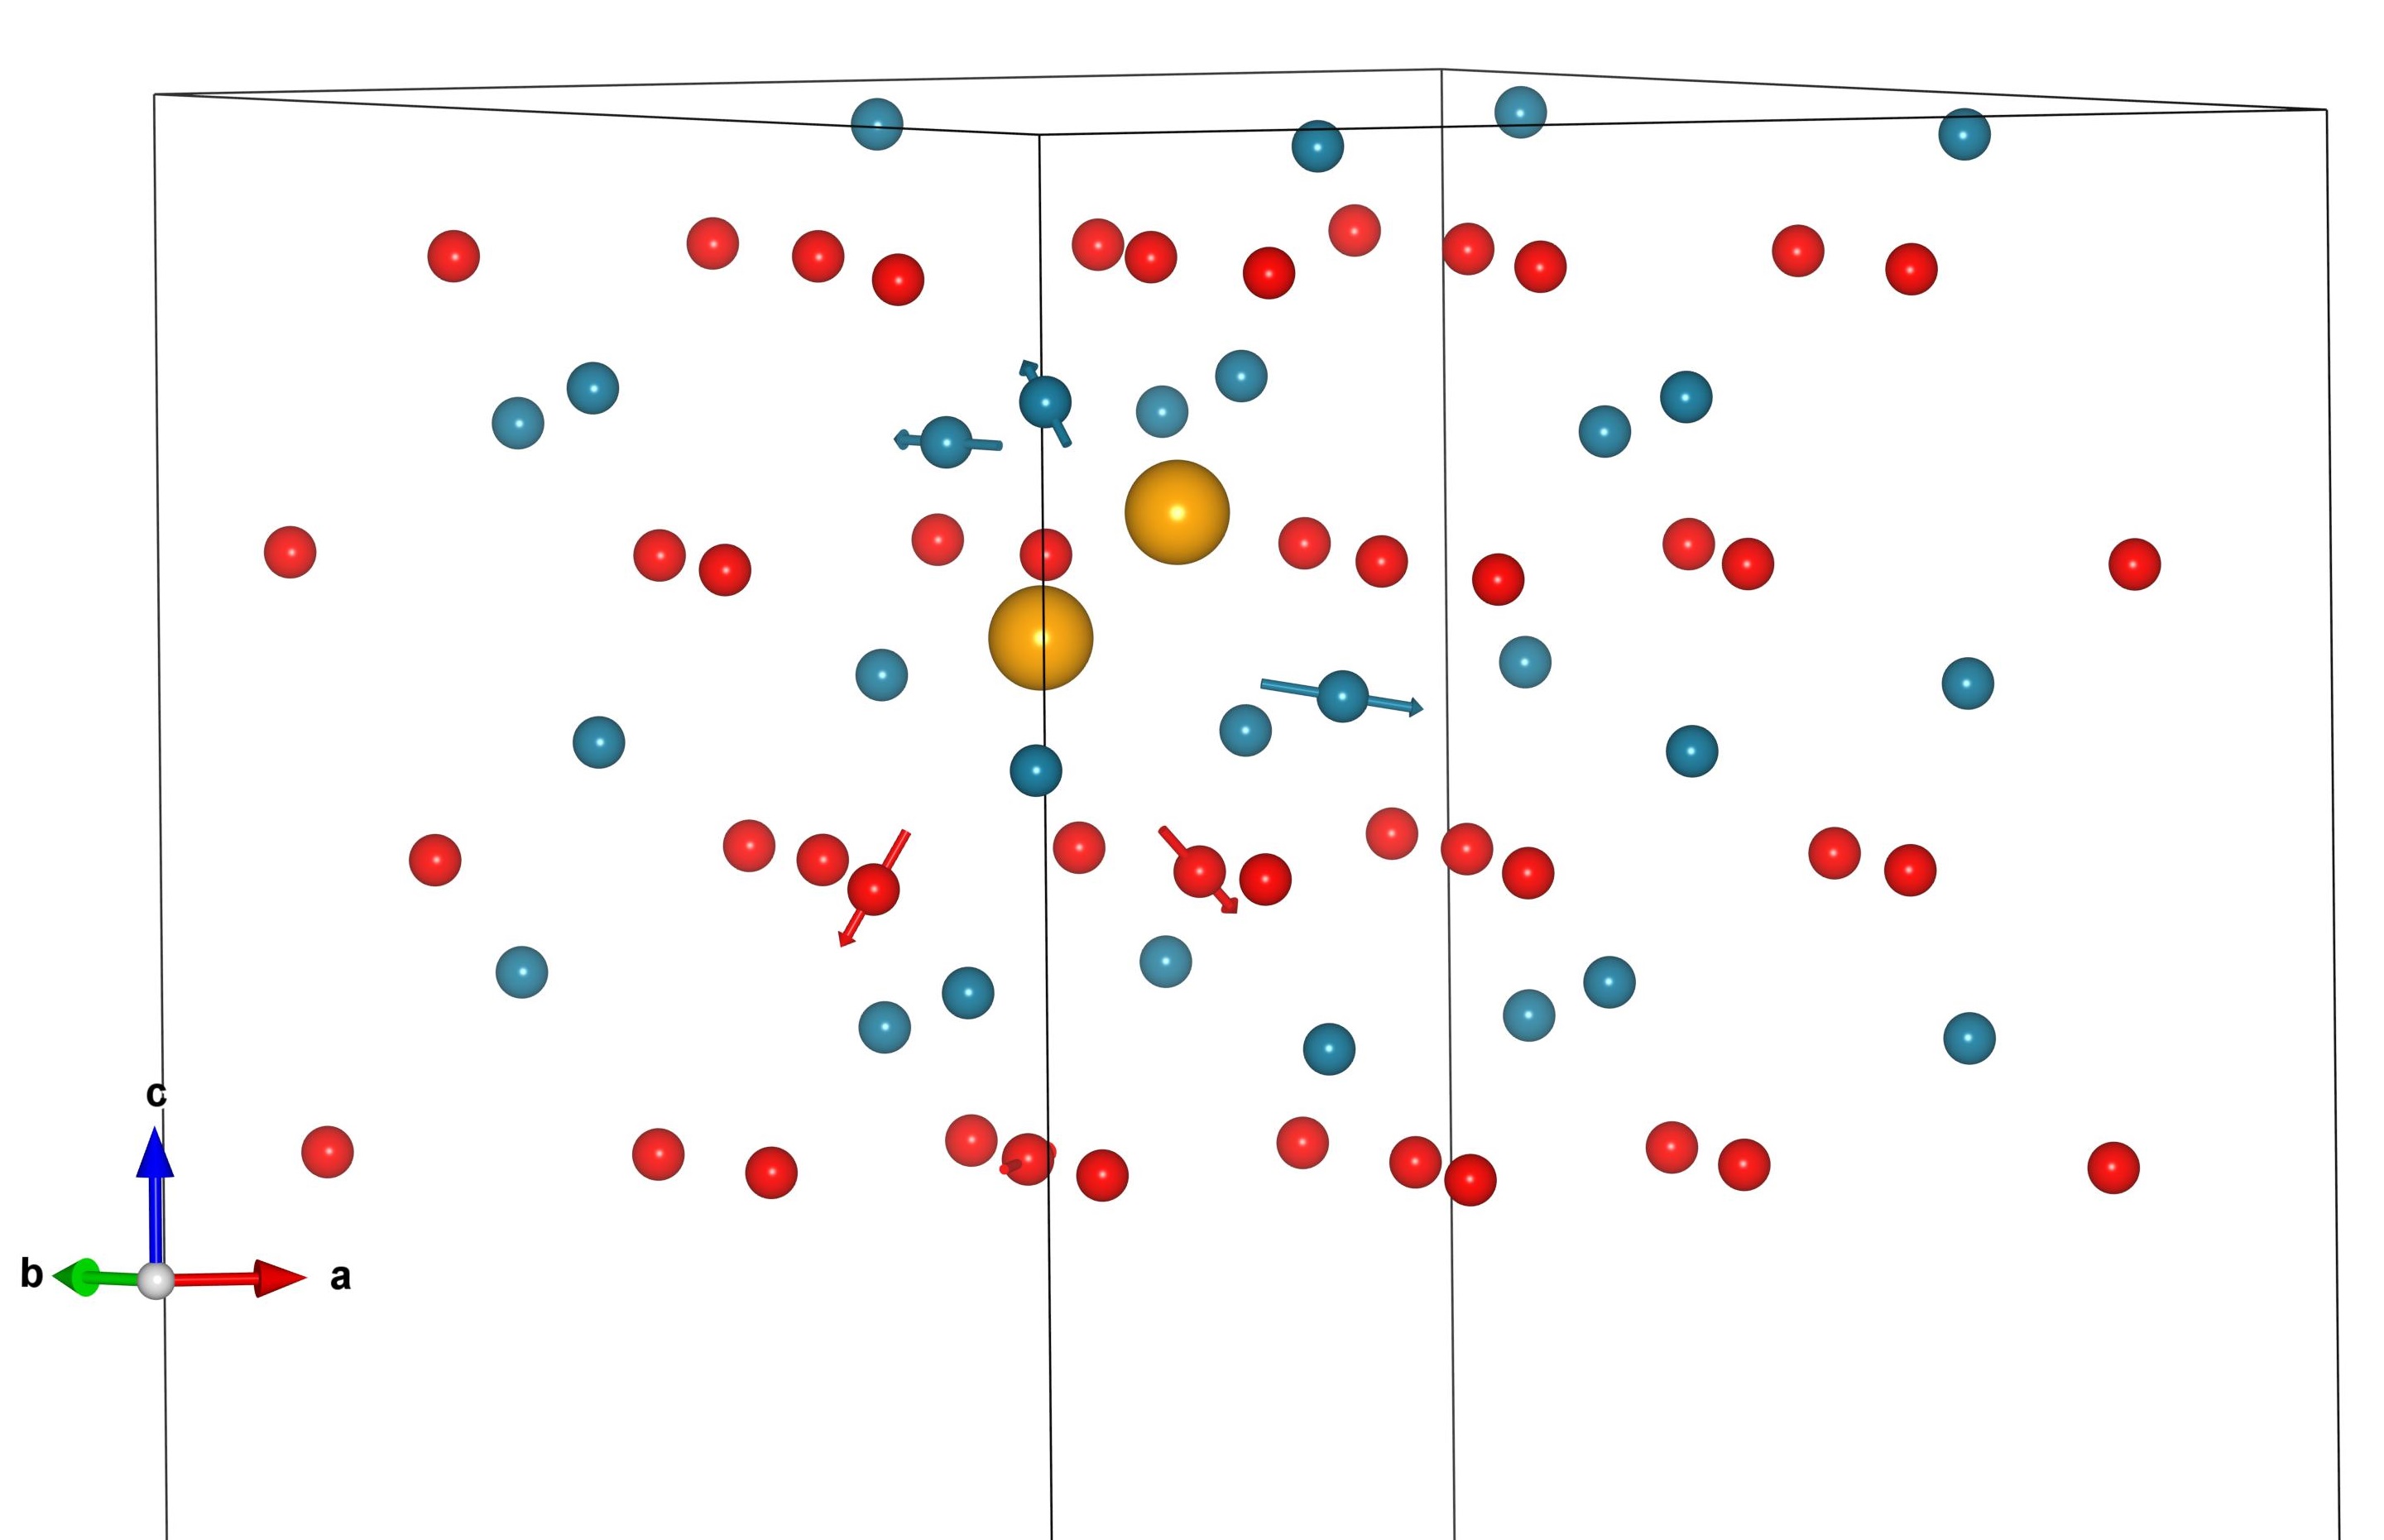
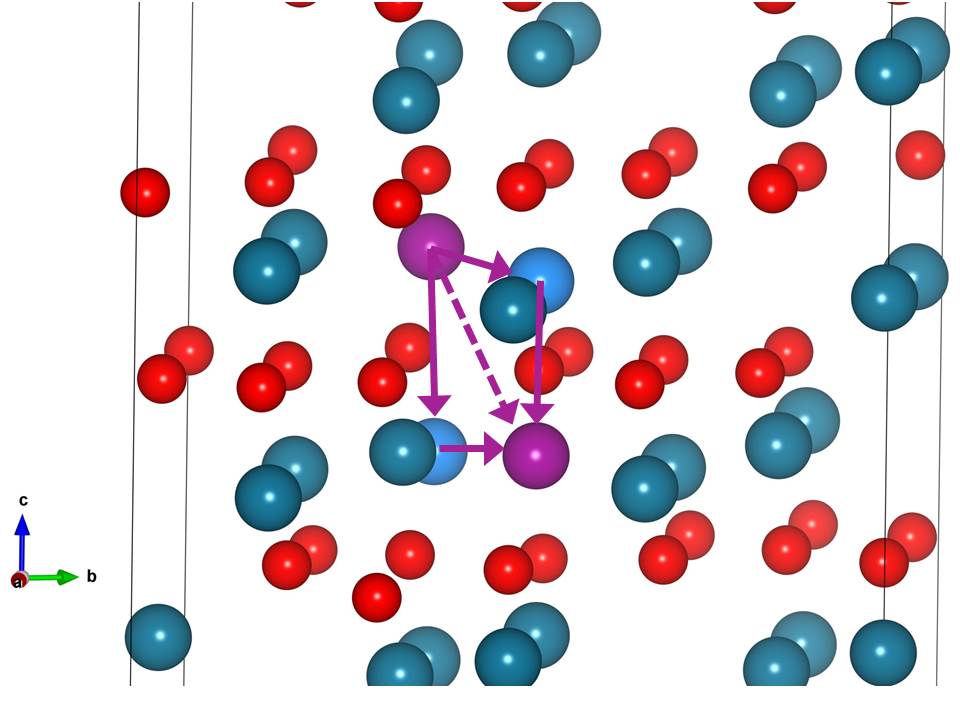
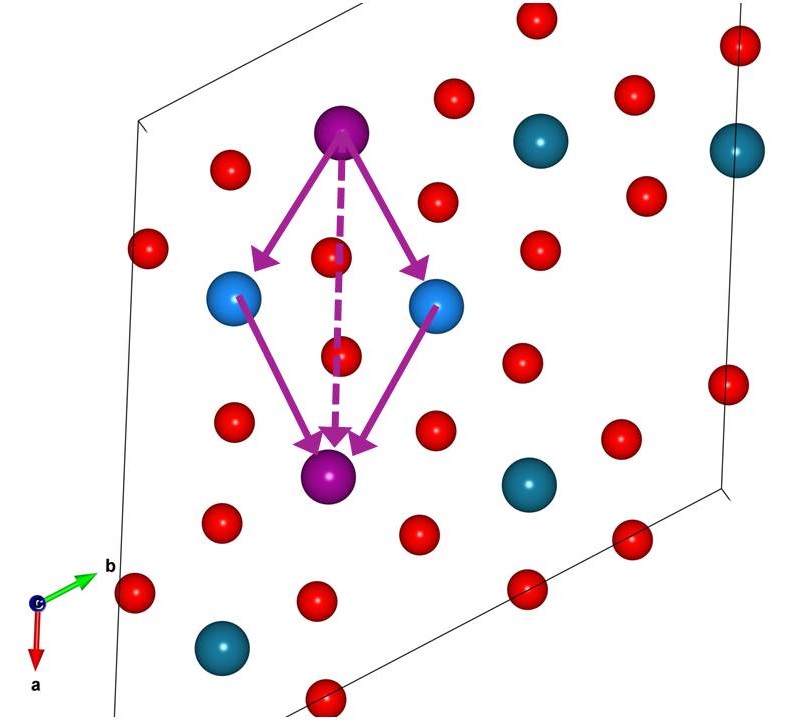
Figure 7 illustrates the Cr diffusion pathways studied. In this figure the magenta spheres represent the initial and final Cr interstitial sites and the blue spheres represent Cr ions affected by interstitial diffusion process. Interstitial diffusion typically involves two mechanisms: direct and interstitialcy diffusion. In the direct mechanism, shown as dotted lines in Figure 7, a Cr ion hops from one interstitial site to an adjacent interstitial site squeezing through the ions in the regular lattice. In the interstitialcy mode, a Cr interstitial knocks off a Cr ion in the regular Cr sublattice (represented by one of the two blue spheres) and occupies that sublattice site. The displaced Cr ion goes to a neighboring unoccupied interstitial site. We investigated both the pathways using CI-NEB method. However, either convergence could not be obtained in CI-NEB calculations, or the resulting barrier energies were very high (greater than 5 eV). This led us to investigate an alternative interstitial diffusion mechanism. In this mechanism, diffusion is accomplished in two stages and involves an intermediary metastable configuration. In the first stage, either one of the Cr ions along the diffusion path (represented by blue spheres) jumps to the final interstitial position. This jump creates a defect complex comprising a Cr Frenkel pair and a Cr interstitial. This defect complex is quite similar to the intermediate triple defect (Cr Frenkel pair + Cr vacancy) involved in vacancy mediated Cr diffusion along c-axis [18]. During the second step, Cr in the initial interstitial site jumps to the vacated Cr lattice site, thereby completing the diffusion process. This mechanism also resulted in lower barrier energies (for example, by 2 eV for along [221]) compared to direct and interstitialcy mechanisms in the few cases where CI-NEB calculations of direct and interstitialcy mechanisms converged implying that it is the true Cr interstitial diffusion mechanism in \ceCr2O3. It may also represent one of the modes of cations interstitial diffusion in other corundum sesquioxides. For both the interstitialcy and the proposed mechanisms, the atoms involved in the diffusion and their initial and final positions are the same. The difference is that in the interstitialcy mechanism both atoms move concurrently, while in the mechanism proposed in this work, they move consecutively.
| Diffusion Path | Length (Å) | Attempt Frequency (THz) | Migration barrier (eV) | |||||||||
|---|---|---|---|---|---|---|---|---|---|---|---|---|
| () | 0 | 1 | 2 | 3 | 0 | 1 | 2 | 3 | 0 | 1 | 2 | 3 |
| [100] | 4.96 | 4.97 | 4.99 | 4.99 | – | – | – | – | 4.04 | 5.53 | 8.21 | 5.2 |
| [221] | 3.81 | 3.81 | 3.74 | 3.74 | 5.39 | 8.71 | 10.23 | 76.89 | 2.26 | 1.86 | 2.62 | 3.69 |
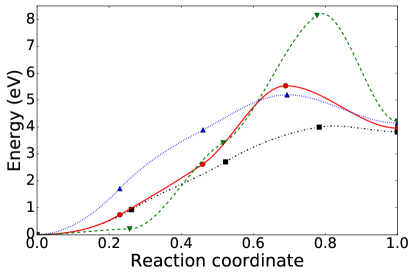
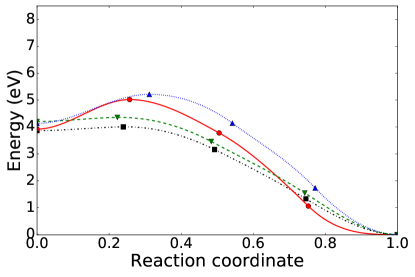
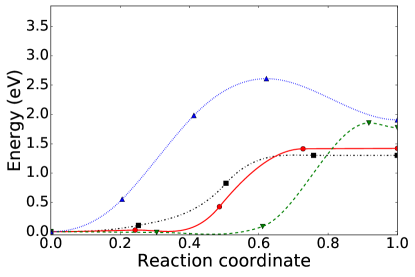
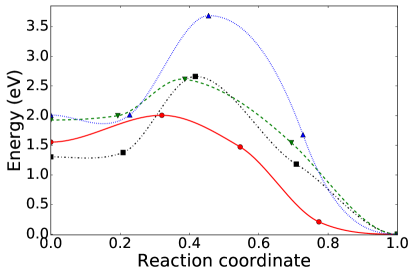
Figure 7(a) shows the diffusion pathway for Cr diffusion along the [221] direction. Diffusion involves either the Cr ion adjacent to the interstitial in the same Cr bilayer or the Cr ion in the next bilayer hopping to the final interstitial site. Depending on the Cr ion involved, elementary diffusion takes place either along the c-axis or along the basal plane, respectively. The subsequent jump by the second ion is then along the basal plane or the c-axis, respectively. Figure 7(b) shows the diffusion pathway for Cr diffusion along basal plane (shown for [100] direction but also applies to [010] direction). In the first stage, one of the six neighboring Cr ions of the occupied interstitial jumps to one of the two available unoccupied interstitial sites. A total of 4 interstitial sites (two along [100] and two along [010]) are available for all the neighboring Cr ions.
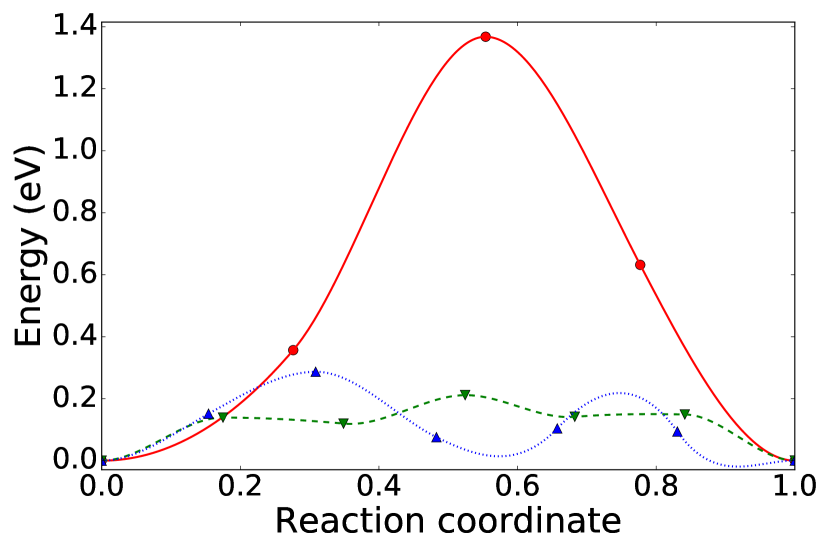
NEB barrier energy plots for Cr diffusion along [100] and [221] directions are shown in Figure 8. The left hand side and right hand side plots correspond to the first and second stages of the Cr interstitial diffusion, respectively. The plots reveal that Cr interstitials preferentially diffuse along the diagonal of the corundum lattice, in contrast to Cr vacancies that diffuse along the basal plane [18].
The calculated barrier energies for Cr diffusion along [100] reveal that diffusion incurs the lowest barrier of 4.04 eV (Figure 8(a) and Table 3) followed by that for , , and . Out of the interstitials studied, , have higher barrier energies for the first stage of [100] diffusion compared to that for the second stage. In contrast, and exhibit nearly equal barrier energies for both stages of diffusion. Assuming the metastable defect complex as reference point, the nearly equal barrier energies imply that either of the Cr interstitials in the initial and final positions can jump to the vacant Cr site with equal probability. However, jumping back of the Cr interstitial in the final position does not result in net diffusion. Hence a prefactor of 0.5 needs to be added to the diffusion coefficient for and .
Simulations of Cr interstitial diffusion along [221] suggest that has the lowest diffusion barrier of 1.86 eV (Figure 8(b) and Table 3) followed by , , and . In contrast to Cr diffusion along [100] direction, [221] diffusion is characterized by relatively higher barrier energies for the second stage of the diffusion when compared to the first stage. However, we believe this difference is solely due to our choice of the ion (from the two ions available) involved in the first stage of the diffusion.
Compared to Cr vacancies, which have the lowest diffusion barrier energies of 2.01 eV ( along basal plane) [18], Cr interstitials have even lower barrier energies of 1.86 eV ( along [221]). The 0.15 eV lower barrier implies that Cr interstitials are more mobile than Cr vacancies by two orders of magnitude at room temperature. At very high temperatures (around 1200 K), the difference in the energy barriers becomes comparable to the thermal energy and both Cr interstitials and vacancies have effectively equal mobilities.
It would be of interest to the community to identify physical factors that could be used either as descriptors to predict the barrier energies or to explain the variations in the barrier energies for different charge states. Lei and Wang [45], in their study of barrier energies of vacancies in \ceAl2O3, identified a correlation between barrier energies and the change in defect levels of the vacancies between transition and ground states. Following that approach, we compared the barrier energies with the differences in the defect levels (Figure S6 of SI for transition state DOS) and also the differences in the electrostatic potentials (Table S6 of SI) experienced by the diffusing ion at the transition states of the [221] pathway and the interstitial ground states for diffusion. Unlike the case of \ceAl2O3, in \ceCr2O3 no such correlation could be found between the barrier energies of and either of the two physical factors examined. Similarly, no such correlation was found for also, which are discussed in the following section (see Figures S7-S9 and Table S6 in SI). The barrier energies for both and are a result of complex interplay of variations in local geometrical distortion, electrostatic potentials, and electronic correlation effects.
3.3.2 O diffusion
An O interstitial forms a dumbbell configuration oriented along [221] around a regular O site. O ion diffusion is accomplished by bond switching, where one of the interstitial O ions jumps to one of the nearest O sites and forms a dumbbell configuration with the lattice O ion. The remaining O ion at the initial interstitial location returns to its regular lattice position.
| Diffusion Path | Length (Å) | Attempt Frequency (THz) | Migration barrier (eV) | ||||||
|---|---|---|---|---|---|---|---|---|---|
| () | 0 | -1 | -2 | 0 | -1 | -2 | 0 | -1 | -2 |
| [100] | 2.12 | 2.53 | 2.09 | 54.98 | 2.73 | 6.35 | 1.52 | 2.12 | 0.30 |
| [221] short | 2.34 | 2.25 | 2.23 | 27.15 | 2.13 | 6.77 | 1.27 | 0.21 | 0.29 |
| [221] long | 3.45 | 3.2 | 3.12 | – | 6.34 | 48.12 | – | 1.63 | 0.58 |
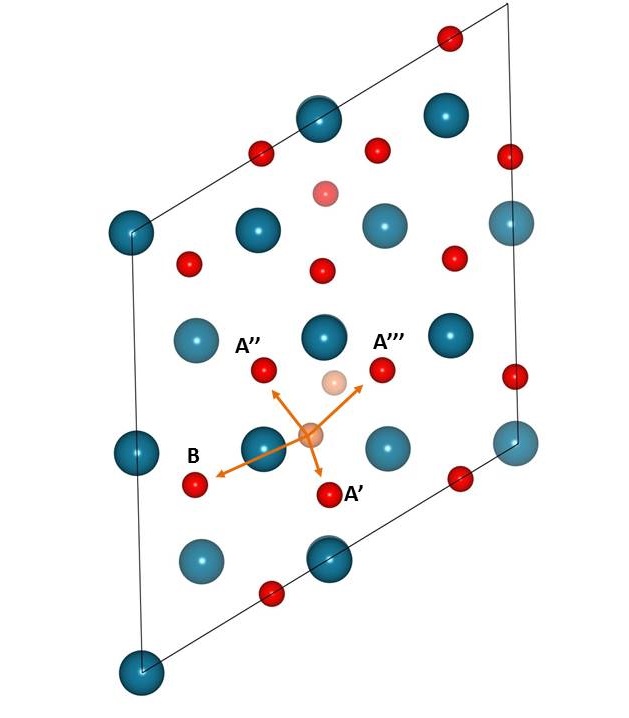
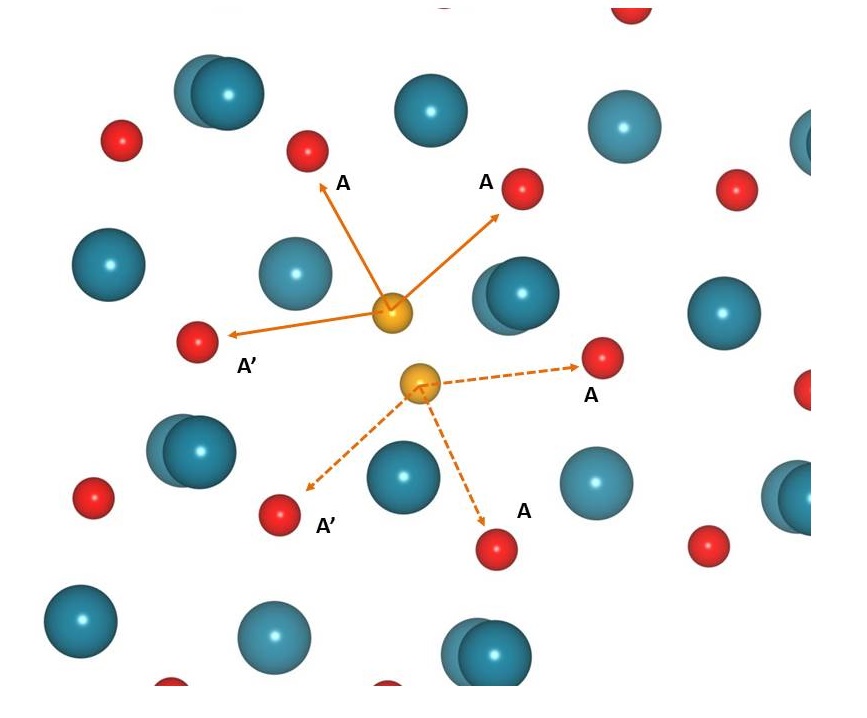
O diffusion pathways considered in this study are shown in Figure 9. The red spheres in Figure 9(a) represent the O ions in the adjacent to the defect plane O layer and the labeled ions are the nearest to the upper O interstitial ion (dark orange sphere). The ions labeled with A′, A′′, and A′′′ represent three closest ions equidistant to the center of the dumbbell configuration in a perfect crystal. Of these A′ is the closest site, followed by A′′ and A′′′. The sphere labeled as B represents the next closest O ion at around 3.1 – 3.5 Å from the dumbbell center, depending on the interstitial charge state. We computed the barrier energies associated with diffusion to A′ and B sites, denoted as [221]-short and [221]-long, respectively (Table. 4). In Figure 9(b), the red spheres represent O ions in the same layer as the interstitial ions. Out of six nearest ions the ions represented by A are equidistant from the O interstitial and those denoted by A′ are slightly farther away. The barrier energies were computed for O diffusion from interstitial site to A site.
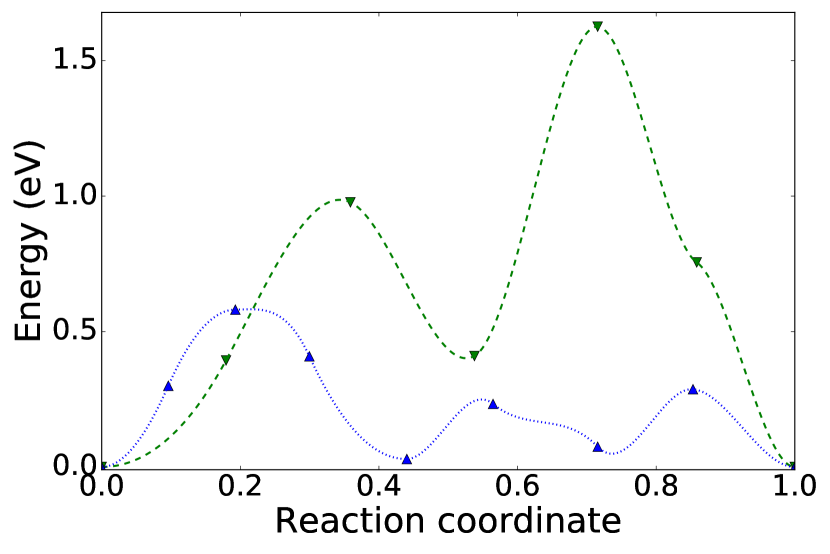
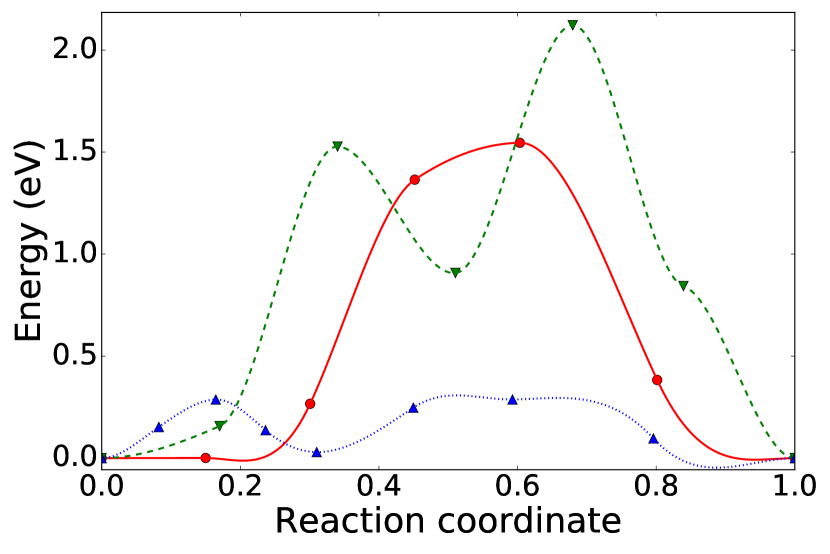
O diffusion calculations show that O migration energies are highly dependent on the interstitial charge and the diffusion pathway (Figure 10). has the lowest barrier energies ranging from 0.29 to 0.58 eV. Further diffusion pathway encompasses one metastable state along [221]-short and [100] pathways and two metastable states in the [221]-long pathway. The metastable state corresponds to the diffusing O interstitial ion breaking bond with the other O-ion in the dumbbell and occupying the 6-O coordinated octahedral site. The identical phonon DOS plots of the transition states (Fig. S1 in SI) and the nearly equal barrier energies for [221]-short and [100] pathways indicate that both pathways have a common transition state for -2 charge state. has a significantly lower barrier energy of 0.21 eV along the [221]-short pathway when compared to the 1.63 eV and 2.12 eV energies along [221]-long and [100] pathways respectively. Neutral on the other hand exhibits comparatively higher barrier energies around 1.5 eV for [221]-short and [100] pathways. We could not obtain convergence for diffusion along [221]-long path.
When compared to the O vacancies, O interstitials exhibit significantly lower barrier energies for diffusion. The lowest barrier energies of O vacancies are of the order of 1.2 – 1.5 eV for [18], whereas and have the lowest barrier energies of the order of 0.2 and 0.3 eV respectively. For the undoped \ceCr2O3, however, consideration has to be given to neutral vacancies and neutral oxygen interstitials, because of their higher concentration at . The neutral O interstitials are also significantly more mobile than neutral O vacancies with a 0.8 eV difference in the lowest barrier energies. It is noteworthy that under irradiation conditions, characterized by considerable and nearly equal in concentrations of interstitials and vacancies due to the formation of Frenkel defects, our results for barrier energies indicate that O interstitials could be responsible for oxygen transport in \ceCr2O3.
4 Summary
To develop a comprehensive model of defect-mediated diffusion processes in \ceCr2O3, we computed the electronic, thermodynamic, and diffusion properties of interstitials in \ceCr2O3. This work is an extension to our previous study of vacancies in \ceCr2O3. The formation energies of Cr and O interstitials in various charge states were evaluated for Cr-rich and O-rich conditions using the thermodynamic formalism proposed by Zhang and Northrup [34]. Our results indicate that Cr and O interstitials are deep defects, and contrary to vacancies, they do not generate any considerable local structural distortions.
O interstitials form dumbbell configurations and O diffusion is accomplished via bond switching mechanism. The computed migration barrier energies reveal that similar to vacancies, O interstitials are more mobile than Cr interstitials. Among different charge states of O interstitials, has the highest mobility for nearly all pathways. Overall, O interstitials are more mobile, i.e. incur lower barrier energies, than O vacancies.
Cr interstitials occupy the empty octahedral sites in the Cr sub-lattice and our calculations indicate that the preferred path for Cr interstitial diffusion is along [221] direction. The diffusion is accomplished via an intermediate metastable interstitial triple-defect configuration comprising a Cr interstitial and a Cr Frenkel defect in the adjacent Cr bilayer. Cr diffusion from one interstitial site to another site comprises two stages, with both basal and c-axis oriented diffusion happening in individual stages. The mobility of Cr interstitials is slightly higher but comparable to that of Cr vacancies.
The diffusion mechanisms of self-interstitials in \ceCr2O3 revealed in the present study can be used to understand the efficacy of \ceCr2O3 as a passivation layer and the corrosion mechanisms in Cr alloys under various physical conditions including irradiated conditions.
Acknowledgement
This work was supported by the U.S. Department of Energy, Office of Science, Basic Energy Sciences, Materials Sciences and Engineering Division. Simulations were performed using PNNL Institutional Computing facility. PNNL is a multiprogram National Laboratory operated by Battelle for the U.S. Department of Energy under Contract DE-AC06-76RLO 1830.
References
-
[1]
G. Koch, J. Varney, N. Thompson, O. Moghissi, M. Gould, J. Payer,
Nace
international measures of prevention, application, and economics of corrosion
technologies study, [Online; accessed 28-Feb-2018] (2016).
http://impact.nace.org/documents/Nace-International-Report.pdf - [2] H. W. Glea (Ed.), Vol. 2 of Proceedings of the 1st International Chromium Steel and Alloys Congress, SAIMM, 1992.
- [3] G. T. Van-Rooyen, The potential of chromium as an alloying element, in: H. W. Glea (Ed.), Chromium Steel and Alloys, Vol. 2 of Proceedings of the 1st International Chromium Steel and Alloys Congress, SAIMM, Cape Town, South Africa, 1992, pp. 43–47.
- [4] S. D. Cramer, J. B. S. Covino (Eds.), Corrosion: Materials, Vol. 13B, and Corrosion: Environment and Industries, Vol. 13C of ASM Handbook; ASM International: Materials Park, OH, USA, 2005.
- [5] G. S. Was, J. T. Busby, Role of irradiated microstructure and microchemistry in irradiation-assisted stress corrosion cracking, Philos. Mag. 85 (4-7) (2005) 443–465. doi:10.1080/02678370412331320224.
- [6] S. J. Zinkle, J. T. Busby, Structural materials for fission and fusion energy, Mater. Today 12 (11) (2009) 12 – 19. doi:10.1016/S1369-7021(09)70294-9.
- [7] D. Schreiber, M. Olszta, D. Saxey, K. Kruska, K. Moore, S. Lozano-Perez, S. Bruemmer, Examinations of oxidation and sulfidation of grain boundaries in alloy 600 exposed to simulated pressurized water reactor primary water, Microscopy and Microanalysis 19 (2013) 676–687. doi:10.1017/S1431927613000421.
- [8] D. Schreiber, M. Olszta, S. Bruemmer, Grain boundary depletion and migration during selective oxidation of cr in a ni-5cr binary alloy exposed to high-temperature hydrogenated water, Scripta Materialia 89 (2014) 41 – 44. doi:10.1016/j.scriptamat.2014.06.022.
- [9] P. Kofstad, K. Lillerud, Chromium transport through \ceCr2O3 scales i. on lattice diffusion of chromium, Oxidation of metals 17 (3-4) (1982) 177–194.
- [10] A. Sabioni, B. Lesage, A. Huntz, J. Pivin, C. Monty, Self-diffusion in \ceCr2O3 I. Chromium diffusion in single crystals, Philosophical Magazine A 66 (3) (1992) 333–350.
- [11] A. Sabioni, A. Huntz, F. Millot, C. Monty, Self-diffusion in \ceCr2O3 II. Oxygen diffusion in single crystals, Philosophical Magazine A 66 (3) (1992) 351–360.
- [12] A. Sabioni, A. Huntz, F. Millot, C. Monty, Self-diffusion in \ceCr2O3 III. Chromium and oxygen grain-boundary diffusion in polycrystals, Philosophical Magazine A 66 (3) (1992) 361–374.
- [13] K. Hoshino, N. Peterson, Cation self-diffusion in \ceCr2O3, Journal of the American Ceramic Society 66 (11).
- [14] R. Latanision, R. Staehle, Stress corrosion cracking of iron–nickel–chromium alloys, Tech. rep., Ohio State Univ. Research Foundation, Columbus (1967).
- [15] E. Schmucker, C. Petitjean, L. Martinelli, P.-J. Panteix, S. B. Lagha, M. Vilasi, Oxidation of ni-cr alloy at intermediate oxygen pressures. i. diffusion mechanisms through the oxide layer, Corrosion Science 111 (2016) 474–485. doi:10.1016/j.corsci.2016.05.025.
- [16] P. Cao, D. Wells, M. P. Short, Anisotropic ion diffusion in -\ceCr2O3: an atomistic simulation study, Phys. Chem. Chem. Phys. 19 (2017) 13658.
- [17] F. Lebreau, M. M. Islam, B. Diawara, P. Marcus, Structural, magnetic, electronic, defect, and diffusion properties of \ceCr2O3: A dft+u study, J. Phys. Chem. C 118 (31) (2014) 18133–18145. doi:10.1021/jp5039943.
- [18] B. Medasani, M. L. Sushko, K. M. Rosso, D. K. Schreiber, S. M. Bruemmer, Vacancies and vacancy-mediated self diffusion in cr2o3: A first-principles study, J. Phys. Chem. C 121 (3) (2017) 1817–1831. doi:10.1021/acs.jpcc.7b00071.
- [19] C. Gray, Y. Lei, G. Wang, Charged vacancy diffusion in chromium oxide crystal: Dft and dft+u predictions, J. Appl. Phys. 120 (21) (2016) 215101. doi:10.1063/1.4970882.
- [20] J. Vaari, Molecular dynamics simulations of vacancy diffusion in chromium(iii) oxide, hematite, magnetite and chromite, Solid State Ion. 270 (2015) 10 – 17. doi:10.1016/j.ssi.2014.11.027.
- [21] L. Latu-Romain, Y. Parsa, S. Mathieu, M. Vilasi, A. Galerie, Y. Wouters, Towards the growth of stoichiometric chromia on pure chromium by the control of temperature and oxygen partial pressure, Corrosion Science 126 (2017) 238 – 246. doi:10.1016/j.corsci.2017.07.005.
- [22] P. Hohenberg, W. Kohn, Inhomogeneous electron gas, Phys. Rev. 136 (1964) B864–B871. doi:10.1103/PhysRev.136.B864.
- [23] W. Kohn, L. J. Sham, Self-consistent equations including exchange and correlation effects, Phys. Rev. 140 (1965) A1133–A1138. doi:10.1103/PhysRev.140.A1133.
- [24] J. P. Perdew, S. Kurth, in: C. Fiolhais, F. Nogueira, M. Marques (Eds.), A Primer in Density Functional Theory, Springer, Berlin, 1990.
- [25] C. Freysoldt, B. Grabowski, T. Hickel, J. Neugebauer, G. Kresse, A. Janotti, C. G. Van de Walle, First-principles calculations for point defects in solids, Rev. Mod. Phys. 86 (2014) 253–305. doi:10.1103/RevModPhys.86.253.
- [26] D. Broberg, B. Medasani, N. E. Zimmermann, G. Yu, A. Canning, M. Haranczyk, M. Asta, G. Hautier, Pycdt: A python toolkit for modeling point defects in semiconductors and insulators, Computer Physics Communications 226 (2018) 165 – 179. doi:10.1016/j.cpc.2018.01.004.
- [27] S. P. Ong, W. D. Richards, A. Jain, G. Hautier, M. Kocher, S. Cholia, D. Gunter, V. L. Chevrier, K. A. Persson, G. Ceder, Python materials genomics (pymatgen) a robust, open-source python library for materials analysis, Comput. Mater. Sci. 68 (2013) 314.
- [28] N. E. R. Zimmermann, M. K. Horton, A. Jain, M. Haranczyk, Assessing local structure motifs using order parameters for motif recognition, interstitial identification, and diffusion path characterization, Frontiers in Materials 4 (2017) 34. doi:10.3389/fmats.2017.00034.
- [29] G. Kresse, J. Hafner, Ab initio molecular dynamics for liquid metals, Phys. Rev. B 47 (1993) 558–561. doi:10.1103/PhysRevB.47.558.
- [30] G. Kresse, J. Hafner, Ab initio molecular-dynamics simulation of the liquid-metal˘amorphous-semiconductor transition in germanium, Phys. Rev. B 49 (1994) 14251–14269. doi:10.1103/PhysRevB.49.14251.
- [31] G. Kresse, J. Furthmüller, Efficient iterative schemes for ab initio total-energy calculations using a plane-wave basis set, Phys. Rev. B 54 (1996) 11169–11186. doi:10.1103/PhysRevB.54.11169.
- [32] A. I. Liechtenstein, V. I. Anisimov, J. Zaanen, Density-functional theory and strong interactions: Orbital ordering in mott-hubbard insulators, Phys. Rev. B 52 (1995) R5467–R5470. doi:10.1103/PhysRevB.52.R5467.
- [33] A. Rohrbach, J. Hafner, G. Kresse, ab initio study of the (0001) surfaces of hematite and chromia: Influence of strong electronic correlations, Phys. Rev. B 70 (2004) 125426. doi:10.1103/PhysRevB.70.125426.
- [34] S. B. Zhang, J. E. Northrup, Chemical potential dependence of defect formation energies in GaAs: Application to ga self-diffusion, Phys. Rev. Lett. 67 (1991) 2339–2342.
- [35] G. Henkelman, B. P. Uberuaga, H. Jónsson, A climbing image nudged elastic band method for finding saddle points and minimum energy paths, J. Chem. Phys. 113 (2000) 9901–9904.
- [36] A. Togo, I. Tanaka, First principles phonon calculations in materials science, Scr. Mater. 108 (2015) 1–5.
- [37] K. Momma, F. Izumi, VESTA3 for three-dimensional visualization of crystal, volumetric and morphology data, J. Appl. Crystallogr. 44 (2011) 1272–1276.
- [38] B. Huang, R. Gillen, J. Robertson, Study of ceo2 and its native defects by density functional theory with repulsive potential, The Journal of Physical Chemistry C 118 (42) (2014) 24248–24256. doi:10.1021/jp506625h.
- [39] A. B. Kehoe, E. Arca, D. O. Scanlon, I. V. Shvets, G. W. Watson, Assessing the potential of mg-doped cr 2 o 3 as a novel p -type transparent conducting oxide, Journal of Physics: Condensed Matter 28 (12) (2016) 125501.
- [40] J. J. Carey, M. Legesse, M. Nolan, Low valence cation doping of bulk cr2o3: Charge compensation and oxygen vacancy formation, The Journal of Physical Chemistry C 120 (34) (2016) 19160–19174. doi:10.1021/acs.jpcc.6b05575.
- [41] S. Lany, Semiconducting transition metal oxides, Journal of Physics: Condensed Matter 27 (28) (2015) 283203.
- [42] C. Freysoldt, J. Neugebauer, C. G. Van de Walle, Fully ab initio finite-size corrections for charged-defect supercell calculations, Phys. Rev. Lett. 102 (2009) 016402. doi:10.1103/PhysRevLett.102.016402.
- [43] Y. Kumagai, F. Oba, Electrostatics-based finite-size corrections for first-principles point defect calculations, Phys. Rev. B 89 (2014) 195205. doi:10.1103/PhysRevB.89.195205.
- [44] A. Janotti, C. G. Van de Walle, Native point defects in zno, Phys. Rev. B 76 (2007) 165202.
- [45] Y. Lei, G. Wang, Linking diffusion kinetics to defect electronic structure in metal oxides: Charge-dependent vacancy diffusion in alumina, Scripta Materialia 101 (2015) 20 – 23. doi:10.1016/j.scriptamat.2015.01.008.