Abstract
The ExoMol project is dedicated to providing molecular line lists for exoplanet and other hot atmospheres. The ExoMol procedure uses a mixture of ab initio calculations and available laboratory data. The actual line lists are generated using variational nuclear motion calculations. These line lists form the input for opacity models for cool stars and brown dwarfs as well as for radiative transport models involving exoplanets. This paper is a collection of molecular opacities for 52 molecules (130 isotopologues) at two reference temperatures, 300 K and 2000 K, using line lists from the ExoMol database. So far, ExoMol line lists have been generated for about 30 key molecular species. Other line lists are taken from external sources or from our work predating the ExoMol project. An overview of the line lists generated by ExoMol thus far is presented and used to evaluate further molecular data needs. Other line lists are also considered. The requirement for completeness within a line list is emphasized and needs for further line lists discussed.
keywords:
exoplanets; brown stars; cool stars; opacity; molecular spectra; ExoMolx \doinum10.3390/—— \pubvolumexx \historyReceived: 25 February 2018; Accepted: 4 May 2018; Published: date \updatesyes \TitleThe ExoMol Atlas of Molecular Opacities \AuthorJonathan Tennyson *\orcidA and Sergei N. Yurchenko \orcidB \AuthorNamesJonathan Tennyson and Sergei N. Yurchenko
1 Introduction
Molecular opacities dictate the atmospheric properties and evolution of a whole range of cool stars and all brown dwarfs. They are also important for the radiative transport properties of exoplanets. Even for a relatively simple molecule, the opacity function is generally complicated as it varies strongly with both wavelength and temperature. This is because molecules interact with light via a variety of different motions, namely rotational, vibrational and electronic, and the close-spacing of the energy levels leads to strong temperature dependence related to the thermal occupancy of the levels.
Molecular opacity functions, such as the ones provided by Sharp and Burrows Sharp and Burrows (2007), require very extensive input in the form of temperature-dependent spectroscopic data for atoms and molecules. At room temperature, the HITRAN database Gordon et al. (2017) provides comprehensive and validated spectroscopic parameters for molecules found in the Earth’s atmosphere and some other species. However, the complexity of molecular spectra increases rapidly with temperature and data from HITRAN and can only be used with extreme caution at higher temperatures Schreier et al. (2018). The HITEMP database Rothman et al. (2010) is a HITRAN-style database designed to work at higher temperatures. However, HITEMP only contains spectroscopic line lists for five molecules and there are improved line lists available for each of these species, namely: H2O Polyansky et al. (2018), CO2 Tashkun and Perevalov (2011); Huang et al. (2017), CO Li et al. (2015), NO Wong et al. (2017), and OH Brooke et al. (2016). The opacity of all of these species are discussed further below.
The need for extensive, high temperature spectroscopic data on molecules, many of whom do not occur in the Earth’s atmosphere, has led to a number of systematic efforts to generate the molecular line lists required Jørgensen et al. (1996); Plez (1998); Weck et al. (2003); Bernath (2009); Tennyson and Yurchenko (2012); Rey et al. (2016); Huang et al. (2017). In particular, a number of groups have been progressively generating line lists for key molecules. These includes the TheoReTS Rey et al. (2016) group (Reims/Tomsk), the NASA Ames team and our own ExoMol activity based in University College London, all of which used similar theoretical procedures discussed below, and an experimental initiative led by Bernath Bernath (2009). These activities have been significantly enhanced by the discovery of exoplanets and the requirement of extensive line lists to be used in exoplanet models and characterization Tinetti et al. (2007, 2013).
As molecular line lists are extended, complicated and have a strong temperature dependence, it can be hard to understand a priori spectral regions where they show significant absorption. This work aims to summarize the absorption by the key molecular species required for cool stars, brown dwarfs and exoplanets. Many of the line lists used are taken from those computed by the Exomol project, but these are augmented by lists taken from other sources to give a comprehensive set, or atlas, of absorbing species.
In this work, we present a collection (atlas) of molecular opacities for 52 molecules (130 isotopologues) generated using line lists from the ExoMol database. The opacities are presented in the form of cross sections for two reference temperatures, 300 K and 2000 K using the Doppler (zero-pressure) broadening. The goal of this atlas is to present in a simple, visual form an overview of spectroscopic coverage, main spectroscopic signatures as well as temperature dependence of the molecular opacities relevant for atmospheric studies of hot exoplanets and stars.
2 Methodology
The general methodology used by the ExoMol project is very similar to that used by both the TheoReTS and NASA Ames group for producing molecular line lists. It has been well-described elsewhere Tennyson (2012); Tennyson and Yurchenko (2017) and below we will discuss only general considerations.
Our technique involves the following general steps: (1) computing accurate ab initio potential energy and dipole surface moment surfaces, (2) improving the potential energy surface (PES) using available high-resolution spectroscopic data and (3) generating a comprehensive line list using the improved PES, ab initio dipole moment surface (DMS) and an appropriate variational nuclear motion program Yurchenko et al. (2016); Tennyson et al. (2004); Yurchenko et al. (2007). Development of these program specifically for opacity calculations has been discussed by us elsewhere Tennyson and Yurchenko (2017).
Performing such calculations is always a trade-off between completeness and accuracy. A complete line list should contain information on possible transitions at all wavelengths and at all temperatures. An accurate one should reproduce line positions and transition probabilities to the high standards of laboratory high resolution spectroscopy. In practice, for most systems, it is hard if not impossible to achieve both of these goals simultaneously so compromises have to be made. Experience shows that completeness is essential Yurchenko et al. (2014) while accuracy is something to strive for and, of course, is essential for high resolution spectroscopic studies Hoeijmakers et al. (2015).
Starting from an ab initio PES, there are three ways of improving the accuracy of the line positions. The first method is to fit the potential to measured transitions frequencies, empirical energies or a mixture of both. This is now a standard technique that is widely employed. It is capable of giving very good results Partridge and Schwenke (1997) if in most cases not actual experimental accuracy. The second technique is to adjust the vibrational band origins during the calculation. This technique works only if the rotation–vibration basis used is a simple product between vibrational and rotational functions. A basis in this form is used by the polyatomic nuclear motion program TROVE Yurchenko et al. (2007) and the vibrational basis is contracted by performing an initial rotationless () calculations. At this stage, the band origins can be shifted to their empirical value Yurchenko et al. (2011). Finally, the ExoMol data structure Tennyson et al. (2013) presents a line list as a states file with energy levels and associated quantum numbers and a highly compact transitions file of Einstein A coefficients. This structure therefore allows computed energy levels to be replaced with empirical ones after the calculation is complete; indeed, this can be done some time after the line list is computed if new empirical data becomes available Barber et al. (2014). This allows many transition frequencies to be generated with experimental accuracy, including ones that have not actually been measured.
To provide lists of accurate empirical energy levels, Furtenbacher et al. Furtenbacher et al. (2007); Furtenbacher and Császár (2012) developed the measured active rotation vibration energy level procedure (MARVEL). Table 1 gives a summary of molecules of astronomical importance for which the MARVEL procedure has been applied. Overviews of this methodology can be found elsewhere Császár et al. (2007); Tennyson et al. (2014).
| Molecule | Reference(s) | |||
|---|---|---|---|---|
| H2O | 9 | 182,156 | 18,486 | Tennyson et al. (2009, 2010, 2013, 2014) |
| H | 3 | 1410 | 911 | Furtenbacher et al. (2013a, b) |
| NH3 | 1 | 28,530 | 4961 | Al Derzi et al. (2015) |
| C2 | 1 | 23,343 | 5699 | Furtenbacher et al. (2016) |
| TiO | 1 | 48,590 | 10,564 | McKemmish et al. (2017) |
| HCCH | 1 | 37,813 | 11,213 | Chubb et al. (2018) |
| SO2 | 3 | 40,269 | 15,130 | Tóbiás et al. (2018) |
| H2S | 1 | 39,267 | 7651 | Chubb et al. (2018) |
| ZrO | 1 | 21,195 | 8329 | McKemmish et al. (2018) |
| : Number of isotopologues considered; : Number of transitions validated for the main isotopologue; : Number of energy levels given for the main isotopologue. |
The line lists generated by the methods discussed above form the input to opacity calculations. To judge the potential influence of each molecule on the opacity, one can generate cross sections as a function of wavelength and temperature. As several of the line lists considered contain many billions of lines (see Table 2), calculating cross sections can be computationally expensive. For this reason, we have developed a highly optimized program ExoCross Yurchenko et al. (2018), which generates wavelength-dependent cross sections as function of temperature and pressure. Here, we use ExoCross to systematically generate cross sections for the key species that are important for opacities of cool stars, brown dwarfs and exoplanets.
In generating these cross sections, we consider the main (parent) isotopologue of each species, which is taken as being in 100 % abundance. For simplicity, we use a Doppler profile on a wavenumber grid of 1 cm-1. The cross sections have been generated using the methodology by Hill et al. Hill et al. (2013). The cross sections can be also obtained at higher resolutions (up to 0.01 cm-1) using the cross sections App at www.exomol.com.
Cross sections were generated at two standard temperatures of 300 K and 2000 K except when the molecule is expected to be entirely in the condensed phase at 300 K. For a few, key strongly bound species, we also consider the cross section at 5000 K, which is near the upper limit of the temperature where molecules make a contribution to opacities.
3 Results
Table 2 summarises the molecules for which line lists have been provided as part of the ExoMol project. Sources for line lists of other key species are given in Table 3. Data for all these species, including cross sections, are available on the ExoMol website.
Figures 1–15 display temperature-dependent cross sections for each of these species. For all molecules except water, only results for the major (parent) isotopologue are given. As specified in Table 2, many ExoMol line lists also consider isotopically substituted species. In most cases, isotopic substitution leads to shifts in spectroscopic features that are observable at medium to high resolution but result in no fundamental change in structure of the spectrum. The exception is where this substitution leads to breaking of the symmetry, which can lead to new features due to changes in the way the Pauli principle applies, examples here include 12C12C to 12C13C, and changes in vibrational structure such as those encountered on moving from H2O to HDO.
| Paper | Molecule | DSName | Reference | ||||
|---|---|---|---|---|---|---|---|
| I | BeH | 1 | 2000 | 1 | 16,400 | Yadin | Yadin et al. (2012) |
| I | MgH | 3 | 2000 | 1 | 10,354 | Yadin | Yadin et al. (2012) |
| I | CaH | 1 | 2000 | 1 | 15,278 | Yadin | Yadin et al. (2012) |
| II | SiO | 5 | 9000 | 1 | 254,675 | EJBT | Barton et al. (2013) |
| III | HCN/HNC | 1 | 4000 | 1 | 399,000,000 | Harris | Barber et al. (2014) |
| IV | CH4 | 1 | 1500 | 1 | 9,819,605,160 | YT10to10 | Yurchenko and Tennyson (2014) |
| V | NaCl | 2 | 3000 | 1 | 702,271 | Barton | Barton et al. (2014) |
| V | KCl | 4 | 3000 | 1 | 1,326,765 | Barton | Barton et al. (2014) |
| VI | PN | 2 | 5000 | 1 | 142,512 | YYLT | Yorke et al. (2014) |
| VII | PH3 | 1 | 1500 | 1 | 16,803,703,395 | SAlTY | Sousa-Silva et al. (2015) |
| VIII | H2CO | 1 | 1500 | 1 | 10,000,000,000 | AYTY | Al-Refaie et al. (2015) |
| IX | AlO | 4 | 8000 | 3 | 4,945,580 | ATP | Patrascu et al. (2015) |
| X | NaH | 2 | 7000 | 2 | 79,898 | Rivlin | Rivlin et al. (2015) |
| XI | HNO3 | 1 | 500 | 1 | 6,722,136,109 | AlJS | Pavlyuchko et al. (2015) |
| XII | CS | 8 | 3000 | 1 | 548,312 | JnK | Paulose et al. (2015) |
| XIII | CaO | 1 | 5000 | 5 | 21,279,299 | VBATHY | Yurchenko et al. (2016) |
| XIV | SO2 | 1 | 2000 | 1 | 1,300,000,000 | ExoAmes | Underwood et al. (2016) |
| XV | H2O2 | 1 | 1250 | 1 | 20,000,000,000 | APTY | Al-Refaie et al. (2016) |
| XIV | H2S | 1 | 2000 | 1 | 115,530,3730 | AYT2 | Azzam et al. (2016) |
| XV | SO3 | 1 | 800 | 1 | 21,000,000,000 | UYT2 | Underwood et al. (2016) |
| XVI | VO | 1 | 2000 | 13 | 277,131,624 | VOMYT | McKemmish et al. (2016) |
| XIX | H217,18O | 2 | 3000 | 1 | 519,461,789 | HotWat78 | Polyansky et al. (2017) |
| XX | H | 1 | 3000 | 1 | 11,500,000,000 | MiZATeP | Mizus et al. (2017) |
| XXI | NO | 6 | 5000 | 2 | 2,281,042 | NOName | Wong et al. (2017) |
| XXII | SiH4 | 1 | 1200 | 1 | 62,690,449,078 | OY2T | Owens et al. (2017) |
| XXIII | PO | 1 | 5000 | 1 | 2,096,289 | POPS | Prajapat et al. (2017) |
| XXIII | PS | 1 | 5000 | 3 | 30,394,544 | POPS | Prajapat et al. (2017) |
| XXIV | SiH | 4 | 5000 | 3 | 1,724,841 | SiGHTLY | Yurchenko et al. (2018) |
| XXV | SiS | 12 | 5000 | 1 | 91,715 | UCTY | Upadhyay et al. (2018) |
| XXVI | HS | 6 | 5000 | 1 | 219,463 | SNaSH | Yurchenko et al. (2018) |
| XXVI | NS | 6 | 5000 | 1 | 3,479,067 | SNaSH | Yurchenko et al. (2018) |
| XXVII | C2H4 | 1 | 700 | 1 | 49,841,085,051 | MaYTY | Mant et al. (2018) |
| XXVIII | AlH | 3 | 5000 | 3 | 40,000 | AlHambra | Yurchenko et al. (2018a) |
| XXIX | CH3Cl | 2 | 1200 | 1 | 166,279,593,333 | OYT | Mant et al. (2018) |
| XXX | H216O | 1 | 5000 | 1 | 1,500,000,000 | POPKAZATEL | Polyansky et al. (2018) |
| XXXI | C2 | 3 | 5000 | 8 | 6,080,920 | 8State | Yurchenko et al. (2018b) |
| XXXII | MgO | 3 | 5000 | 4 | 22,579,054 | LiPTY | Li et al. (2018) |
| : Number of isotopologues considered; : Maximum temperature for which the line list is complete; : Number of electronic states considered; : Number of lines, value is for the main isotopologue; DSName: Name of line list and of data set in ExoMol database Tennyson et al. (2016). |
For most species, absorption cross sections are plotted at two temperatures: 300 K and 2000 K. Exceptions are where the species is unlikely to have significant vapor pressure at 300 K, when this curve has been omitted, or when the species unlikely to survive at 2000 K, in which case an appropriate, lower temperature is used. The figures are grouped according to whether the line lists concerned cover the infrared only (wavenumbers below 12,000 cm-1), extend into the visible (wavenumbers below 20,000 cm-1) or cover the near ultraviolet (wavenumbers below 35,000 cm-1). Beyond that, the figures are grouped to contain roughly similar species. Each of the figures and species are considered in turn below.
| Molecule | DSName | Reference | Methodology | |||||
|---|---|---|---|---|---|---|---|---|
| Line Positions | Intensities | |||||||
| NH3 | 2 | 1500 | 1 | 1,138,323,351 | BYTe | Yurchenko et al. (2011) | empirical a | ab initio a |
| LiH | 1 | 12,000 | 1 | 18,982 | CLT | Coppola et al. (2011) | ab initio | ab initio |
| ScH | 1 | 5000 | 6 | 1,152,827 | LYT | Lodi et al. (2015) | tuned ab initio | ab initio |
| NH | 1 | 1 | 10,414 | 14BrBeWe | Brooke et al. (2014) | empirical | ab initio | |
| CH | 2 | 6000 | 4 | 54,086 | 14MaPlVa | Masseron et al. (2014) | empirical | ab initio |
| CO | 9 | 9000 | 1 | 752,976 | 15LiGoRo | Li et al. (2015) | empirical | emp./ab initio b |
| OH | 1 | 6000 | 1 | 45,000 | 16BrBeWe | Brooke et al. (2016) | empirical | ab initio |
| CN | 1 | 1 | 195,120 | 14BrRaWe | Brooke et al. (2014) | empirical | ab initio | |
| CP | 1 | 1 | 28,735 | 14RaBrWe | Ram et al. (2014) | empirical | ab initio | |
| HCl | 1 | 1 | 2588 | 11LiGoBe | Li et al. (2013) | empirical | ab initio | |
| FeH | 1 | 2 | 93,040 | 10WEReSe | Wende et al. (2010) | empirical | ab initio | |
| TiH | 1 | 3 | 181,080 | 05BuDuBa | Burrows et al. (2005) | empirical | ab initio | |
| CO2 | 13 | 1000 | 1 | 149,587,373 | Ames-2016 | Huang et al. (2017) | empirical | ab initio |
| TiO | 1 | 13 | 45,000,000 | Schwenke | Schwenke (1998) | tuned ab initio | ab initio | |
| C2H2 | 1 | 1000 | 1 | 33,890,981 | ASD-1000 | Lyulin and Perevalov (2017) | effect. Hamilt. c | effect. dipole c |
| CrH | 1 | 2 | 13824 | 02BuRaBe | Burrows et al. (2002) | empirical | ab initio | |
| CH3F | 1 | 1 | 1,391,882,159 | OYKYT | Owens et al. (2018) | ab initio | ab initio | |
| : Number of isotopologues considered; : Maximum temperature for which the line list is complete (where stated); : Number of electronic states considered; : Number of lines: value is for the main isotopologue; DSName: Name of line list and of data set in ExoMol database Tennyson et al. (2016); a ExoMol methodology, see text; b A mixture of empirical and ab initio values of the dipole moment function; c Empirical, based on Effective Hamiltonian and Dipole moment expansions. |
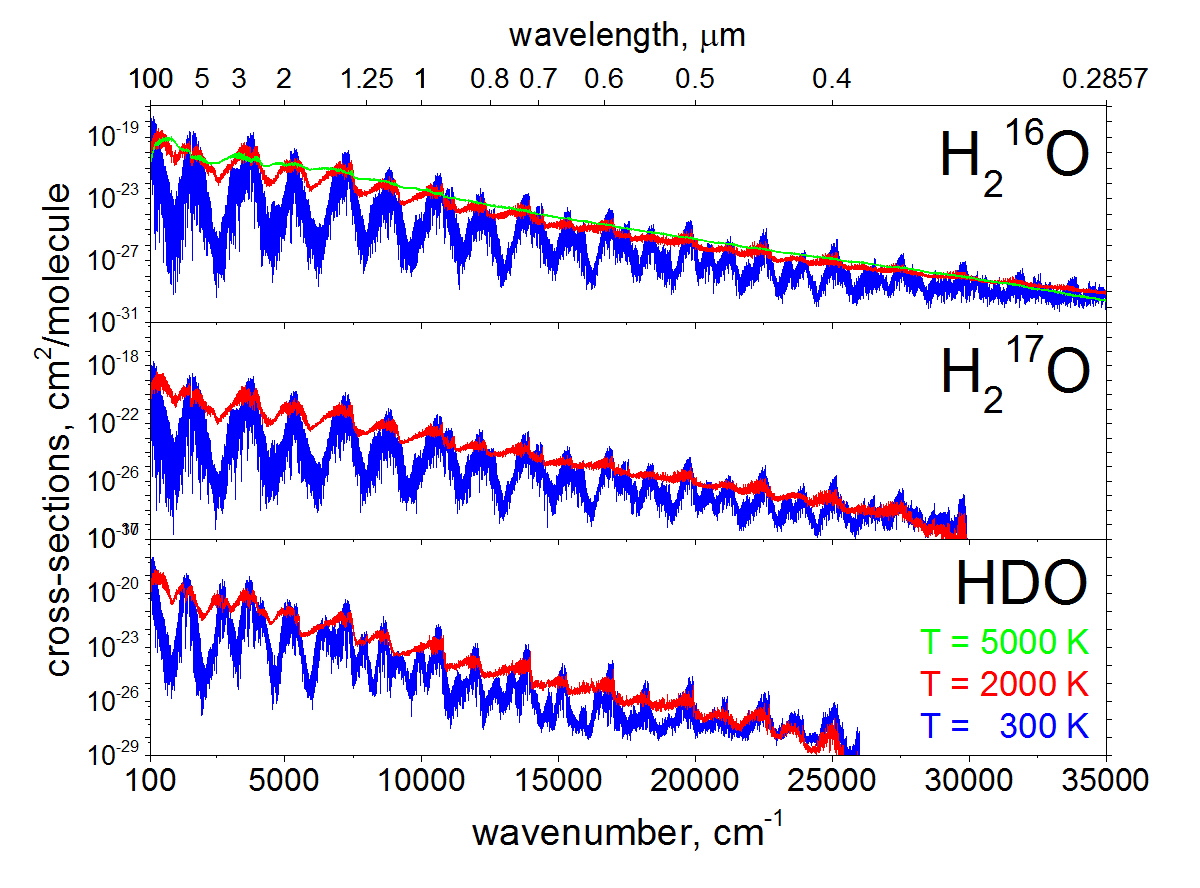
H2O: the spectrum of water (see Figure 1) is important in a whole range of astronomical objects Bernath (2009) including M-dwarfs Allard et al. (1994) and exoplanets Tinetti et al. (2012). The ExoMol line lists for H218O and H217O complement the H216O BT2 line list Barber et al. (2006), which has been widely used for astronomical studies including, for instance, as the foundation of the BT-Settl cool star model atmosphere Allard (2014). A comprehensive line list for HDO is also available Voronin et al. (2010). In fact, we have recently updated BT2 with a new H216O line list known as POKAZATEL Polyansky et al. (2018). Besides greatly improving the accuracy of the previous line list, it also extends the temperature range beyond 3000 K, which BT2 was designed for. POKAZATEL has been tested against laboratory spectra recorded in flames and was found to perform very well Rutkowski et al. (2018). On the scale of the figure, BT2 and POKAZATEL are very similar for temperatures below 2000 K, although the detailed line positions given by POKAZATEL are considerably more accurate (see the laboratory study by Campargue et al. Campargue et al. (2017), for example). However, at high temperatures, POKAZATEL is much more complete. What is really noticeable is how flat the water opacity becomes at high temperatures.
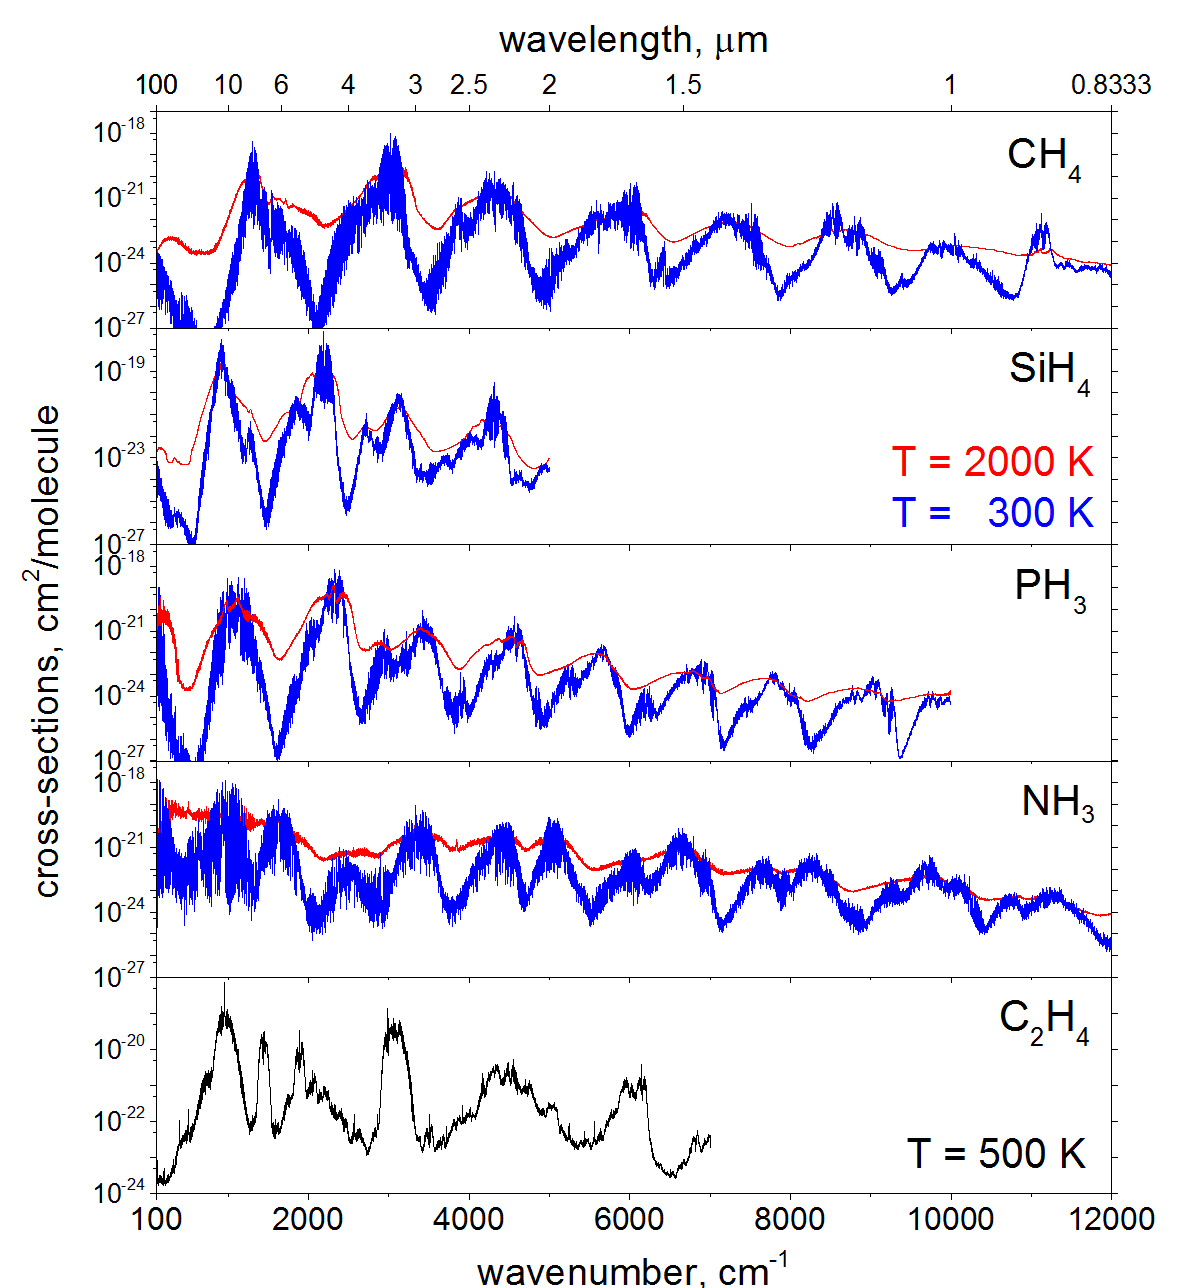
Figure 2 shows cross sections for a number of other hydrides: methane, silane, phosphine, ammonia and ethylene.
CH4: Figure 2 shows the methane cross sections generated by the 10to10 line list, which contains almost transitions. Other line lists available for methane are notably the TheoReTS line list(s) Rey et al. (2014, 2017), and a comprehensive experimental line list from Hargreaves et al. Hargreaves et al. (2012, 2015). The 10to10 line list has been used to identify spectroscopic features in T-dwarfs Canty et al. (2015). Model calculations have shown that reproducing the atmospheric opacity of these methane-rich brown dwarfs requires the explicit consideration of many billions of transitions Yurchenko et al. (2014). As the temperature range of 10to10 is limited, we have recently extended it with a new 34to10 line list, which contains transitions Yurchenko et al. (2017). To make use of this line list tractable in radiative transport models, the weak lines are amalgamated into so-called super-lines Rey et al. (2016). The temperature coverage for the various methane line lists, which broadly agree with each other, is probably now adequate for astrophysical purposes. However, there is a need for better coverage at shorter wavelengths (< m).
PH3: the phosphine cross sections (see Figure 2) show a very pronounced feature about 4.5 m, which displays only weak dependence on temperature. Phosphine is a well-known component of solar system gas giants Fletcher et al. (2009), and it can be anticipated that this feature will at some point be used to identify PH3 in exoplanets.
NH3: the spectrum of ammonia is given in Figure 2. Ammonia spectra are well known in brown dwarfs Canty et al. (2015) and are thought to provide the key signature for coolest class of these species known as Y-dwarfs. Plotted is the BYTe line list, which is significantly less accurate than most of the other line lists considered here and is really only complete for wavenumbers below 10,000 cm-1 and K. A new ExoMol line list that should help resolve these issues is currently under construction. A line list for 15NH3 is also available Yurchenko (2015).
C2H4: the final spectrum given in Figure 2 is of ethylene. Only one temperature is plotted since, despite containing 60 billions line, the line list is only complete up to 700 K. However, it is likely that ethylene will decompose at higher temperatures. Although not shown here, the main features of the ethylene spectrum show an unusually small sensitivity to temperature Mant et al. (2018). Rey et al. Rey et al. (2016) have also computed a far-infrared ethylene line list.
Figure 3 shows cross sections for a variety of polyatomic oxides plus hydrogen cyanide.
H2O2: hydrogen peroxide cross sections are given in Figure 3. It should be noted that even at room temperature the line list for H2O2 given by the current release of HITRAN Gordon et al. (2017) is not complete, as the strong mid-infrared absorptions are missing. This is because of the difficulty of analyzing the observed spectra in this region.
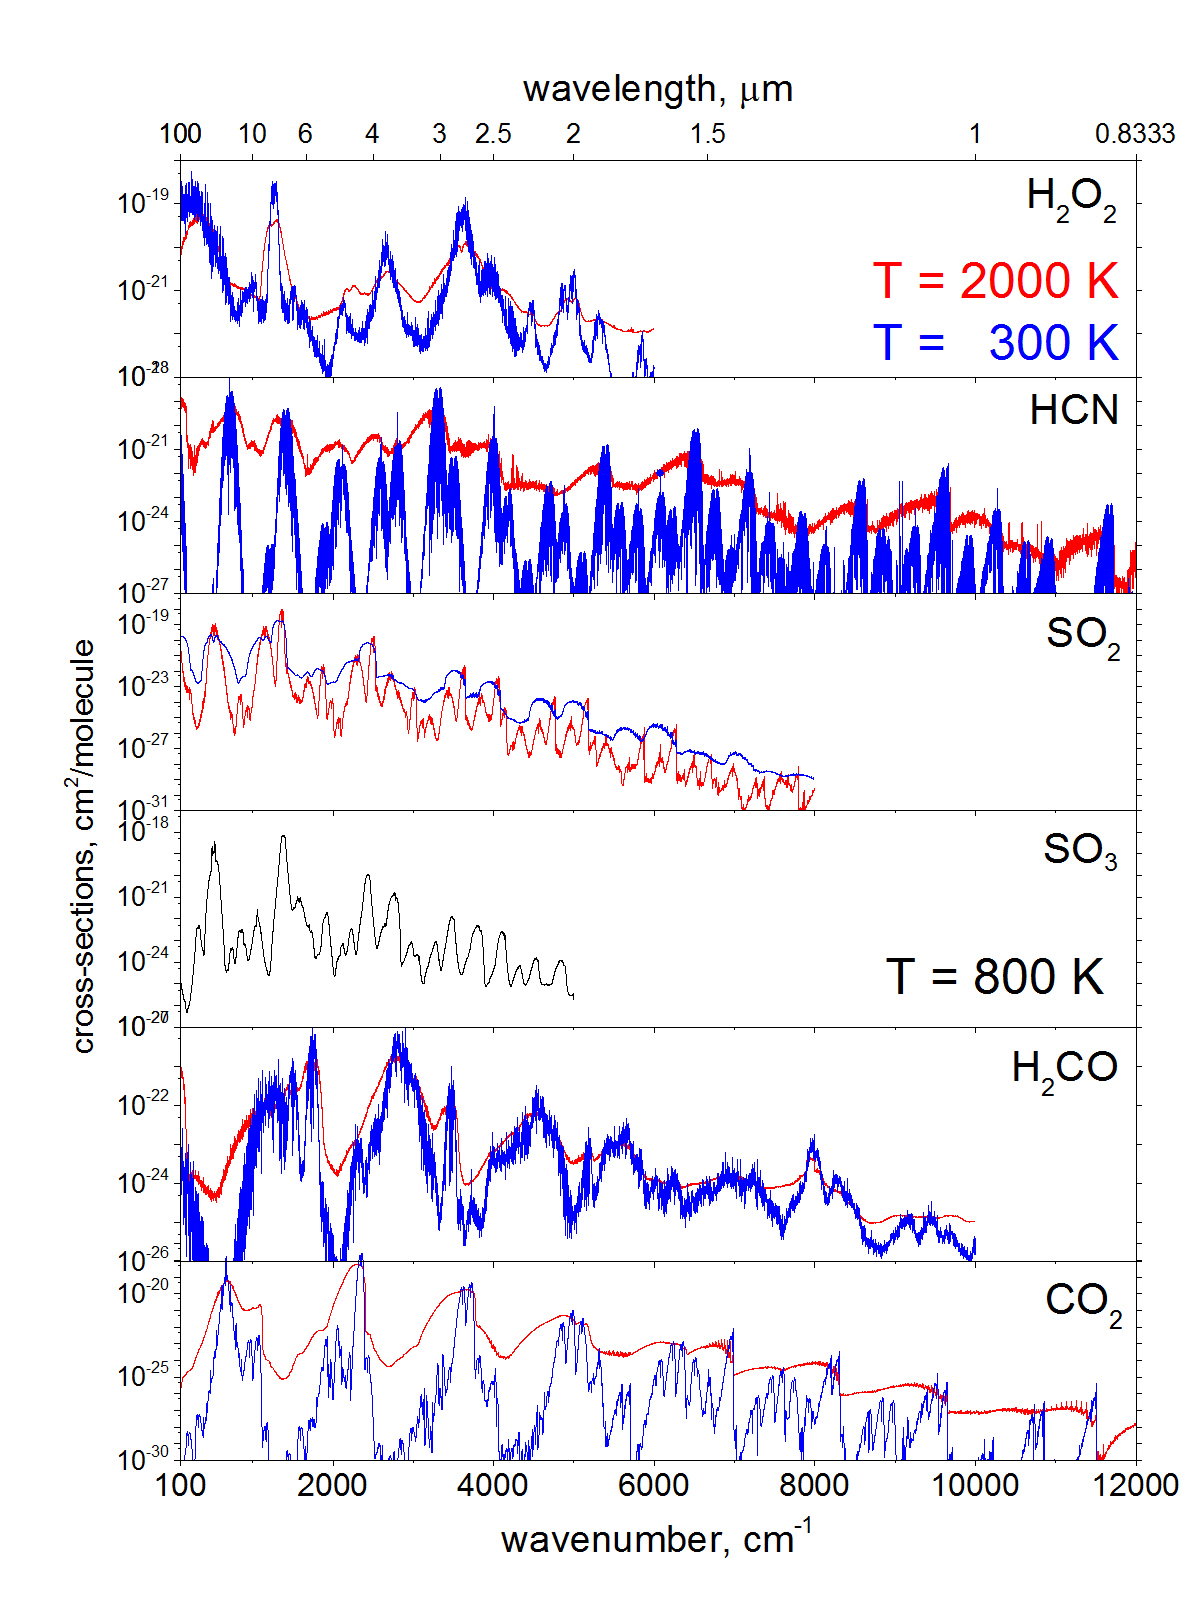
HCN: the line list shown in Figure 3 is unusual for two reasons. First, it contains transition sets for two isomers, HCN and HNC, which are often considered to be distinct molecules and second it is not new; rather it is a reworking of earlier line lists Harris et al. (2002, 2006) based on extensive compilations of empirical energy levels due to Mellau Mellau (2011a, b, 2011). A similar empirically-informed line list is available for H13CN Harris et al. (2008). The updated Harris line list was used to tentatively identify HCN in super-Earth exoplanet 55 Cancri e Tsiaras et al. (2016). However, the 1.54 m feature used for this detection is close to a similar acetylene feature. As discussed below, there is still no good line list for hot acetylene. The opacity of HCN is particularly important for reliable models of cool carbon stars where its inclusion leads to fundamental changes in the stellar structure Eriksson et al. (1984). The ratio between HCN and HNC can provide a potential thermometer the atmospheres of cool stars Barber et al. (2002).
SO2: sulphur dioxide cross sections are given in Figure 3. SO2 is thought to be an important component of oxygen-rich exoplanet atmospheres Kaltenegger et al. (2010); Hu et al. (2013) and to have been important in both early-Earth Whitehill et al. (2013) and early-Mars Johnson et al. (2009).
SO3: sulphur trioxide cross sections are given in Figure 3. SO3 can be hard to detect because it usually appears in conjunction with SO2, which absorbs strongly in the same region. Interestingly, our cross sections suggest that it may be easier to distinguish SO3 from SO2 at higher temperatures as, while the spectrum SO3 retains much of it structure at higher temperatures, the spectrum of SO2 becomes increasingly flattened. The line list is only complete up to 800 K and this has been used as the upper temperature.
H2CO: Figure 3 shows temperature dependent cross sections of formaldehyde.
CO2: carbon dioxide cross sections given in Figure 3 are obtained from the Ames-2016 (4000 K) line list of Huang et al. Huang et al. (2014, 2017), for the main isotopologue (12C16O2) and covers rotational excitations up to = 220. The line list is based on an empirical potential energy surface and accurate variational nuclear motion calculations. The Ames-2016 database also contains line lists for 12 other isotopologues of CO2.
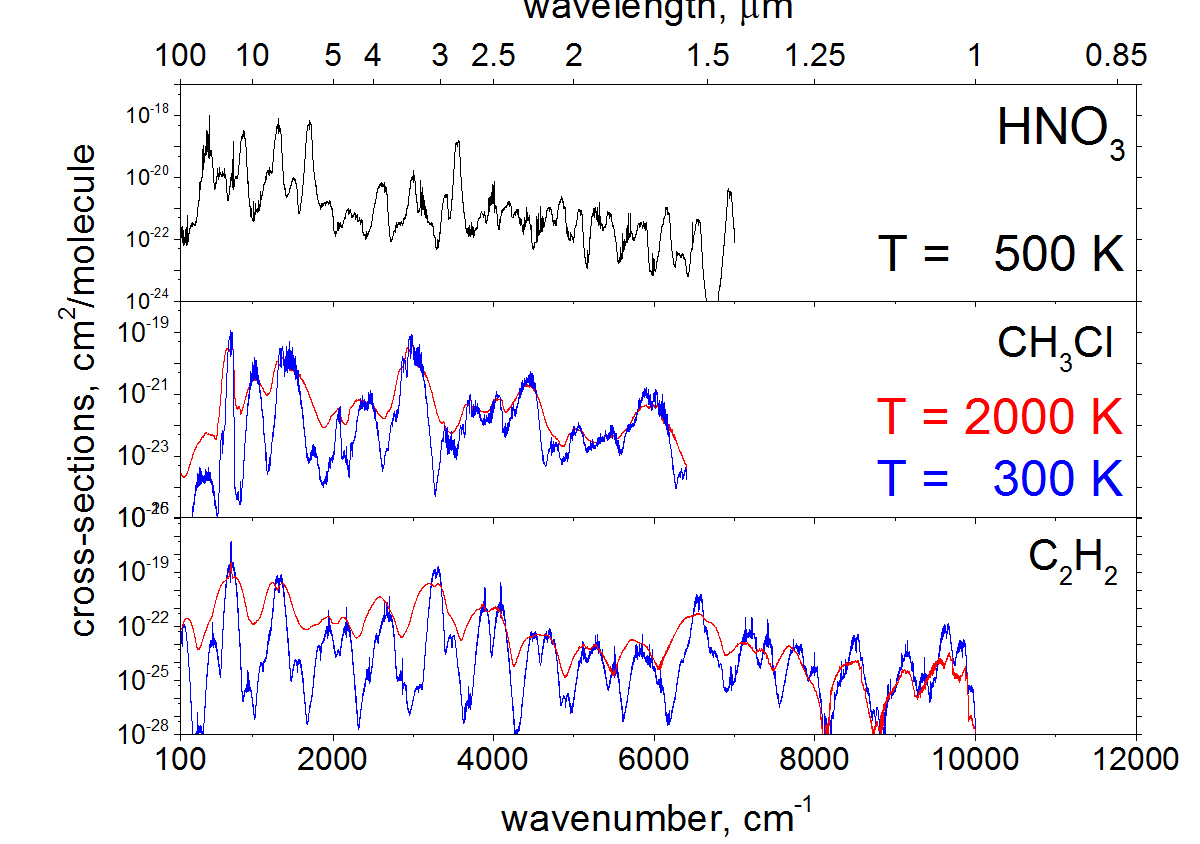
Figure 4 shows cross sections of HNO3, CH3Cl and C2H2.
HNO3: nitric acid, whose spectrum is shown in Figure 4, is not likely to be an important source of opacity. However, its spectroscopic signature can be clearly observed in the Earth’s atmosphere from space (Błęcka and De Mazière, 1997; Cooper et al., 2011; Schreier et al., 2018) and thus HNO3 could be a possible biomarker on exoplanets. Like H2O2, the HITRAN data for HNO3 is incomplete for frequencies above about 1000 cm-1.
CH3Cl: methyl chloride is also a potential biosignature in the search for life outside of the solar system Seager et al. (2013). ExoMol’s mew line list for methyl chloride covers the two major isomers, CHCl and CHCl.
C2H2: acetylene cross sections given in Figure 4 are generated using the ASD-1000 database Lyulin and Perevalov (2017). ASD-1000 was generated using an Effective Hamiltonian and contains about 34,000,000 lines. This would appear to be too few lines for the line list to be complete at elevated temperatures as normally, hot line lists for tetratomics contain billions of transitions in order to be complete for high temperatures. A variational acetylene line list is currently under construction as part of the ExoMol project.
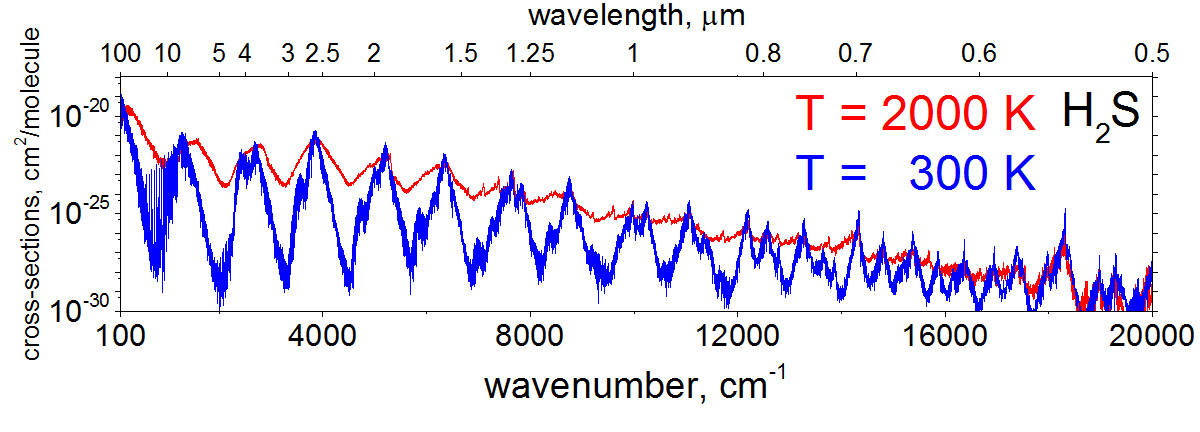
H2S: Figure 5 shows that hydrogen sulphide has a rather unusual spectrum. Transitions involving the vibrational fundamentals are anomalously weak Brown et al. (1998) for this system, which shifts the peak of the vibration–rotation spectrum to shorter wavelengths than is usual: the figure shows that the strongest vibration band is an overtone lying in the 2.5 m region.
Figure 6 gives cross sections for NS as well as the alkaline earth monohydrides MgH and CaH. Together with BeH, MgH and CaH were the first set of species considered by ExoMol. These ExoMol line lists only contain pure rotation and rotation–vibration transitions within the X electronic ground states for each of these species.
NS: NS is one of the first ten diatomic molecules to be detected in space (Somerville, 1977; Lovas et al., 1979).
MgH: the A –X band is also important for magnesium monohydride as, in particular, its use of major importance for establishing isotopic abundances of Mg in stars Tomkin and Lambert (1980); McWilliam and Lambert (1988); Gay and Lambert (2000); Yong et al. (2003); Hinkle et al. (2013). Weck et al. Weck et al. (2003) constructed a purely ab initio line list, which covers this band but is of limited accuracy. More recently, experimentally-driven studies GharibNezhad et al. (2013); Henderson et al. (2013) have sought to remedy this problem.
CaH: A –X band is also important in cool stars and brown dwarfs Reiners et al. (2007).
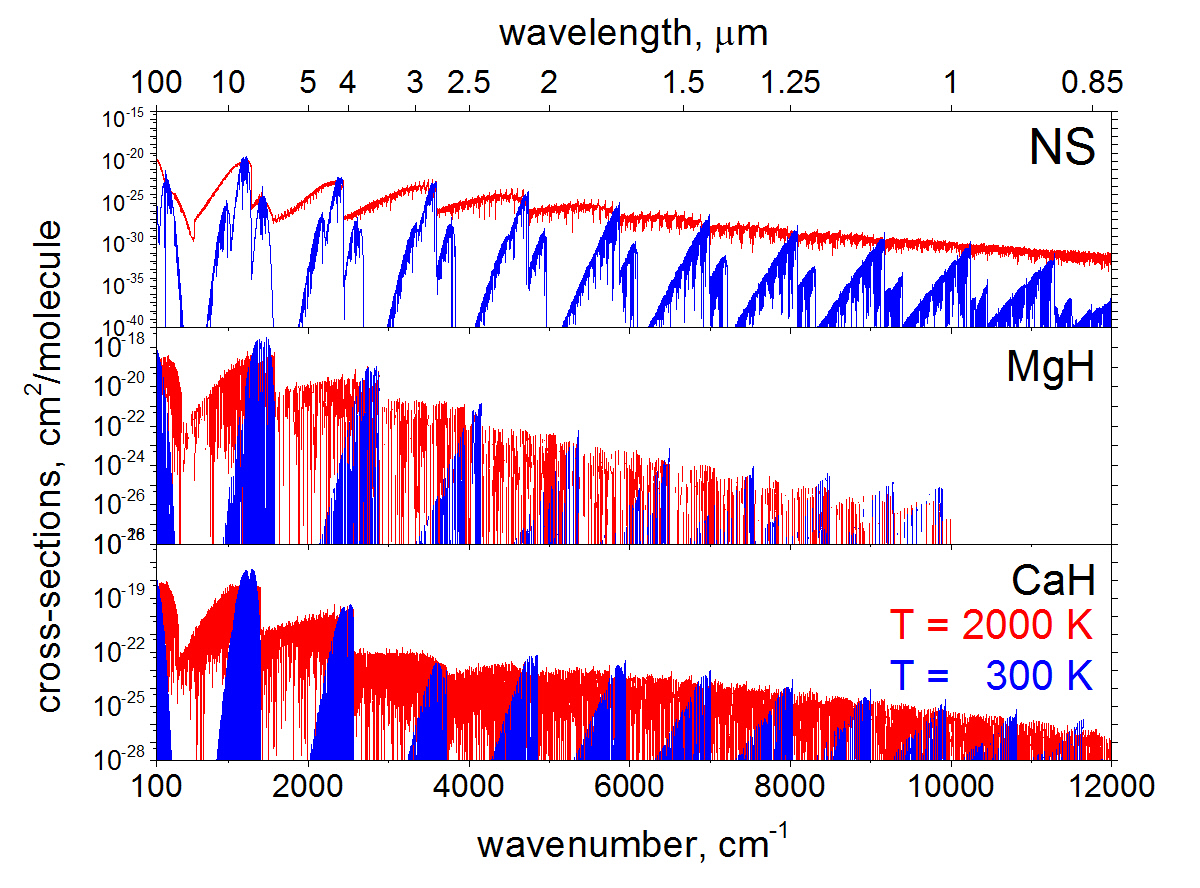
Figure 7 shows cross sections covering electronic spectra of three diatomic monohydrides, BeH, AlH and CH.
BeH: Darby-Lewis et al. Darby-Lewis et al. (2018) have recently developed a new model for beryllium monohydride, which both improves (marginally) on the earlier Yadin line list Yadin et al. (2012) and, more significantly, includes a treatment of the A –X band. This band has been observed in sunspot Shanmugavel et al. (2008), but the motivation for extending the line list was actually fusion plasmas where the use of Be walls has led to the observation of A–X emissions in the plasma Duxbury et al. (1998). Darby-Lewis et al. demonstrate that their new line list gives excellent reproduction of emission spectra of both BeH and BeD, as well as predictions for the spectrum of BeT, which is important for fusion studies.
AlH: it is known to be present in sunspots through lines in its A –X electronic band which lie in the blue (Wallace et al., 2000); AlH was also recently detected around Mira-variable o Ceti by Kaminski et al. Kaminski et al. (2016). The ExoMol line list for AlH contains these electronic transitions as well as ground state lines.
CH: an extensive, empirical line list is available for CH due to Masseron et al. Masseron et al. (2014). This line list covers transitions within the X electronic ground state as well as rovibronic transitions within the A –X , B –X and C –X bands. Masseron et al. Masseron et al. (2014) also provide a line list for 13CH.
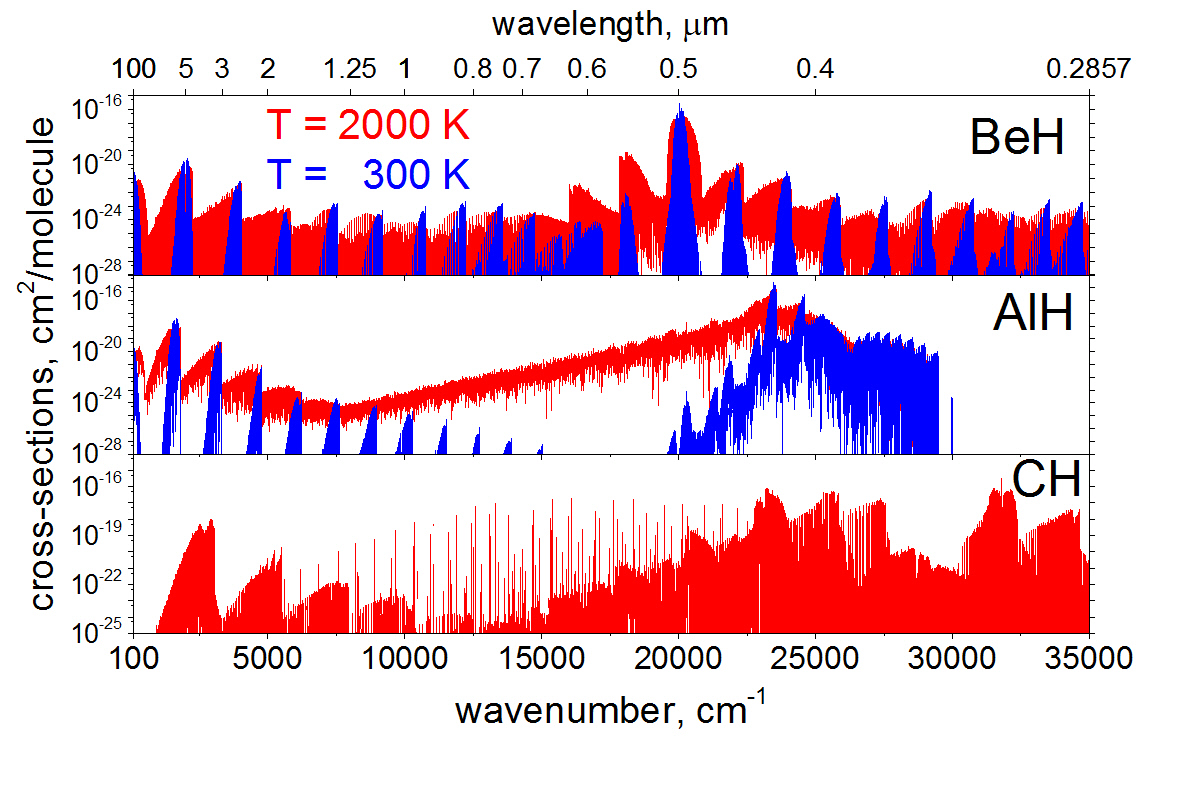
Figure 8 shows temperature dependent cross sections for HCl, HS, CrH, and OH.
HCl: the line list used to generate the HCl cross sections given in Figure 8 was generated alongside line lists for other hydrogen halides, namely HF, HBr and HI, using semi-empirical methods by Li. et al. Li et al. (2011, 2013).

Figure 9 shows cross sections for NaCl, KCl, PO, PN and CS.
NaCl and KCl: cross sections are shown in Figure 9. These species have large transition dipoles and hence strong transitions, and they are thought to be of importance for studies of hot super-Earths Tennyson and Yurchenko (2017).
PO: phosphorus monoxide has been detected in a number of locations in space: red Supergiant Star VY Canis Majoris Tenenbaum et al. (2007), in the wind of the oxygen-rich AGB star IK Tauri De Beck et al. (2013), and in star-forming regions Rivilla et al. (2016); Lefloch et al. (2016). The ExoMol line list covers transitions within the X ground electronic state.
PN: it is an important molecule used to probe different regions of the interstellar medium (ISM). The ExoMol line list for PN covers just pure rotation–vibration transitions.
CS: cross sections in Figure 9 illustrate the temperature dependence of the CS spectra as generated using the comprehensive vibration–rotation ExoMol line lists for eight isotopologues of carbon monosulphide (CS) (12C32S, 12C33S, 12C34S, 12C36S, 13C32S, 13C33S, 13C34S, 13C36S) in their ground electronic states.
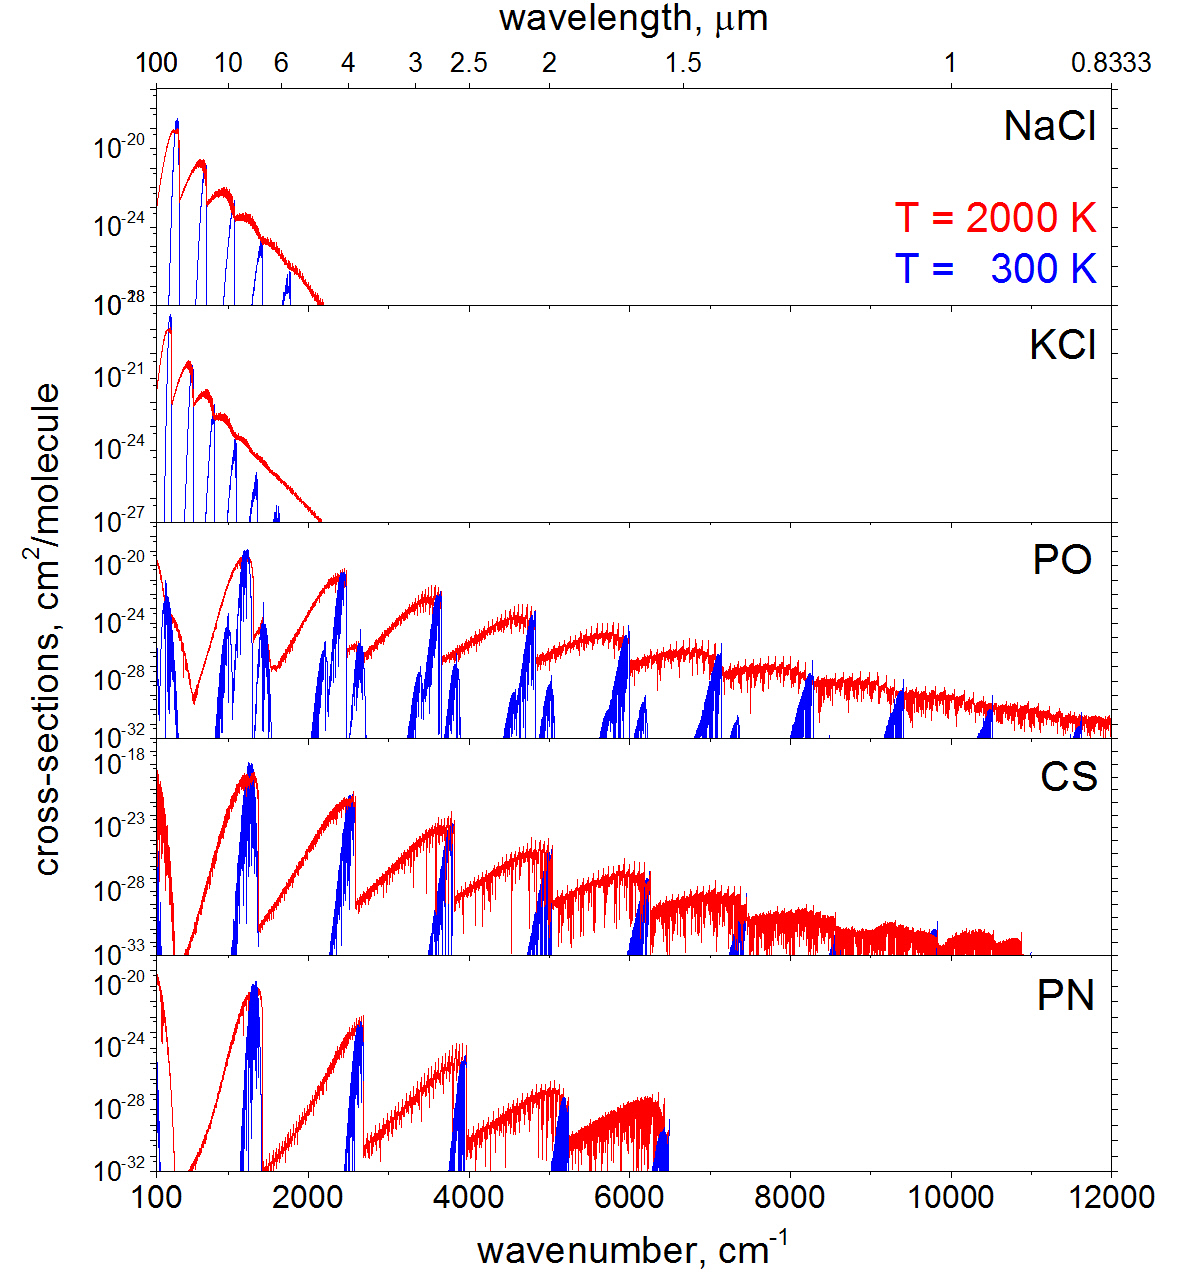
Figure 10 shows cross sections for the important species CO plus CN, CP and CaO.
CO: cross sections for carbon monoxide are given in Figure 10. CO is ubiquitous throughout the spectra of cool stars Jones et al. (2005) and brown dwarfs, and can clearly be seen in exoplanets de Kok et al. (2013); Brogi et al. (2014). CO is a very strongly bound species so the molecule survives at relatively high temperatures. As can be seen from the figure, its broadband spectrum changes from comprising a series of sharp bands to becoming quasi-continuous as the temperature is raised. Unlike the other species shown in this figure, the CO cross sections through the visible are simply given by rotation–vibration transitions. We note that Li. et al. Li et al. (2015) improved their intensities by refining their CO ab initio dipole moment curve by fitting to experiment. This is not the usual practice Tennyson (2014), but Li. et al. found that they could not get satisfactory results using a purely ab initio approach.
CN and CP: cross sections are shown in Figure 10. These two open shell or radical molecules have the same electronic structure and their spectra are dominated by the A –X and B –X bands, which for CN lie in the red and violet regions of the visible. For the heavier CP radical, these bands are shifted to longer wavelengths.
CaO: cross sections for calcium oxide are given in Figure 10. CaO is unlikely to exist in the gas phase in dense atmospheres at 300 K, this spectrum is shown for the consistency. CaO has yet to be detected in space, but it is thought of as a possible component of super-Earth exoplanet atmospheres. CaO possesses transitions with notably large cross sections, which should facilitate its detection.
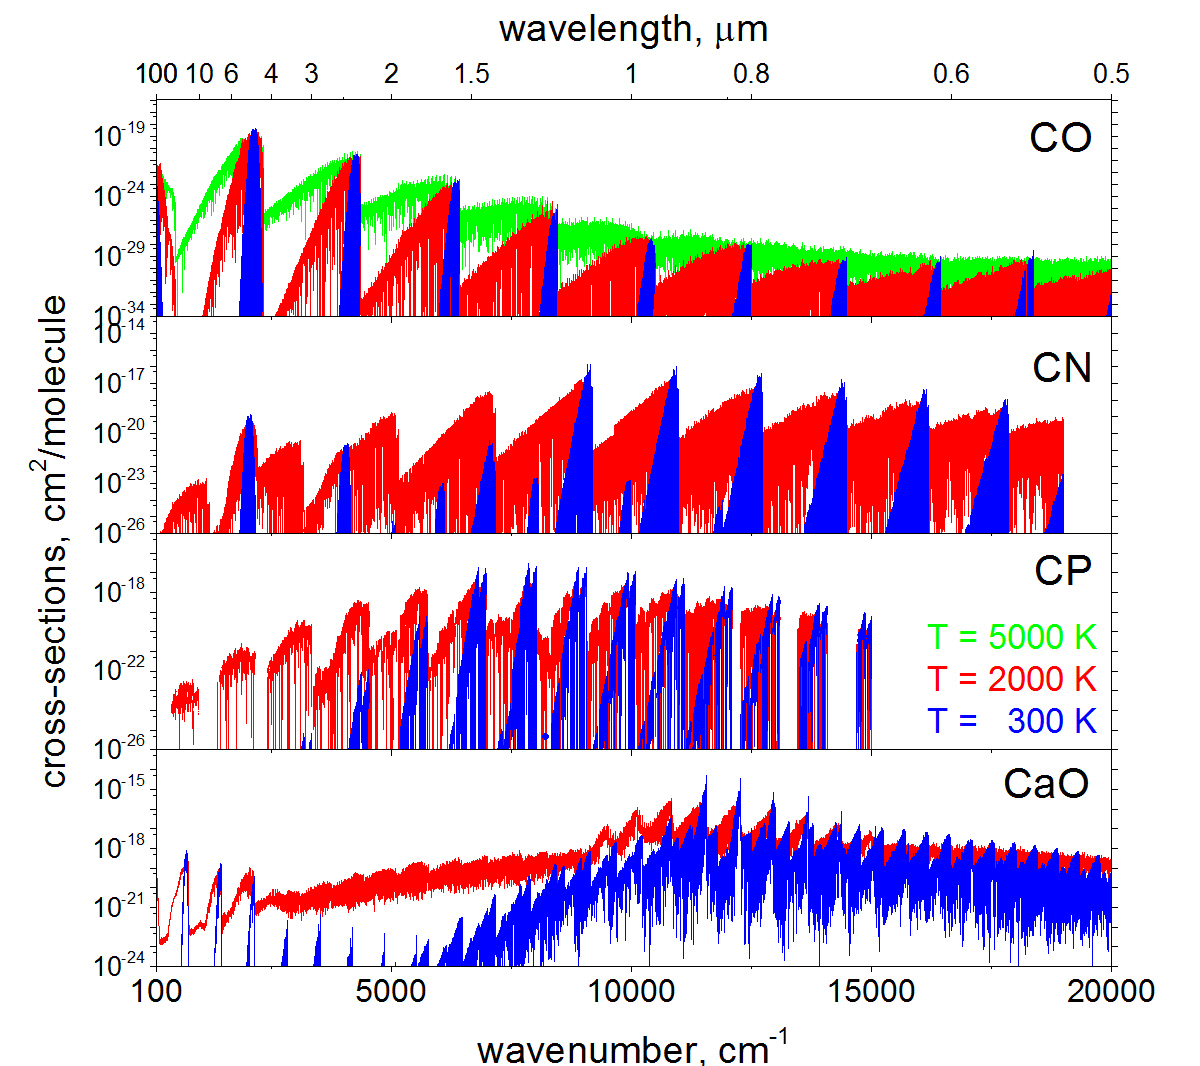
Figure 11 shows cross sections for NO and PS.
NO and PS: are both radicals with X electronic ground states. NO is an important species in the Earth’s atmosphere and is likely to be so in oxygen-rich exoplanets. The current ExoMol line list Wong et al. (2017) supersedes the one provided by HITEMP Rothman et al. (2010). For NO, the transitions considered in the figure are all within the X ground state manifold, while, for PS, the B –X electronic band is also considered. The equivalent electronic transition for NO, which is actually designated the A – X band, lies well into the ultra violet at about 230 nm Danielak et al. (1997).
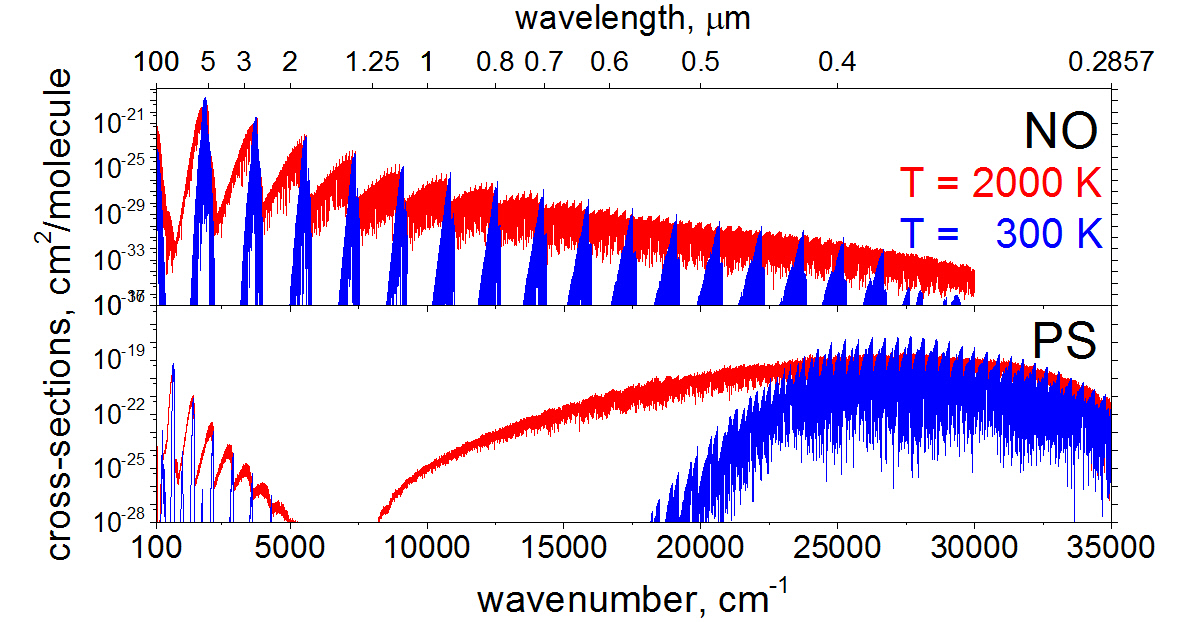
Figure 12 shows cross sections for LiH, ScH, FeH and NH.
LiH cross sections are shown in Figure 12. They are based on ab initio calculations by Coppola et al. Coppola et al. (2011). LiH is a four electron system so purely theoretical procedures should give reliable results. The spectrum of LiH is important for possible applications of the lithium test in brown dwarfs Pavlenko (1997). We note that very recently Bittner and Bernath Bittner and Bernath (2018) have constructed line lists for both LiF and LiCl.
ScH cross sections are shown in Figure 12. These were also based on an essentially ab initio line list, which contains an empirical adjustment for the band positions. Unlike LiH, ScH is a many-electron system with an open -shell; such systems present considerable challenges from an ab initio perspective McKemmish et al. (2016); Tennyson et al. (2016); the provision of high accuracy line list for ScH will probably require further experimental input.
FeH cross sections, shown in Figure 12, are conversely based on experimental studies. FeH is an important stellar species, which has been observed in M and L dwarfs Cushing et al. (2003); Wende et al. (2010); Hargreaves et al. (2010) as well as sunspots Wallace and Hinkle (2001); Ramos et al. (2004); Harrison and Brown (2008). There is a strong need to use these laboratory studies to construct a rigorous theoretical model for the system, which can be used to generate line lists over an extended range of temperatures and wavelengths; however, ab initio calculations on the system remain a challenge DeYonker and Allen (2012).
NH: an empirical line list for NH from the Bernath group Brooke et al. (2014) covering rotation–vibrational transitions within the X ground electronic state.
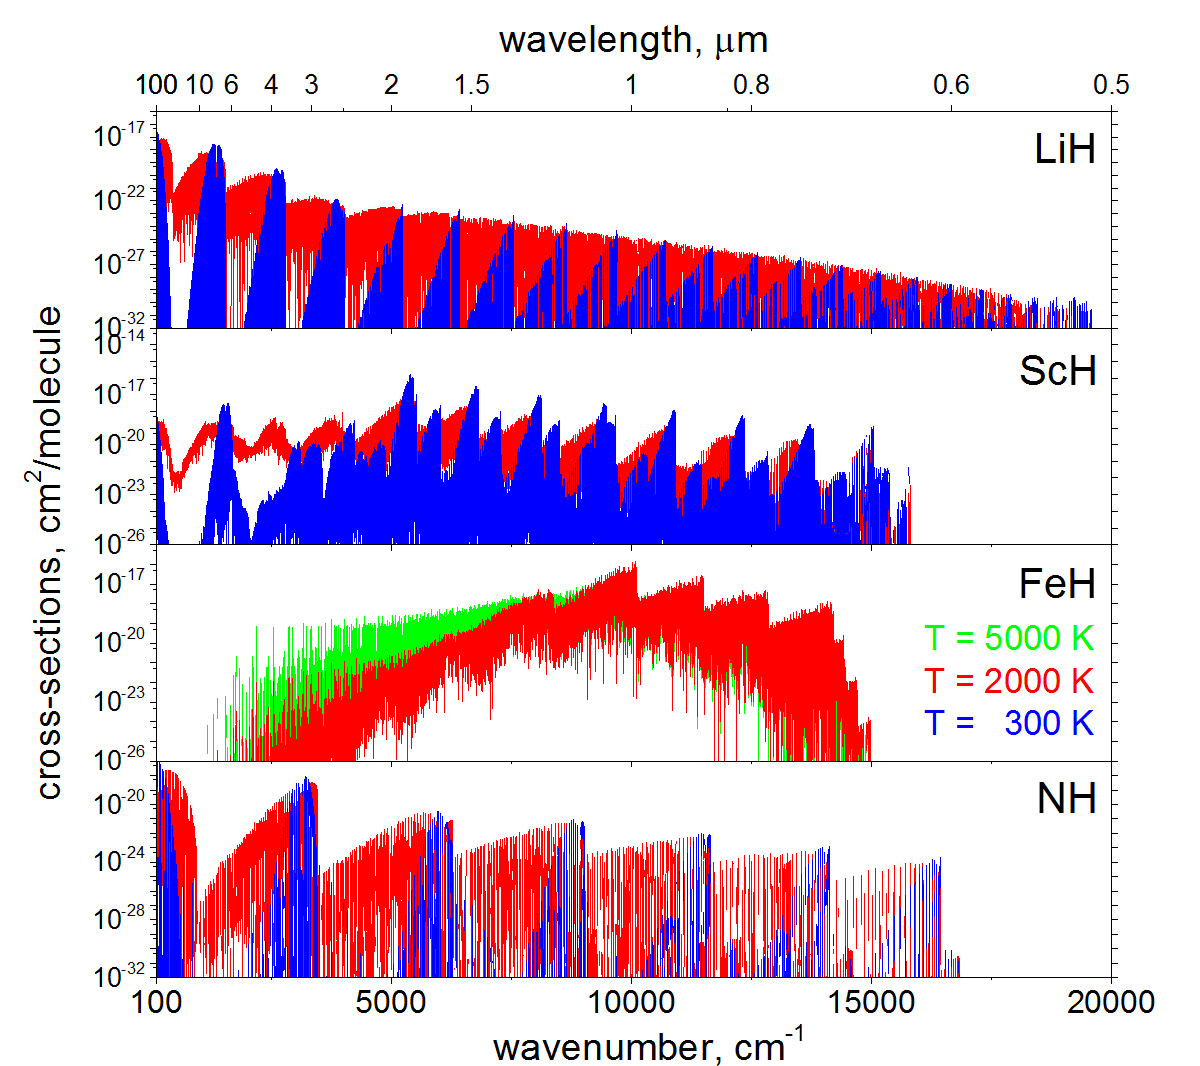
Figure 13 shows cross sections for SiH, NaH and TiH.
SiH: is an accurate line list covering rotation–vibration transitions within the ground X electronic state as well as transitions to the low-lying A and a states.
NaH cross sections are shown in Figure 13. NaH remains undetected in stellar spectra but is thought to be an important opacity source in M-dwarfs Rajpurohit et al. (2013). However, as our cross sections show the blue A –X band is extended and gives a rather flat band shape. This will make the clear detection of NaH in a stellar atmosphere difficult from its main electronic band.
TiH cross sections shown in Figure 13 represent an empirical line list for TiH from Burrows et al. Burrows et al. (2005).
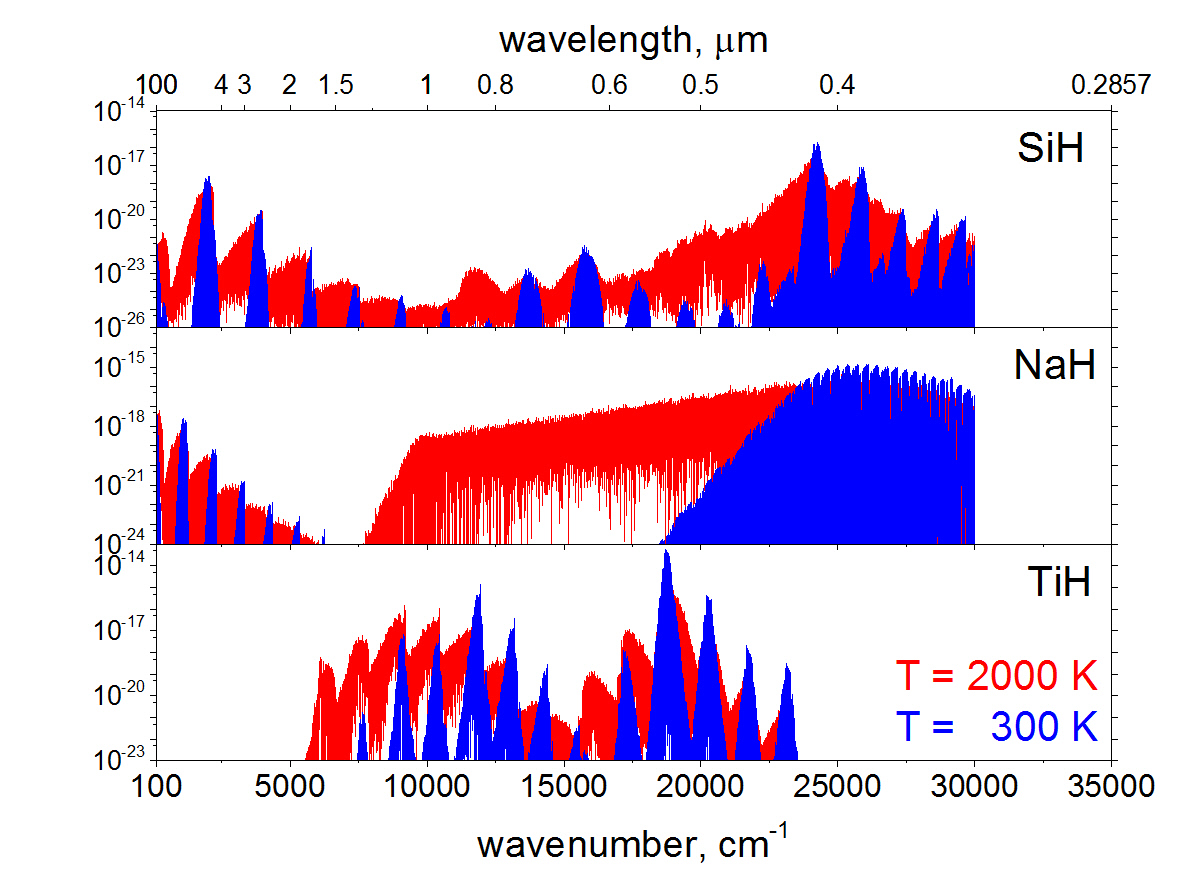
Figure 13 shows cross sections for SiO, AlO, VO and TiO.
SiO cross sections are shown in Figure 14. SiO is a strongly bound molecule whose infrared spectrum is well-known in stars Ardila et al. (2010) and sunspots Campbell et al. (1995); Wallace and Hinkle (2002). Its electronic spectrum has also been observed in sunspots Joshi et al. (1979). At present, the ExoMol project has only provided a long-wavelength line list for SiO based on its temperature-dependent vibration–rotation and rotation spectrum. Work is in progress providing a companion line list covering its electronic bands starting from ab initio potential energy curves recently calculated by Bauschlicher Jr. et al. Bauschlicher Jr. (2016). In order to illustrate the UV spectra of SiO, Figure 14 also shows cross sections from Kurucz’z database Kurucz (2011).
AlO: the spectrum of aluminium monoxide is illustrated in Figure 14. This spectrum is actually important for plasma diagnostics Bai et al. (2014); Surmick and Parigger (2014). Rather remarkably, the only previous AlO line list Parigger and Hornkohl (2011), which was prepared for plasma studies, only provided relative as opposed to absolute line intensities.
VO cross sections are shown in Figure 14. The VO spectrum is heavily overlapped by that of TiO and the two molecules often occur together. VO spectral signatures are important for classifying late M dwarfs Kirkpatrick et al. (1993); McGovern et al. (2004), and it is one of the dominant species in the spectra of young hot brown dwarfs McGovern et al. (2004); Kirkpatrick et al. (2006); Peterson et al. (2008). VO is thought to be present in the atmosphere of hot Jupiter exoplanets Desert et al. (2008).
TiO cross sections are shown in Figure 14. TiO is a well-known and important molecule in the atmosphere of M-dwarf stars Allard et al. (2000). Detections in the atmospheres of exoplanets are also beginning to be reported Sedaghati et al. (2017); Nugroho et al. (2017); Tsiaras et al. (2018). The figure is based on the line list of Schwenke et al. Schwenke (1998); there is also a line list due to Plez Plez (1998), which has been updated in a recent release of the VALD database Ryabchikova et al. (2015). However, there are known problems with the available spectroscopic data on TiO (see Hoeijmakers et al. Hoeijmakers et al. (2015), for example). An ExoMol TiO line list is currently nearing completion McKemmish et al. (2018); this line list will make use of the MARVEL study on TiO McKemmish et al. (2017), which leads to more accurate transition frequencies than are provided by the currently available line lists.
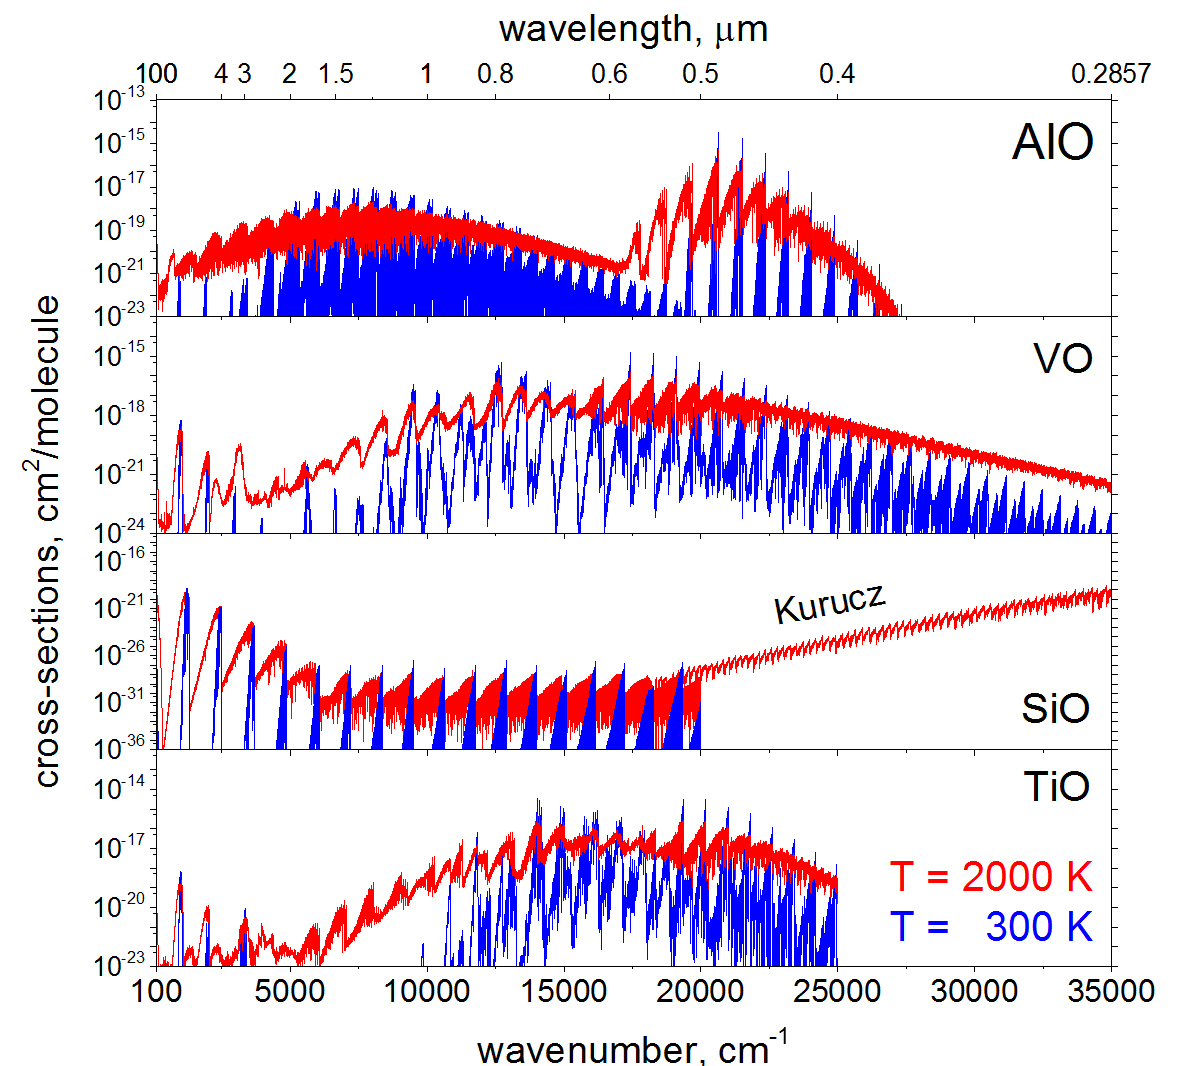
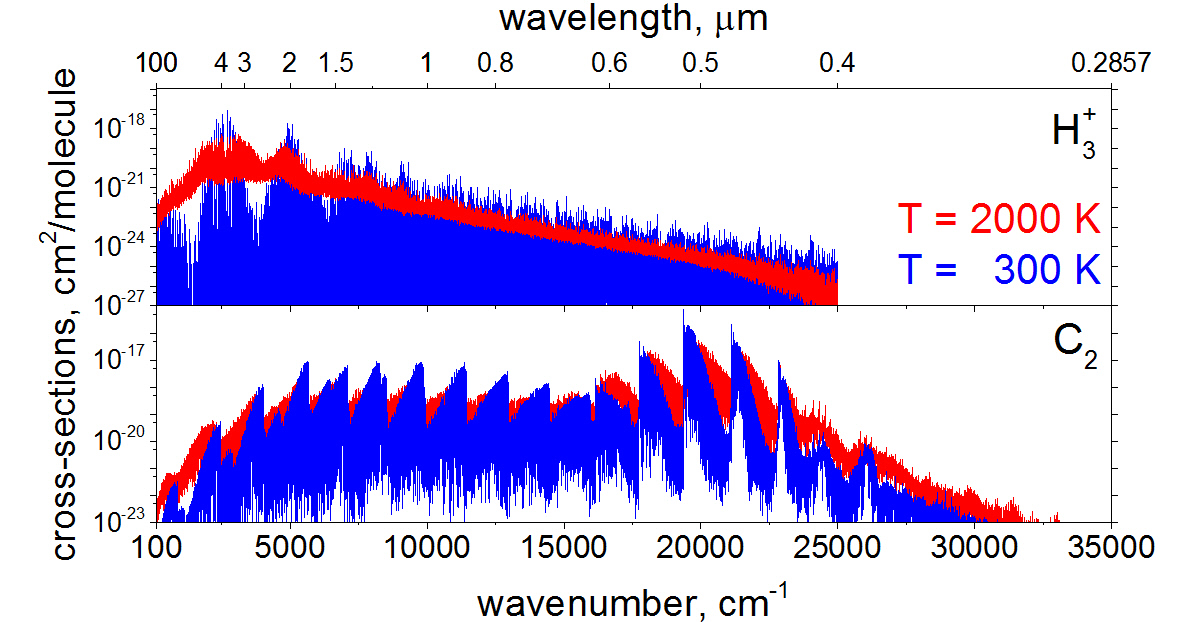
Figure 15 gives cross sections for the open shell diatomic species C2 and of the important molecular ion H.
C2 has a long spectroscopic history Wollaston (1802); Swan (1857). In astronomical objects, its spectrum has been observed via at least six distinct electronic bands, with other band systems required to explain observed populations. An empirical line list for the Swan system was provided by Brooke et al. Brooke et al. (2013); the figure shows cross sections generated using the newly constructed ExoMol line list Yurchenko et al. (2018b), which considers transitions between the eight lowest electronic states in the system. Given the many perturbations between the electronic states that are hard to model and that there are astronomically observed bands not covered by this eight-state model, further work on C2 will undoubtedly be needed.
H: the spectrum of H given in Figure 15 is based on ab initio calculations, which have proved themselves to be very accurate for this molecular ion Pavanello et al. (2012). H is an unusual species in that it has no (allowed Miller and Tennyson (1988)) rotational spectrum and no known electronic spectrum leaving only rotation–vibration transitions. These are well-known in the ionospheres of solar system gas giant planets Miller et al. (2000) but have yet to be observed in hot Jupiter exoplanets Shkolnik et al. (2006), where they might be thought to be prominent. However, the cooling provided by H infrared emissions appears to be the key for the stability of atmospheres of giant extrasolar planets close to their host star Koskinen et al. (2007). This has made H cooling functions of great importance Miller et al. (2010, 2013). Similarly H has yet to observed in stellar or brown dwarf spectra, but H is the main source of electrons in objects such as cool white dwarfs Bergeron et al. (1997). The partition function of H Neale and Tennyson (1995) thus controls the amount of H- present, which, in turn, dominates the opacity. A line list for H2D+ Sochi and Tennyson (2010) is also available.
4 Conclusions
Compiling molecular opacity functions requires a large range of spectroscopic data on a large range of molecules. As discussed in this article, for many key species, there are now extensive line lists available that can be used to compute temperature-dependent opacity functions. This is a process of constant improvement and immediate improvements are indeed identified for several species discussed above. Here, we consider what species may be missing from the current compilations.
In their validation of the well-used BT–Settl model Allard (2014) atmospheres for M-dwarfs, Rajpurohit et al. Rajpurohit et al. (2013) identified only AlH, NaH and CaOH as key species for which data was missing. In response to this, the ExoMol project has provided spectroscopic line lists for AlH Yurchenko et al. (2018a) and NaH Rivlin et al. (2015); this leaves CaOH, which has a strong band in the visible at 557 nm, as the one key missing species.
The chemistry of oxygen-rich M-dwarf stars is somewhat simpler than that of carbon-rich stars. There are a number of carbon-containing species for which reliable line lists are not available, notably acetylene (HCCH) and C3. Acetylene spectra are well-studied experimentally Chubb et al. (2018); Herman et al. (2003); Herman (2007) and recently Lyulin and Perevalov Lyulin and Perevalov (2017) produced an effective-Hamiltonian based, empirical 12C2H2 line list. Work on an ExoMol acetylene line list is nearing completion. Jørgensen et al. Jørgensen et al. (1989) produced an early, purely ab initio line list for C3. They demonstrated the importance of this species for models of cool carbon stars, but their line list cannot be considered reliable by modern standards where ab initio methods have improved considerably and tuning models to experimental data is now routine. The construction of an improved C3 line list is underway as part of the ExoMol project. Both ExoMol and TheoReTS are considering line lists for higher hydrocarbons that are needed for studies of exoplanets.
Transition metal containing diatomics provide strong sources of opacities since these open shell species often display strong electronic transitions in the near infrared and visible i.e., near the peak of the stellar flux for a cool star. A few of these species, notably TiO, VO, FeH, ScH and TiH, are considered above but there are many more possible candidates. These include CrH Gorman et al. (2018a), MnH Gorman et al. (2018b) and MgO Li et al. (2018) for which ExoMol has near complete line lists, and species such NiH, ZrO, YO, FeO. Carbides, nitrides and even sulfide species may also need to be considered in due course. Performing accurate ab initio electronic structure calculation on transition metal containing molecules remains very difficult McKemmish et al. (2016); Tennyson et al. (2016).
Recent observations have identified a whole new class of exoplanets with masses somewhat larger than the Earth’s and orbits close to their host stars. These hot rocky super-Earths, lava planets or magma planets as they are variously known as are just beginning to be characterized Tsiaras et al. (2016). Even though at this point the molecular composition of their atmosphere is essentially unknown, study of these bodies will create demands for spectroscopic data and opacities for a whole range of new molecules. We recently reviewed the data needs for hot super-Earth exoplanets Tennyson and Yurchenko (2017) and refer any interested reader to that article.
Finally, line broadening must be mentioned. Molecular transitions undergo broadening due to temperature and pressure effects. While temperature-induced Doppler broadening is straightforward to model, pressure broadening is more difficult because its importance is, at least in principle, different for every transition. Broadening parameters for key collision broadeners such as H2 and He at elevated temperatures are largely missing. Approximate methods are being used to fill this void for key molecules such as water Faure et al. (2013); Tsiaras et al. (2018); Renaud et al. (2018). We have implemented a systematic and complete if approximate broadening “diet” Barton et al. (2017) as part of the ExoMol data base Tennyson et al. (2016). This allows the generation of both temperature- and pressure-dependent cross sections using our program ExoCross Yurchenko et al. (2018). However, there remains much work to be done in both improving temperature-dependent models for line broadening and providing the appropriate broadening parameters.
Acknowledgements.
We thank the members of the ExoMol team for their work on this project. The ExoMol project was funded by the ERC Advanced Investigator Project 267219 and is currently supported by UK STFC under grant ST/M001334/1. \authorcontributionsBoth authors contributed equally. \conflictsofinterestThe authors declare no conflict of interest. \reftitleReferencesReferences
- Sharp and Burrows (2007) Sharp, C.M.; Burrows, A. Atomic and Molecular Opacities for Brown Dwarf and Giant Planet Atmospheres. Astrophys. J. Suppl. 2007, 168, 140.
- Gordon et al. (2017) Gordon, I.E.; Rothman, L.S.; Hill, C.; Kochanov, R.V.; Tan, Y.; Bernath, P.F.; Birk, M.; Boudon, V.; Campargue, A.; Chance, K.V.; et al. The HITRAN 2016 molecular spectroscopic database. J. Quant. Spectrosc. Radiat. Transf. 2017, 203, 3–69.
- Schreier et al. (2018) Schreier, F.; Staedt, S.; Hedelt, P.; Godolt, M. Transmission Spectroscopy with the ACE-FTS Infrared Spectral Atlas of Earth: A Model Validation and Feasibility Study. Mol. Astrophys. 2018, 11, 1–22.
- Rothman et al. (2010) Rothman, L.S.; Gordon, I.E.; Barber, R.J.; Dothe, H.; Gamache, R.R.; Goldman, A.; Perevalov, V.I.; Tashkun, S.A.; Tennyson, J. HITEMP, the High-Temperature Molecular Spectroscopic Database. J. Quant. Spectrosc. Radiat. Transf. 2010, 111, 2139–2150.
- Polyansky et al. (2018) Polyansky, O.L.; Kyuberis, A.A.; Zobov, N.F.; Tennyson, J.; Yurchenko, S.N.; Lodi, L. ExoMol molecular line lists XXX: A complete high-accuracy line list for water. Mon. Not. R. Astron. Soc. 2018, in press.
- Tashkun and Perevalov (2011) Tashkun, S.A.; Perevalov, V.I. CDSD-4000: High-resolution, high-temperature carbon dioxide spectroscopic databank. J. Quant. Spectrosc. Radiat. Transf. 2011, 112, 1403–1410.
- Huang et al. (2017) Huang, X.; Schwenke, D.W.; Freedman, R.S.; Lee, T.J. Ames-2016 Line Lists for 13 Isotopologues of CO2: Updates, Consistency, and Remaining Issues. J. Quant. Spectrosc. Radiat. Transf. 2017, 203, 224–241.
- Li et al. (2015) Li, G.; Gordon, I.E.; Rothman, L.S.; Tan, Y.; Hu, S.M.; Kassi, S.; Campargue, A.; Medvedev, E.S. Rovibrational line lists for nine isotopologues of the CO molecule in the X ground electronic state. Astrophys. J. Suppl. 2015, 216, 15.
- Wong et al. (2017) Wong, A.; Yurchenko, S.N.; Bernath, P.; Mueller, H.S.P.; McConkey, S.; Tennyson, J. ExoMol Line List XXI: Nitric Oxide (NO). Mon. Not. R. Astron. Soc. 2017, 470, 882–897.
- Brooke et al. (2016) Brooke, J.S.A.; Bernath, P.F.; Western, C.M.; Sneden, C.; Afşar, M.; Li, G.; Gordon, I.E. Line strengths of rovibrational and rotational transitions in the ground state of {OH}. J. Quant. Spectrosc. Radiat. Transf. 2016, 138, 142–157.
- Jørgensen et al. (1996) Jørgensen, U.G.; Larsson, M.; Iwamae, A.; Yu, B. Line intensities for CH and their application to stellar atmospheres. Astron. Astrophys. 1996, 315, 204.
- Plez (1998) Plez, B. A new TiO line list. Astron. Astrophys. 1998, 337, 495–500.
- Weck et al. (2003) Weck, P.F.; Schweitzer, A.; Stancil, P.C.; Hauschildt, P.H.; Kirby, K. The molecular line opacity of MgH in cool stellar atmospheres. Astrophys. J. 2003, 582, 1059–1065.
- Bernath (2009) Bernath, P.F. Molecular astronomy of cool stars and sub-stellar objects. Int. Rev. Phys. Chem. 2009, 28, 681–709.
- Tennyson and Yurchenko (2012) Tennyson, J.; Yurchenko, S.N. ExoMol: Molecular line lists for exoplanet and other atmospheres. Mon. Not. R. Astron. Soc. 2012, 425, 21–33.
- Rey et al. (2016) Rey, M.; Nikitin, A.V.; Babikov, Y.L.; Tyuterev, V.G. TheoReTS – An information system for theoretical spectra based on variational predictions from molecular potential energy and dipole moment surfaces. J. Mol. Spectrosc. 2016, 327, 138–158.
- Tinetti et al. (2007) Tinetti, G.; Vidal-Madjar, A.; Liang, M.C.; Beaulieu, J.P.; Yung, Y.; Carey, S.; Barber, R.J.; Tennyson, J.; Ribas, I.; Allard, N.; Ballester, G.E.; Sing, D.K.; Selsis, F. Water vapour in the atmosphere of a transiting extrasolar planet. Nature 2007, 448, 169–171.
- Tinetti et al. (2013) Tinetti, G.; Encrenaz, T.; Coustenis, A. Spectroscopy of planetary atmospheres in our Galaxy. Astron. Astrophys. Rev. 2013, 21, 1–65.
- Tennyson (2012) Tennyson, J. Accurate variational calculations for line lists to model the vibration rotation spectra of hot astrophysical atmospheres. WIREs Comput. Mol. Sci. 2012, 2, 698–715.
- Tennyson and Yurchenko (2017) Tennyson, J.; Yurchenko, S.N. Laboratory spectra of hot molecules: Data needs for hot super-Earth exoplanets. Mol. Astrophys. 2017, 8, 1–18.
- Yurchenko et al. (2016) Yurchenko, S.N.; Lodi, L.; Tennyson, J.; Stolyarov, A.V. Duo: A general program for calculating spectra of diatomic molecules. Comput. Phys. Commun. 2016, 202, 262–275.
- Tennyson et al. (2004) Tennyson, J.; Kostin, M.A.; Barletta, P.; Harris, G.J.; Polyansky, O.L.; Ramanlal, J.; Zobov, N.F. DVR3D: A program suite for the calculation of rotation–vibration spectra of triatomic molecules. Comput. Phys. Commun. 2004, 163, 85–116.
- Yurchenko et al. (2007) Yurchenko, S.N.; Thiel, W.; Jensen, P. Theoretical ROVibrational Energies (TROVE): A robust numerical approach to the calculation of rovibrational energies for polyatomic molecules. J. Mol. Spectrosc. 2007, 245, 126–140.
- Tennyson and Yurchenko (2017) Tennyson, J.; Yurchenko, S.N. The ExoMol project: Software for computing molecular line lists. Intern. J. Quantum Chem. 2017, 117, 92–103.
- Yurchenko et al. (2014) Yurchenko, S.N.; Tennyson, J.; Bailey, J.; Hollis, M.D.J.; Tinetti, G. Spectrum of hot methane in astronomical objects using a comprehensive computed line list. Proc. Nat. Acad. Sci. USA 2014, 111, 9379–9383.
- Hoeijmakers et al. (2015) Hoeijmakers, H.J.; de Kok, R.J.; Snellen, I.A.G.; Brogi, M.; Birkby, J.L.; Schwarz, H. A search for TiO in the optical high-resolution transmission spectrum of HD 209458b: Hindrance due to inaccuracies in the line database. Astron. Astrophys. 2015, 575, A20.
- Partridge and Schwenke (1997) Partridge, H.; Schwenke, D.W. The determination of an accurate isotope dependent potential energy surface for water from extensive ab initio calculations and experimental data. J. Chem. Phys. 1997, 106, 4618–4639.
- Yurchenko et al. (2011) Yurchenko, S.N.; Barber, R.J.; Tennyson, J.; Thiel, W.; Jensen, P. Towards efficient refinement of molecular potential energy surfaces: Ammonia as a case study. J. Mol. Spectrosc. 2011, 268, 123–129.
- Tennyson et al. (2013) Tennyson, J.; Hill, C.; Yurchenko, S.N. Data structures for ExoMol: Molecular line lists for exoplanet and other atmospheres. AIP Conf. Proc. 2013, 1545, 186–195.
- Barber et al. (2014) Barber, R.J.; Strange, J.K.; Hill, C.; Polyansky, O.L.; Mellau, G.C.; Yurchenko, S.N.; Tennyson, J. ExoMol line lists—III. An improved hot rotation–vibration line list for HCN and HNC. Mon. Not. R. Astron. Soc. 2014, 437, 1828–1835.
- Furtenbacher et al. (2007) Furtenbacher, T.; Császár, A.G.; Tennyson, J. MARVEL: Measured active rotational-vibrational energy levels. J. Mol. Spectrosc. 2007, 245, 115–125.
- Furtenbacher and Császár (2012) Furtenbacher, T.; Császár, A.G. MARVEL: Measured active rotational-vibrational energy levels. II. Algorithmic improvements. J. Quant. Spectrosc. Radiat. Transf. 2012, 113, 929–935.
- Császár et al. (2007) Császár, A.G.; Czakó, G.; Furtenbacher, T.; Mátyus, E. An active database approach to complete rotational–vibrational spectra of small molecules. Annu. Rep. Comput. Chem. 2007, 3, 155–176.
- Tennyson et al. (2014) Tennyson, J.; Bernath, P.F.; Brown, L.R.; Campargue, A.; Császár, A.G.; Daumont, L.; Gamache, R.R.; Hodges, J.T.; Naumenko, O.V.; Polyansky, O.L.; et al. A Database of Water Transitions from Experiment and Theory (IUPAC Technical Report). Pure Appl. Chem. 2014, 86, 71–83.
- Tennyson et al. (2009) Tennyson, J.; Bernath, P.F.; Brown, L.R.; Campargue, A.; Carleer, M.R.; Császár, A.G.; Gamache, R.R.; Hodges, J.T.; Jenouvrier, A.; Naumenko, O.V.; et al. IUPAC critical Evaluation of the Rotational-Vibrational Spectra of Water Vapor. Part I. Energy Levels and Transition Wavenumbers for H217O and H218O. J. Quant. Spectrosc. Radiat. Transf. 2009, 110, 573–596.
- Tennyson et al. (2010) Tennyson, J.; Bernath, P.F.; Brown, L.R.; Campargue, A.; Carleer, M.R.; Császár, A.G.; Daumont, L.; Gamache, R.R.; Hodges, J.T.; Naumenko, O.V.; et al. IUPAC critical Evaluation of the Rotational-Vibrational Spectra of Water Vapor. Part II. Energy Levels and Transition Wavenumbers for HD16O, HD17O, and HD18O. J. Quant. Spectrosc. Radiat. Transf. 2010, 111, 2160–2184.
- Tennyson et al. (2013) Tennyson, J.; Bernath, P.F.; Brown, L.R.; Campargue, A.; Carleer, M.R.; Császár, A.G.; Daumont, L.; Gamache, R.R.; Hodges, J.T.; Naumenko, O.V.; et al. IUPAC critical evaluation of the rotational-vibrational spectra of water vapor. Part III. Energy levels and transition wavenumbers for H216O. J. Quant. Spectrosc. Radiat. Transf. 2013, 117, 29–80.
- Tennyson et al. (2014) Tennyson, J.; Bernath, P.F.; Brown, L.R.; Campargue, A.; Császár, A.G.; Daumont, L.; Gamache, R.R.; Hodges, J.T.; Naumenko, O.V.; Polyansky, O.L.; et al. IUPAC critical evaluation of the rotational-vibrational spectra of water vapor. Part IV. Energy levels and transition wavenumbers for D216O, D217O and D218O. J. Quant. Spectrosc. Radiat. Transf. 2014, 142, 93–108.
- Furtenbacher et al. (2013a) Furtenbacher, T.; Szidarovszky, T.; Mátyus, E.; Fábri, C.; Császár, A.G. Analysis of the Rotational–Vibrational States of the Molecular Ion H. J. Chem. Theory Comput. 2013, 9, 5471–5478.
- Furtenbacher et al. (2013b) Furtenbacher, T.; Szidarovszky, T.; Fábri, C.; Császár, A.G. MARVEL analysis of the rotational–vibrational states of the molecular ions H2D+ and D2H+. Phys. Chem. Chem. Phys. 2013, 15, 10181–10193.
- Al Derzi et al. (2015) Al Derzi, A.R.; Furtenbacher, T.; Yurchenko, S.N.; Tennyson, J.; Császár, A.G. MARVEL analysis of the measured high-resolution spectra of 14NH3. J. Quant. Spectrosc. Radiat. Transf. 2015, 161, 117–130.
- Furtenbacher et al. (2016) Furtenbacher, T.; Szabó, I.; Császár, A.G.; Bernath, P.F.; Yurchenko, S.N.; Tennyson, J. Experimental Energy Levels and Partition Function of the 12C2 Molecule. Astrophys. J. Suppl. 2016, 224, 44.
- McKemmish et al. (2017) McKemmish, L.K.; Masseron, T.; Sheppard, S.; Sandeman, E.; Schofield, Z.; Furtenbacher, T.; Császár, A.G.; Tennyson, J.; Sousa-Silva, C. MARVEL analysis of the measured high-resolution spectra of 48Ti16O. Astrophys. J. Suppl. 2017, 228, 15.
- Chubb et al. (2018) Chubb, K.L.; Joseph, M.; Franklin, J.; Choudhury, N.; Furtenbacher, T.; Császár, A.G.; Gaspard, G.; Oguoko, P.; Kelly, A.; Yurchenko, S.N.; et al. MARVEL analysis of the measured high-resolution spectra of C2H2. J. Quant. Spectrosc. Radiat. Transf. 2018, 204, 42–55.
- Tóbiás et al. (2018) Tóbiás, R.; Furtenbacher, T.; Császár, A.G.; Naumenko, O.V.; Tennyson, J.; Flaud, J.M.; Kumard, P.; Poirier, B. Critical Evaluation of Measured Rotational-Vibrational Transitions ofFour Sulphur Isotopologues of S16O2. J. Quant. Spectrosc. Radiat. Transf. 2018, 208, 152–163.
- Chubb et al. (2018) Chubb, K.L.; Naumenko, O.V.; Keely, S.; Bartolotto, S.; MacDonald, S.; Mukhtar, M.; Grachov, A.; White, J.; Coleman, E.; Hu, S.M.; et al. MARVEL analysis of the measured high-resolution rovibrational spectra of H2S. J. Quant. Spectrosc. Radiat. Transf. 2018, submitted.
- McKemmish et al. (2018) McKemmish, L.K.; Goodhew, K.; Sheppard, S.; Bennet, A.; Martin, A.; Singh, A.; Sturgeon, C.; Godden, R.; Furtenbacher, T.; Császár, A.G.; et al. MARVEL analysis of the measured high-resolution spectra of 90Zr16O. Astrophys. J. Suppl. 2018, to be submitted.
- Yurchenko et al. (2018) Yurchenko, S.N.; Al-Refaie, A.F.; Tennyson, J. ExoCross: A general program for generating spectra from molecular line lists. Astron. Astrophys. 2018, doi:10.1051/0004-6361/201732531.
- Hill et al. (2013) Hill, C.; Yurchenko, S.N.; Tennyson, J. Temperature-dependent molecular absorption cross sections for exoplanets and other atmospheres. Icarus 2013, 226, 1673–1677.
- Tennyson et al. (2016) Tennyson, J.; Yurchenko, S.N.; Al-Refaie, A.F.; Barton, E.J.; Chubb, K.L.; Coles, P.A.; Diamantopoulou, S.; Gorman, M.N.; Hill, C.; Lam, A.Z.; et al. The ExoMol database: Molecular line lists for exoplanet and other hot atmospheres. J. Mol. Spectrosc. 2016, 327, 73–94.
- Yadin et al. (2012) Yadin, B.; Vaness, T.; Conti, P.; Hill, C.; Yurchenko, S.N.; Tennyson, J. ExoMol Molecular linelists: I The rovibrational spectrum of BeH, MgH and CaH the state. Mon. Not. R. Astron. Soc. 2012, 425, 34–43.
- Barton et al. (2013) Barton, E.J.; Yurchenko, S.N.; Tennyson, J. ExoMol Molecular linelists—II. The ro-vibrational spectrum of SiO. Mon. Not. R. Astron. Soc. 2013, 434, 1469–1475.
- Yurchenko and Tennyson (2014) Yurchenko, S.N.; Tennyson, J. ExoMol line lists IV: The rotation–vibration spectrum of methane up to 1500 K. Mon. Not. R. Astron. Soc. 2014, 440, 1649–1661.
- Barton et al. (2014) Barton, E.J.; Chiu, C.; Golpayegani, S.; Yurchenko, S.N.; Tennyson, J.; Frohman, D.J.; Bernath, P.F. ExoMol Molecular linelists—V. The ro-vibrational spectra of NaCl and KCl. Mon. Not. R. Astron. Soc. 2014, 442, 1821–1829.
- Yorke et al. (2014) Yorke, L.; Yurchenko, S.N.; Lodi, L.; Tennyson, J. ExoMol line lists VI: A high temperature line list for Phosphorus Nitride. Mon. Not. R. Astron. Soc. 2014, 445, 1383–1391.
- Sousa-Silva et al. (2015) Sousa-Silva, C.; Al-Refaie, A.F.; Tennyson, J.; Yurchenko, S.N. ExoMol line lists—VII. The rotation–vibration spectrum of phosphine up to 1500 K. Mon. Not. R. Astron. Soc. 2015, 446, 2337–2347.
- Al-Refaie et al. (2015) Al-Refaie, A.F.; Yurchenko, S.N.; Yachmenev, A.; Tennyson, J. ExoMol line lists—VIII: A variationally computed line list for hot formaldehyde. Mon. Not. R. Astron. Soc. 2015, 448, 1704–1714.
- Patrascu et al. (2015) Patrascu, A.T.; Tennyson, J.; Yurchenko, S.N. ExoMol molecular linelists: VII: The spectrum of AlO. Mon. Not. R. Astron. Soc. 2015, 449, 3613–3619.
- Rivlin et al. (2015) Rivlin, T.; Lodi, L.; Yurchenko, S.N.; Tennyson, J.; Le Roy, R.J. ExoMol line lists X: The spectrum of sodium hydride. Mon. Not. R. Astron. Soc. 2015, 451, 5153–5157.
- Pavlyuchko et al. (2015) Pavlyuchko, A.I.; Yurchenko, S.N.; Tennyson, J. ExoMol line lists XI: A Hot Line List for nitric acid. Mon. Not. R. Astron. Soc. 2015, 452, 1702–1706.
- Paulose et al. (2015) Paulose, G.; Barton, E.J.; Yurchenko, S.N.; Tennyson, J. ExoMol Molecular linelists—XII. Line lists for eight isotopologues of CS. Mon. Not. R. Astron. Soc. 2015, 454, 1931–1939.
- Yurchenko et al. (2016) Yurchenko, S.N.; Blissett, A.; Asari, U.; Vasilios, M.; Hill, C.; Tennyson, J. ExoMol Molecular linelists—XIII. The spectrum of CaO. Mon. Not. R. Astron. Soc. 2016, 456, 4524–4532.
- Underwood et al. (2016) Underwood, D.S.; Tennyson, J.; Yurchenko, S.N.; Huang, X.; Schwenke, D.W.; Lee, T.J.; Clausen, S.; Fateev, A. ExoMol line lists XIV: A line list for hot SO2. Mon. Not. R. Astron. Soc. 2016, 459, 3890–3899.
- Al-Refaie et al. (2016) Al-Refaie, A.F.; Polyansky, O.L.; I., R.; Ovsyannikov.; Tennyson, J.; Yurchenko, S.N. ExoMol line lists XV: A hot line-list for hydrogen peroxide. Mon. Not. R. Astron. Soc. 2016, 461, 1012–1022.
- Azzam et al. (2016) Azzam, A.A.A.; Yurchenko, S.N.; Tennyson, J.; Naumenko, O.V. ExoMol line lists XVI: A Hot Line List for H2S. Mon. Not. R. Astron. Soc. 2016, 460, 4063–4074.
- Underwood et al. (2016) Underwood, D.S.; Tennyson, J.; Yurchenko, S.N.; Clausen, S.; Fateev, A. ExoMol line lists XVII: A line list for hot SO3. Mon. Not. R. Astron. Soc. 2016, 462, 4300–4313.
- McKemmish et al. (2016) McKemmish, L.K.; Yurchenko, S.N.; Tennyson, J. ExoMol Molecular linelists—XVIII. The spectrum of Vanadium Oxide. Mon. Not. R. Astron. Soc. 2016, 463, 771–793.
- Polyansky et al. (2017) Polyansky, O.L.; Kyuberis, A.A.; Lodi, L.; Tennyson, J.; Ovsyannikov, R.I.; Zobov, N. ExoMol molecular line lists XIX: High accuracy computed line lists for H217O and H218O. Mon. Not. R. Astron. Soc. 2017, 466, 1363–1371.
- Mizus et al. (2017) Mizus, I.I.; Alijah, A.; Zobov, N.F.; Kyuberis, A.A.; Yurchenko, S.N.; Tennyson, J.; Polyansky, O.L. ExoMol molecular line lists XX: A comprehensive line list for H. Mon. Not. R. Astron. Soc. 2017, 468, 1717–1725.
- Owens et al. (2017) Owens, A.; Yurchenko, S.N.; Yachmenev, A.; Thiel, W.; Tennyson, J. ExoMol molecular line lists XXII. The rotation–vibration spectrum of silane up to 1200 K. Mon. Not. R. Astron. Soc. 2017, 471, 5025–5032.
- Prajapat et al. (2017) Prajapat, L.; Jagoda, P.; Lodi, L.; Gorman, M.N.; Yurchenko, S.N.; Tennyson, J. ExoMol molecular line lists XXIII. Spectra of PO and PS. Mon. Not. R. Astron. Soc. 2017, 472, 3648–3658.
- Yurchenko et al. (2018) Yurchenko, S.N.; Sinden, F.; Lodi, L.; Hill, C.; Gorman, M.N.; Tennyson, J. ExoMol Molecular linelists—XXIV: A new hot line list for silicon monohydride, SiH. Mon. Not. R. Astron. Soc. 2018, 473, 5324–5333.
- Upadhyay et al. (2018) Upadhyay, A.; Conway, E.K.; Tennyson, J.; Yurchenko, S.N. ExoMol Molecular linelists—XXV: A hot line list for silicon sulphide, SiS. Mon. Not. R. Astron. Soc. 2018, doi:10.1093/mnras/sty998.
- Yurchenko et al. (2018) Yurchenko, S.N.; Bond, W.; Gorman, M.N.; Lodi, L.; McKemmish, L.K.; Nunn, W.; Shah, R.; Tennyson, J. ExoMol Molecular linelists—XXVI: Spectra of SH and NS. Mon. Not. R. Astron. Soc. 2018, doi:10.1093/mnras/sty939.
- Mant et al. (2018) Mant, B.P.; Yachmenev, A.; Tennyson, J.; Yurchenko, S.N. ExoMol molecular line lists—XXVII: Spectra of C2H4. Mon. Not. R. Astron. Soc. 2018, in press.
- Yurchenko et al. (2018a) Yurchenko, S.N.; Williams, H.; Leyland, P.C.; Lodi, L.; Tennyson, J. ExoMol line lists XXVIII: The rovibronic spectrum of AlH. Mon. Not. R. Astron. Soc. 2018, in press.
- Yurchenko et al. (2018b) Yurchenko, S.N.; Szabo, I.; Pyatenko, E.; Tennyson, J. ExoMol Molecular line lists XXXI: The spectrum of C2. Mon. Not. R. Astron. Soc. 2018, in press.
- Li et al. (2018) Li, H.Y.; Patrascu, A.; Tennyson, J.; Yurchenko, S.N. ExoMol molecular line lists XXXII: The rovibronic spectrum of MgO. Mon. Not. R. Astron. Soc. 2018, to be submitted.
- Yurchenko et al. (2011) Yurchenko, S.N.; Barber, R.J.; Tennyson, J. A variationally computed hot line list for NH3. Mon. Not. R. Astron. Soc. 2011, 413, 1828–1834.
- Coppola et al. (2011) Coppola, C.M.; Lodi, L.; Tennyson, J. Radiative cooling functions for primordial molecules. Mon. Not. R. Astron. Soc. 2011, 415, 487–493.
- Lodi et al. (2015) Lodi, L.; Yurchenko, S.N.; Tennyson, J. The calculated rovibronic spectrum of scandium hydride, ScH. Mol. Phys. 2015, 113, 1559–1575.
- Brooke et al. (2014) Brooke, J.S.A.; Bernath, P.F.; Western, C.M.; van Hemert, M.C.; Groenenboom, G.C. Line strengths of rovibrational and rotational transitions within the X ground state of NH. J. Chem. Phys. 2014, 141, 054310.
- Masseron et al. (2014) Masseron, T.; Plez, B.; Van Eck, S.; Colin, R.; Daoutidis, I.; Godefroid, M.; Coheur, P.F.; Bernath, P.; Jorissen, A.; Christlieb, N. CH in stellar atmospheres: An extensive linelist. Astron. Astrophys. 2014, 571, A47.
- Brooke et al. (2014) Brooke, J.S.A.; Ram, R.S.; Western, C.M.; Li, G.; Schwenke, D.W.; Bernath, P.F. Einstein A Coefficients and Oscillator Strengths for the – (Red) and – (Violet) Systems and Rovibrational Transitions in the State of CN. Astrophys. J. Suppl. 2014, 210, 23.
- Ram et al. (2014) Ram, R.S.; Brooke, J.S.A.; Western, C.M.; Bernath, P.F. Einstein A-values and oscillator strengths of the A –X system of CP. J. Quant. Spectrosc. Radiat. Transf. 2014, 138, 107–115.
- Li et al. (2013) Li, G.; Gordon, I.E.; Hajigeorgiou, P.G.; Coxon, J.A.; Rothman, L.S. Reference spectroscopic data for hydrogen halides, Part II: The line lists. J. Quant. Spectrosc. Radiat. Transf. 2013, 130, 284–295.
- Wende et al. (2010) Wende, S.; Reiners, A.; Seifahrt, A.; Bernath, P.F. CRIRES spectroscopy and empirical line-by-line identification of FeH molecular absorption in an M dwarf. Astron. Astrophys. 2010, 523, A58.
- Burrows et al. (2005) Burrows, A.; Dulick, M.; Bauschlicher, C.W.; Bernath, P.F.; Ram, R.S.; Sharp, C.M.; Milsom, J.A. Spectroscopic constants, abundances, and opacities of the TiH molecule. Astrophys. J. 2005, 624, 988–1002.
- Schwenke (1998) Schwenke, D.W. Opacity of TiO from a coupled electronic state calculation parametrized by ab initio and experimental data. Faraday Discuss. 1998, 109, 321–334.
- Lyulin and Perevalov (2017) Lyulin, O.M.; Perevalov, V.I. ASD-1000: High-resolution, high-temperature acetylene spectroscopic databank. J. Quant. Spectrosc. Radiat. Transf. 2017, 201, 94–103.
- Burrows et al. (2002) Burrows, A.; Ram, R.S.; Bernath, P.; Sharp, C.M.; Milsom, J.A. New CrH opacities for the study of L and brown dwarf atmospheres. Astrophys. J. 2002, 577, 986–992.
- Owens et al. (2018) Owens, A.; Yachmenev, A.; Küpper, J.; Yurchenko, S.N.; Thiele, W. The rotation–vibration spectrum of methyl fluoride from first principles. Phys. Chem. Chem. Phys. 2018, in press.
- Voronin et al. (2010) Voronin, B.A.; Tennyson, J.; Tolchenov, R.N.; Lugovskoy, A.A.; Yurchenko, S.N. A high accuracy computed line list for the HDO molecule. Mon. Not. R. Astron. Soc. 2010, 402, 492–496.
- Allard et al. (1994) Allard, F.; Hauschildt, P.H.; Miller, S.; Tennyson, J. The influence of H2O line blanketing on the spectra of cool dwarf stars. Astrophys. J. 1994, 426, L39–L41.
- Tinetti et al. (2012) Tinetti, G.; Tennyson, J.; Griffiths, C.A.; Waldmann, I. Water in Exoplanets. Phil. Trans. R. Soc. Lond. A 2012, 370, 2749–2764.
- Barber et al. (2006) Barber, R.J.; Tennyson, J.; Harris, G.J.; Tolchenov, R.N. A high accuracy computed water line list. Mon. Not. R. Astron. Soc. 2006, 368, 1087–1094.
- Allard (2014) Allard, F. The BT-Settl Model Atmospheres for Stars, Brown Dwarfs and Planets. In IAU Symposium; Booth, M., Matthews, B.C., Graham, J.R., Eds.; International Astronomical Union: Pairs, France, 2014; Volume 299, pp. 271–272.
- Rutkowski et al. (2018) Rutkowski, L.; Foltynowicz, A.; Johansson, A.C.; Khodabakhsh, A.; Schmidt, F.M.; Kyuberis, A.A.; Zobov, N.F.; Polyansky, O.L.; Yurchenko, S.N.; Tennyson, J. An experimental water line list at 1950 K in the 6250–6670 cm-1 region. J. Quant. Spectrosc. Radiat. Transf. 2018, 205, 213–219.
- Campargue et al. (2017) Campargue, A.; Mikhailenko, S.N.; Vasilchenko, S.; Reynaud, C.; Beguier, S.; Cermak, P.; Mondelain, D.; Kassi, S.; Romanini, D. The absorption spectrum of water vapor in the 2.2 m transparency window: High sensitivity measurements and spectroscopic database. J. Quant. Spectrosc. Radiat. Transf. 2017, 189, 407–416.
- Rey et al. (2014) Rey, M.; Nikitin, A.V.; Tyuterev, V.G. Theoreticak hot methane line list up T=2000 K for astrophysical applications. Astrophys. J. 2014, 789, 2.
- Rey et al. (2017) Rey, M.; Nikitin, A.V.; Tyuterev, V.G. Accurate Theoretical Methane Line Lists in the Infrared up to 3000 K and Quasi-continuum Absorption/Emission Modeling for Astrophysical Applications. Astrophys. J. 2017, 847, 105.
- Hargreaves et al. (2012) Hargreaves, R.J.; Beale, C.A.; Michaux, L.; Irfan, M.; Bernath, P.F. Hot methane line lists for exoplanet and brown dwarf atmospheres. Astrophys. J. 2012, 757, 46.
- Hargreaves et al. (2015) Hargreaves, R.J.; Bernath, P.F.; Bailey, J.; Dulick, M. Empirical Line Lists and Absorption Cross Sections for Methane at High Temperatures. Astrophys. J. 2015, 813, 12.
- Canty et al. (2015) Canty, J.I.; Lucas, P.W.; Tennyson, J.; Yurchenko, S.N.; Leggett, S.K.; Tinney, C.G.; Jones, H.R.A.; Burningham, B.; Pinfield, D.J.; Smart, R.L. Methane and Ammonia in the near-infrared spectra of late T dwarfs. Mon. Not. R. Astron. Soc. 2015, 450, 454–480.
- Yurchenko et al. (2017) Yurchenko, S.N.; Amundsen, D.S.; Tennyson, J.; Waldmann, I.P. A hybrid line list for CH4 and hot methane continuum. Astron. Astrophys. 2017, 605, A95.
- Fletcher et al. (2009) Fletcher, L.N.; Orton, G.S.; Teanby, N.A.; Irwin, P.G.J. Phosphine on Jupiter and Saturn from Cassini/CIRS. Icarus 2009, 202, 543–564.
- Yurchenko (2015) Yurchenko, S.N. A theoretical room-temperature line list for 15NH3. J. Quant. Spectrosc. Radiat. Transf. 2015, 152, 28–36.
- Rey et al. (2016) Rey, M.; Delahaye, T.; Nikitin, A.V.; Tyuterev, V.G. First theoretical global line lists of ethylene (12 C2H4 ) spectra for the temperature range 50,700 K in the far-infrared for quantification of absorption and emission in planetary atmospheres. Astron. Astrophys. 2016, 594, A47.
- Al-Refaie et al. (2015) Al-Refaie, A.F.; Ovsyannikov, R.I.; Polyansky, O.L.; Yurchenko, S.N.; Tennyson, J. A variationally calculated room temperature line-list for H2O2. J. Mol. Spectrosc. 2015, 318, 84–90.
- Harris et al. (2002) Harris, G.J.; Polyansky, O.L.; Tennyson, J. Opacity data for HCN and HNC from a new ab initio linelist. Astrophys. J. 2002, 578, 657–663.
- Harris et al. (2006) Harris, G.J.; Tennyson, J.; Kaminsky, B.M.; Pavlenko, Y.V.; Jones, H.R.A. Improved HCN/HNC linelist, model atmospheres synthetic spectra for WZ Cas. Mon. Not. R. Astron. Soc. 2006, 367, 400–406.
- Mellau (2011a) Mellau, G.C. Highly excited rovibrational states of HNC. J. Mol. Spectrosc. 2011, 269, 77–85.
- Mellau (2011b) Mellau, G.C. Complete experimental rovibrational eigenenergies of HCN up to 6880 cm-1 above the ground state. J. Chem. Phys. 2011, 134, 234303.
- Mellau (2011) Mellau, G.C. Rovibrational eigenenergy structure of the [H,C,N] molecular system. J. Chem. Phys. 2011, 134, 194302.
- Harris et al. (2008) Harris, G.J.; Larner, F.C.; Tennyson, J.; Kaminsky, B.M.; Pavlenko, Y.V.; Jones, H.R.A. A H13CN/HN13C linelist, model atmospheres and synthetic spectra for carbon stars. Mon. Not. R. Astron. Soc. 2008, 390, 143–148.
- Tsiaras et al. (2016) Tsiaras, A.; Rocchetto, M.; Waldmann, I.P.; Tinetti, G.; Varley, R.; Morello, G.; Barton, E.J.; Yurchenko, S.N.; Tennyson, J. Detection of an atmosphere around the super-Earth 55 Cancri e. Astrophys. J. 2016, 820, 99.
- Eriksson et al. (1984) Eriksson, K.; Gustafsson, B.; Jørgensen, U.G.; Nordlund, A. Effects of HCN molecules in carbon star atmospheres. Astron. Astrophys. 1984, 132, 37–44.
- Barber et al. (2002) Barber, R.J.; Harris, G.J.; Tennyson, J. Temperature dependent partition functions and equilibrium constant for HCN and HNC. J. Chem. Phys. 2002, 117, 11239–11243.
- Kaltenegger et al. (2010) Kaltenegger, L.; Henning, W.G.; Sasselov, D.D. Detecting volcanism on extrasolar planets. Astron. J. 2010, 140, 1370.
- Hu et al. (2013) Hu, R.; Seager, S.; Bains, W. Photochemistry in terrestrial exoplanet atmospheres. II. H2S and SO2 photochemistry in anoxic atmospheres. Astrophys. J. 2013, 769, 6.
- Whitehill et al. (2013) Whitehill, A.R.; Xie, C.; Hu, X.; Xie, D.; Guo, H.; Ono, S. Vibronic origin of sulfur mass-independent isotope effect in photoexcitation of SO2 and the implications to the early earth’s atmosphere. Proc. Nat. Acad. Sci. USA 2013, 110, 17697–17702.
- Johnson et al. (2009) Johnson, S.S.; Pavlov, A.A.; Mischna, M.A. Fate of SO2 in the ancient Martian atmosphere: Implications for transient greenhouse warming. J. Geophys. Res. 2009, 114, E11011.
- Huang et al. (2014) Huang, X.; Gamache, R.R.; Freedman, R.S.; Schwenke, D.W.; Lee, T.J. Reliable infrared line lists for 13 CO2 isotopologues up to E =18,000 cm-1 and 1500 K, with line shape parameters. J. Quant. Spectrosc. Radiat. Transf. 2014, 147, 134–144.
- Błęcka and De Mazière (1997) Błęcka, M.I.; De Mazière, M. Detection of nitric acid and nitric oxides in the terrestrial atmosphere in the middle-infrared spectral region. Ann. Geophys. 1997, 14, 1103–1110.
- Cooper et al. (2011) Cooper, M.; Martin, R.V.; Sauvage, B.; Boone, C.D.; Walker, K.A.; Bernath, P.F.; McLinden, C.A.; Degenstein, D.A.; Volz-Thomas, A.; Wespes, C. Evaluation of ACE-FTS and OSIRIS Satellite retrievals of ozone and nitric acid in the tropical upper troposphere: Application to ozone production efficiency. J. Geophys. Res. 2011, 116, D12306.
- Seager et al. (2013) Seager, S.; Bains, W.; Hu, R. A Biomass-based Model to Estimate the Plausibility of Exoplanet Biosignature Gases. Astrophys. J. 2013, 775, 104.
- Brown et al. (1998) Brown, L.R.; Crisp, J.A.; Crisp, D.; Naumenko, O.V.; Smirnov, M.A.; Sinitsa, L.N.; Perrin, A. The Absorption Spectrum of H2S Between 2150 and 4260 cm-1: Analysis of the Positions and Intensities in the First (, , and ) and Second (, , and ) Triad Regions. J. Mol. Spectrosc. 1998, 188, 148–174.
- Somerville (1977) Somerville, W.B. Interstellar radio spectrum lines. Rep. Prog. Phys. 1977, 40, 483–565.
- Lovas et al. (1979) Lovas, F.J.; Johnson, D.R.; Snyder, L.E. Recommended rest frequencies for observed interstellar molecular transitions. Astrophys. J. Suppl. 1979, 41, 451–480.
- Tomkin and Lambert (1980) Tomkin, J.; Lambert, D.L. Isotopic adbundances of magnesium 5 G-dwarfs and K-dwarfs. Astrophys. J. 1980, 235, 925–938.
- McWilliam and Lambert (1988) McWilliam, A.; Lambert, D.L. Isotopic magnesium abundances in stars. Mon. Not. R. Astron. Soc. 1988, 230, 573–585.
- Gay and Lambert (2000) Gay, P.L.; Lambert, D.L. The isotopic abundances of magnesium in stars. Astrophys. J. 2000, 533, 260–270.
- Yong et al. (2003) Yong, D.; Lambert, D.L.; Ivans, I.I. Magnesium isotopic abundance ratios in cool stars. Astrophys. J. 2003, 599, 1357–1371.
- Hinkle et al. (2013) Hinkle, K.H.; Wallace, L.; Ram, R.S.; Bernath, P.F.; Sneden, C.; Lucatello, S. The magnesium isotopologues of MgH in the A – X system. Astrophys. J. Suppl. 2013, 207, doi:10.1088/0067-0049/207/2/26.
- GharibNezhad et al. (2013) GharibNezhad, E.; Shayesteh, A.; Bernath, P.F. Einstein A coefficients for rovibronic lines of the A X and B’ X transitions of MgH. Mon. Not. R. Astron. Soc. 2013, 432, 2043–2047.
- Henderson et al. (2013) Henderson, R.D.E.; Shayesteh, A.; Tao, J.; Haugen, C.C.; Bernath, P.F.; Le Roy, R.J. Accurate Analytic Potential and Born-Oppenheimer Breakdown Functions for MgH and MgD from a Direct-Potential-Fit Data Analysis. J. Phys. Chem. A 2013, 117, 13373–13387.
- Reiners et al. (2007) Reiners, A.; Homeier, D.; Hauschildt, P.H.; Allard, F. A high resolution spectral atlas of brown dwarfs. Astron. Astrophys. 2007, 473, 245–255.
- Darby-Lewis et al. (2018) Darby-Lewis, D.; Tennyson, J.; Lawson, K.D.; Yurchenko, S.N.; Stamp, M.F.; Shaw, A.; Brezinsek, S.; JET Contributor. Synthetic spectra of BeH, BeD and BeT for emission modelling in JET plasmas. J. Phys. B At. Mol. Opt. Phys. 2018, submitted.
- Shanmugavel et al. (2008) Shanmugavel, R.; Bagare, S.P.; Rajamanickam, N.; Balachandra Kumar, K. Identification of Beryllium Hydride Isotopomer Lines in Sunspot Umbral Spectra. Serb. Astron. J. 2008, 176, 51–58.
- Duxbury et al. (1998) Duxbury, G.; Stamp, M.F.; Summers, H.P. Observations and modelling of diatomic molecular spectra from JET. Plasma Phys. Controlled Fusion 1998, 40, 361–370.
- Wallace et al. (2000) Wallace, L.; Hinkle, K.; Livingston, W. An Atlas of Sunspot Umbral Spectra in the Visible from 15,000 to 25,000 cm-1 (3920 to 6664 Å); Technical Report Tech. Rep. 00-001; National Solar Observatory: Tucson, AZ, USA, 2000.
- Kaminski et al. (2016) Kaminski, T.; Wong, K.T.; Schmidt, M.R.; Mueller, H.S.P.; Gottlieb, C.A.; Cherchneff, I.; Menten, K.M.; Keller, D.; Bruenken, S.; Winters, J.M.; et al. An observational study of dust nucleation in Mira (o Ceti) I. Variable features of AlO and other Al- bearing species. Astron. Astrophys. 2016, 592, A42.
- Li et al. (2011) Li, G.; Gordon, I.E.; Bernath, P.F.; Rothman, L.S. Direct fit of experimental ro-vibrational intensities to the dipole moment function: Application to {HCl}. J. Quant. Spectrosc. Radiat. Transf. 2011, 112, 1543–1550.
- Tenenbaum et al. (2007) Tenenbaum, E.D.; Woolf, N.J.; Ziurys, L.M. Identification of phosphorus monoxide (X ) in VY Canis Majoris: Detection of the first P-O bond in space. Astrophys. J. 2007, 666, L29–L32.
- De Beck et al. (2013) De Beck, E.; Kaminski, T.; Patel, N.A.; Young, K.H.; Gottlieb, C.A.; Menten, K.M.; Decin, L. PO and PN in the wind of the oxygen-rich AGB star IK Tauri. Astron. Astrophys. 2013, 558, 9.
- Rivilla et al. (2016) Rivilla, V.M.; Fontani, F.; Beltrán, M.T.; Vasyunin, A.; Caselli, P.; Martín-Pintado, J.; Cesaroni, R. The First Detections of the Key Prebiotic Molecule PO in Star-forming Regions. Astrophys. J. 2016, 826, 161.
- Lefloch et al. (2016) Lefloch, B.; Vastel, C.; Viti, S.; Jimenez-Serra, I.; Codella, C.; Podio, L.; Ceccarelli, C.; Mendoza, E.; Lepine, J.R.D.; Bachiller, R. Phosphorus-bearing molecules in solar-type star-forming regions: First PO detection. Mon. Not. R. Astron. Soc. 2016, 462, 3937.
- Jones et al. (2005) Jones, H.R.A.; Pavlenko, Y.; Viti, S.; Barber, R.J.; Yakovina, L.; Pinfold, D.; Tennyson, J. Carbon monoxide in low-mass dwarf stars. Mon. Not. R. Astron. Soc. 2005, 358, 105–112.
- de Kok et al. (2013) De Kok, R.J.; Brogi, M.; Snellen, I.A.G.; Birkby, J.; Albrecht, S.; de Mooij, E.J.W. Detection of carbon monoxide in the high-resolution day-side spectrum of the exoplanet HD 189,733b. Astron. Astrophys. 2013, 554, A82.
- Brogi et al. (2014) Brogi, M.; de Kok, R.J.; Birkby, J.L.; Schwarz, H.; Snellen, I.A.G. Carbon monoxide and water vapor in the atmosphere of the non-transiting exoplanet HD 179,949 b. Astron. Astrophys. 2014, 565, A124.
- Tennyson (2014) Tennyson, J. Vibration-rotation transition intensities from first principles. J. Mol. Spectrosc. 2014, 298, 1–6.
- Danielak et al. (1997) Danielak, J.; Domin, U.; Kepa, R.; Rytel, M.; Zachwieja, M. Reinvestigation of the emission gamma band system (A – X ) of the NO molecule. J. Mol. Spectrosc. 1997, 181, 394–402.
- Pavlenko (1997) Pavlenko, Y.V. A “lithium test” and modeling of lithium lines in late-type M dwarfs: Teide1. Astron. Rep. 1997, 41, 537–542.
- Bittner and Bernath (2018) Bittner, D.M.; Bernath, P.F. Line Lists for LiF and LiCl in the X Ground State. Astrophys. J. Suppl. 2018, 235, 8.
- McKemmish et al. (2016) McKemmish, L.K.; Yurchenko, S.N.; Tennyson, J. Ab initio calculations to support accurate modelling of the rovibronic spectroscopy calculations of vanadium monoxide (VO). Mol. Phys. 2016, 114, 3232–3248.
- Tennyson et al. (2016) Tennyson, J.; Lodi, L.; McKemmish, L.K.; Yurchenko, S.N. The ab initio calculation of spectra of open shell diatomic molecules. J. Phys. B At. Mol. Opt. Phys. 2016, 49, 102001.
- Cushing et al. (2003) Cushing, M.C.; Rayner, J.T.; Davis, S.P.; Vacca, W.D. FeH absorption in the near-infrared spectra of late M and L dwarfs. Astrophys. J. 2003, 582, 1066–1072.
- Hargreaves et al. (2010) Hargreaves, R.J.; Hinkle, K.H.; Bauschlicher, C.W., Jr.; Wende, S.; Seifahrt, A.; Bernath, P.F. High-resolution 1.6 m spectra of FeH in M and L dwarfs. Astron. J. 2010, 140, 919–924.
- Wallace and Hinkle (2001) Wallace, L.; Hinkle, K. Detection of the 1.6 m E –A FeH system in sunspot and cool star spectra. Astrophys. J. 2001, 559, 424–427.
- Ramos et al. (2004) Ramos, A.A.; Bueno, J.T.; Collados, M. Detection of polarization from the E –A system of FeH in sunspot spectra. Astrophys. J. 2004, 603, L125–L128.
- Harrison and Brown (2008) Harrison, J.J.; Brown, J.M. Measurement of the magnetic properies of FeH in its X and F states from sunspot spectra. Astrophys. J. 2008, 686, 1426–1431.
- DeYonker and Allen (2012) DeYonker, N.J.; Allen, W.D. Taming the low-lying electronic states of FeH. J. Chem. Phys. 2012, 137, 234303.
- Dulick et al. (2003) Dulick, M.; Bauschlicher, C.W.; Burrows, A.; Sharp, C.M.; Ram, R.S.; Bernath, P. Line intensities and molecular opacities of the FeH F –X transition. Astrophys. J. 2003, 594, 651–663.
- Rajpurohit et al. (2013) Rajpurohit, A.S.; Reyle, C.; Allard, F.; Homeier, D.; Schultheis, M.; Bessell, M.S.; Robin, A.C. The effective temperature scale of M dwarfs. Astron. Astrophys. 2013, 556, A15.
- Ardila et al. (2010) Ardila, D.R.; Van Dyk, S.D.; Makowiecki, W.; Stauffer, J.; Song, I.; Rho, J.; Fajardo-Acosta, S.; Hoard, D.W.; Wachter, S. The Spitzer atlas of stellar spectra (SASS). Astrophys. J. Suppl. 2010, 191, 301–339.
- Campbell et al. (1995) Campbell, J.M.; Klapstein, D.; Dulick, M.; Bernath, P.F. Infrared-absorption and emission-spectra of SiO. Astrophys. J. Suppl. 1995, 101, 237–254.
- Wallace and Hinkle (2002) Wallace, L.; Hinkle, K. Medium-resolution stellar spectra in the L band from 2400 to 3000 cm-1 (3.3 to 4.2 microns). Astron. J. 2002, 124, 3393–3399.
- Joshi et al. (1979) Joshi, G.C.; Punetha, L.M.; Pande, M.C. (A–X) system of SiO in sunspots. Solar Phys. 1979, 62, 77–82.
- Bauschlicher Jr. (2016) Bauschlicher, C.W., Jr. The low-lying electronic states of SiO. Chem. Phys. Lett. 2016, 658, 76–79.
- Kurucz (2011) Kurucz, R.L. Including all the lines. Can. J. Phys. 2011, 89, 417–428.
- Bai et al. (2014) Bai, X.; Motto-Ros, V.; Lei, W.; Zheng, L.; Yu, J. Experimental determination of the temperature range of AlO molecular emission in laser-induced aluminum plasma in air. Spectra Chim. Acta B 2014, 99, 193–200.
- Surmick and Parigger (2014) Surmick, D.M.; Parigger, C.G. Aluminum Monoxide Emission Measurements in a Laser-Induced Plasma. Appl. Spectrosc. 2014, 68, 992–996.
- Parigger and Hornkohl (2011) Parigger, C.G.; Hornkohl, J.O. Computation of AlO B X emission spectra. Spectra Chim. Acta A 2011, 81, 404–411.
- Kirkpatrick et al. (1993) Kirkpatrick, J.D.; Kelly, D.M.; Rieke, G.H.; Liebert, J.; Allard, F.; Wehrse, R. M dwarf spectra from 0.6 to 1.5 micron-A spectral sequence, model atmosphere fitting, and the temperature scale. Astrophys. J. 1993, 402, 643–654.
- McGovern et al. (2004) McGovern, M.R.; Kirkpatrick, J.D.; McLean, I.S.; Burgasser, A.J.; Prato, L.; Lowrance, P.J. Identifying Young Brown Dwarfs Using Gravity-Sensitive Spectral Features. Astrophys. J. 2004, 600, 1020.
- Kirkpatrick et al. (2006) Kirkpatrick, J.D.; Barman, T.S.; Burgasser, A.J.; McGovern, M.R.; McLean, I.S.; Tinney, C.G.; Lowrance, P.J. Discovery of a Very Young Field L Dwarf, 2MASS J01415823–4633574. Astrophys. J. 2006, 639, 1120.
- Peterson et al. (2008) Peterson, D.E.; Megeath, S.T.; Luhman, K.L.; Pipher, J.L.; Stauffer, J.R.; Barrado y Navascués, D.; Wilson, J.C.; Skrutskie, M.F.; Nelson, M.J.; Smith, J.D. New Young Brown Dwarfs in the Orion Molecular Cloud 2/3 Region. Astrophys. J. 2008, 685, 313.
- Desert et al. (2008) Desert, J.M.; Vidal-Madjar, A.; des Etangs, A.L.; Sing, D.; Ehrenreich, D.; Hebrard, G.; Ferlet, R. TiO and VO broad band absorption features in the optical spectrum of the atmosphere of the hot-Jupiter HD 209458b. Astron. Astrophys. 2008, 492, 585–592.
- Allard et al. (2000) Allard, F.; Hauschildt, P.H.; Schwenke, D. TiO and H2O absorption lines in cool stellar atmospheres. Astrophys. J. 2000, 540, 1005–1015.
- Sedaghati et al. (2017) Sedaghati, E.; Boffin, H.M.J.; MacDonald, R.J.; Gandhi, S.; Madhusudhan, N.; Gibson, N.P.; Oshagh, M.; Claret, A.; Rauer, H. Detection of titanium oxide in the atmosphere of a hot Jupiter. Nature 2017, 549, 238.
- Nugroho et al. (2017) Nugroho, S.K.; Kawahara, H.; Masuda, K.; Hirano, T.; Kotani, T.; Tajitsu, A. High-resolution Spectroscopic Detection of TiO and a Stratosphere in the Day-side of WASP-33b. Astrophys. J. 2017, 154, 221.
- Tsiaras et al. (2018) Tsiaras, A.; Waldmann, I.P.; Zingales, T.; Rocchetto, M.; Morello, G.; Damiano, M.; Karpouzas, K.; Tinetti, G.; McKemmish, L.K.; Tennyson, J.; et al. A Population Study of Gaseous Exoplanets. Astron. J. 2018, 155, 156.
- Ryabchikova et al. (2015) Ryabchikova, T.; Piskunov, N.; Kurucz, R.L.; Stempels, H.C.; Heiter, U.; Pakhomov, Y.; Barklem, P.S. A major upgrade of the VALD database. Phys. Scr. 2015, 90, 054005.
- McKemmish et al. (2018) McKemmish, L.K.; Masseron, T.; Yurchenko, S.N.; Tennyson, J. ExoMol Molecular linelists—XXXIV. The spectrum of Titanium Oxide. Mon. Not. R. Astron. Soc. 2018, to be submitted.
- Wollaston (1802) Wollaston, W.H. A Method of Examining Refractive and Dispersive Powers, by Prismatic Reflection. Phil. Trans. R. Soc. Lond. 1802, 92, 365–380.
- Swan (1857) Swan, W. On the Prismatic Spectra of the Flames of Compounds of Carbon and Hydrogen. Trans. R. Soc. Edinburgh 1857, 21, 411.
- Brooke et al. (2013) Brooke, J.S.; Bernath, P.F.; Schmidt, T.W.; Bacskay, G.B. Line strengths and updated molecular constants for the C2 Swan system. J. Quant. Spectrosc. Radiat. Transf. 2013, 124, 11–20.
- Pavanello et al. (2012) Pavanello, M.; Adamowicz, L.; Alijah, A.; Zobov, N.F.; Mizus, I.I.; Polyansky, O.L.; Tennyson, J.; Szidarovszky, T.; Császár, A.G.; Berg, M.; et al. Precision measurements and computations of transition energies in rotationally cold triatomic hydrogen ions up to the mid-visible spectral range. Phys. Rev. Lett. 2012, 108, 023002.
- Miller and Tennyson (1988) Miller, S.; Tennyson, J. Calculated rotational and ro-vibrational transitions in the spectrum of H. Astrophys. J. 1988, 335, 486–490.
- Miller et al. (2000) Miller, S.; Achilleos, N.; Ballester, G.E.; Geballe, T.R.; Joseph, R.D.; Prange, R.; Rego, D.; Stallard, T.; Tennyson, J.; Trafton, L.M.; et al. The role of H in planetary atmospheres. Phil. Trans. R. Soc. Lond. A 2000, 358, 2485–2502.
- Shkolnik et al. (2006) Shkolnik, E.; Gaidos, E.; Moskovitz, N. No Detectable H Emission from the Atmospheres of Hot Jupiters. Astrophys. J. 2006, 132, 1267.
- Koskinen et al. (2007) Koskinen, T.T.; Aylward, A.D.; Miller, S. A stability limit for the atmospheres of giant extrasolar planets. Nature 2007, 450, 845–848.
- Miller et al. (2010) Miller, S.; Stallard, T.; Melin, H.; Tennyson, J. H cooling in planetary atmospheres. Faraday Discuss. 2010, 147, 283–291.
- Miller et al. (2013) Miller, S.; Stallard, T.; Tennyson, J.; Melin, H. Cooling by H emission. J. Phys. Chem. A 2013, 117, 9770–9777.
- Bergeron et al. (1997) Bergeron, P.; Ruiz, M.T.; Leggett, S.K. The chemical evolution of cool white dwarfs and the age of the local galactic disk. Astrophys. J. Suppl. 1997, 108, 339–387.
- Neale and Tennyson (1995) Neale, L.; Tennyson, J. A high temperature partition function for H. Astrophys. J. 1995, 454, L169–L173.
- Sochi and Tennyson (2010) Sochi, T.; Tennyson, J. A computed line list for the H2D+ molecular ion. Mon. Not. R. Astron. Soc. 2010, 405, 2345–2350.
- Herman et al. (2003) Herman, M.; Campargue, A.; El Idrissi, M.I.; Vander Auwera, J. Vibrational spectroscopic database on acetylene, (12C2H2, 12C2D2 and 13C2H2). J. Phys. Chem. Ref. Data 2003, 32, 921–1361.
- Herman (2007) Herman, M. The acetylene ground state saga. Mol. Phys. 2007, 105, 2217–2241.
- Jørgensen et al. (1989) Jørgensen, U.G.; Almlöf, J.; Siegbahn, P.E.M. Complete active space self-consistent field calculations of the vibrational band strengths for C3. Astrophys. J. 1989, 343, 554.
- Gorman et al. (2018a) Gorman, M.; Yurchenko, S.N.; Tennyson, J. ExoMol Molecular linelists—XXXIII. The spectrum of Chromium Hydride. Mon. Not. R. Astron. Soc. 2018, to be submitted.
- Gorman et al. (2018b) Gorman, M.; Yurchenko, S.N.; Tennyson, J. ExoMol Molecular linelists—XXXV. The spectrum of manganese hydride. Mon. Not. R. Astron. Soc. 2018, to be submitted.
- Faure et al. (2013) Faure, A.; Wiesenfeld, L.; Tennyson, J.; Drouin, B.J. Pressure broadening of water and carbon monoxide transitions by molecular hydrogen at high temperatures. J. Quant. Spectrosc. Radiat. Transf. 2013, 116, 79–86.
- Renaud et al. (2018) Renaud, C.L.; Cleghorn, K.; Hartmann, L.; Vispoel, B.; Gamache, R.R. Line shape parameters for the H2O–H2 collision system for application to exoplanet and planetary atmospheres. Icarus 2018, 306, 275–284.
- Barton et al. (2017) Barton, E.J.; Hill, C.; Czurylo, M.; Li, H.Y.; Hyslop, A.; Yurchenko, S.N.; Tennyson, J. The ExoMol diet of line-by-line pressure-broadening parameters. J. Quant. Spectrosc. Radiat. Transf. 2017, 203, 490–495.