Probing electronic excitations in iridates with resonant inelastic x-ray scattering and emission spectroscopy techniques
Abstract
We report a comprehensive resonant inelastic x-ray scattering (RIXS) study of various iridate materials focusing on core-level excitations and transitions between crystal-field split d-levels. The 2p core hole created at the Ir absorption edge has a very short lifetime giving rise to a broad absorption width ( eV). This absorption linewidth broadening can be overcome by studying the resonant x-ray emission spectroscopy (RXES) map, which is a two-dimensional intensity map of the Ir L emission obtained with high energy-resolution monochromator and analyzer. By limiting the emitted photon energy to a narrow range, one can obtain x-ray absorption spectra in the high energy-resolution fluorescence detection (HERFD) mode, while one can also simulate quasi--edge absorption spectra by integrating over incident photon energies. Both methods improve the absorption line width significantly, allowing detailed studies of unoccupied electronic structure in iridates and other transition metal compounds. On the other hand, the short lifetime of the 2p core hole benefits the study of excitations of valence electrons. We show that the incident energy dependence of the RIXS spectra for transitions is simple to understand due to the short core-hole lifetime, which validates ultra-short core-hole lifetime approximation used widely in theoretical calculations. We compared excitations in various iridates and found that the excitations between the t2g and eg states share many similarities among different materials. However, the RIXS spectra due to the transitions between the spin-orbit-split t2g levels vary widely depending on the oxidation state and electronic bandwidths.
I introduction
Resonant inelastic x-ray scattering (RIXS) has made significant contributions to understanding the physics of cuprates and iridates in the past decade. RIXS is a second-order scattering process which can be used to probe elementary excitations involving spin, orbital, charge, and lattice degrees of freedom Kotani and Shin (2001); Rueff and Shukla (2010); Ament et al. (2011). When the incident photon energy is tuned to the relevant absorption edge, the scattering cross-section of these elementary excitations receives a large resonant enhancement. Past investigations have been mostly focused on core level excitations, which is often called resonant x-ray emission spectroscopy (RXES) to emphasize the “emission” nature of excitations Schülke (2007); De Groot and Kotani (2008). However, in recent years, with improved energy resolution, RIXS has been widely used to refer to solid-state spectroscopic studies of elementary excitations such as magnons and orbital excitations Ament et al. (2011). In this article, we use RXES to denote core-level spectroscopy, and RIXS to refer to spectroscopy focused on the behavior of valence electron systems near the Fermi level (see Fig. 1).
One of the most important developments in RIXS was the recent experimental and theoretical realization of its sensitivity to spin-flip scattering processes,de Groot et al. (1998); Kuiper et al. (1998); Chiuzbăian et al. (2005); Hill et al. (2008); Ellis et al. (2010) including propagating magnon excitations Braicovich et al. (2009); Ament et al. (2009); Haverkort (2010). There have been a large number of RIXS studies of various cuprate compounds carried out at the copper edge Schlappa et al. (2009); Le Tacon et al. (2011); Schlappa et al. (2012); Dean et al. (2012, 2013a, 2013b); Dean (2015). Partially motivated by these activities, similar edge RIXS experiments were carried out to study , in which crystal field excitations between the and electronic states were observed to have a large resonance enhancement Ishii et al. (2011). However, due to poor energy resolution, it was not possible to resolve low energy electronic or magnetic excitations in this early investigation. Thanks to the improved instrumentation, the first RIXS measurements of magnetic excitations in iridates were carried out at the Advanced Photon Source in 2010 Kim et al. (2012a), which showed spectacular dispersion of both magnons and a spin-orbit exciton mode, the latter arising from the strong spin-orbit coupled magnetic degree of freedom. We note that iridium has a large neutron absorption cross-section, and studying iridates with inelastic neutron scattering is difficult. Most of the iridate neutron scattering work so far have been limited to elastic scattering.Dhital et al. (2013); Ye et al. (2012); Choi et al. (2012) As a result, collective magnetic excitations in iridates have been largely elucidated by RIXS experiments. In addition to Kim et al. (2012a), there have been a number of RIXS investigations of magnetic excitations in undoped and doped Kim et al. (2012b); Moretti Sala et al. (2015); Hogan et al. (2016); Lu et al. (2017), thin film Lupascu et al. (2014), doped Liu et al. (2016); Gretarsson et al. (2016); Pincini et al. (2017); Cao et al. (2017), superlattice of and Meyers et al. (2017), Gretarsson et al. (2013a), Donnerer et al. (2016), and Clancy et al. (2016); Chun et al. (2018).
In addition to collective magnetic excitations, RIXS is an excellent probe of broadly-defined -excitations. These are transitions between different d-orbitals, and range from highly dispersive collective excitations called orbitons to localized atomic transitions. If one only considers dipole transitions in the atomic limit, the direct to transition is forbidden optically. However, the - transition is allowed and strong in the case of RIXS. This is because in RIXS, the to transition occurs through a second order process involving a dipole allowed to transition followed by a to transition. Detailed characteristics of these excitations differ from one material to another, depending on the various energy scales, such as electron bandwidth, electron correlation, crystal field splitting, and the strength of spin-orbit coupling.
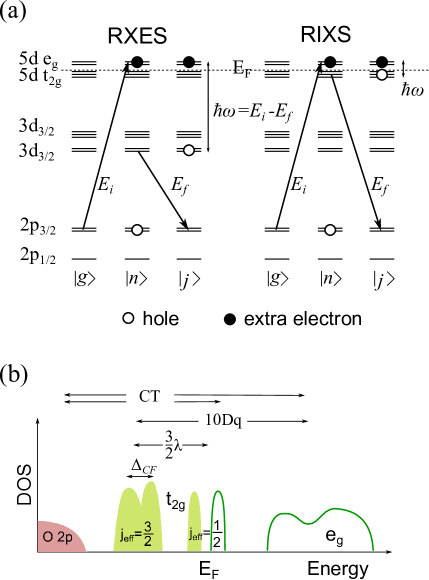
In many iridates, the octahedral crystal field is usually large enough to keep Ir4+ () ions in the low-spin state, allowing one to use isomorphism and map three t2g states to an effective state.Abragam and Pryce (1951) The spin-orbit coupling with strength acting on the manifold splits the 6 states into a half-filled doublet and a fully-filled quartet; the energy difference between these two levels is .Hozoi et al. (2014) Therefore, the nature of to excitations changes from a simple orbital transition to a transition between spin-orbit coupled states as increases. Of course, this simple atomic picture is modified in real materials, with additional distortion of the octahedra giving rise to non-cubic crystal field and further splitting the states. In particular, when there is a significant hopping between Ir, the transitions between states become a collective excitation called a spin-orbit exciton.Kim et al. (2012a) Since the exchange interaction responsible for the propagation of the spin-orbit exciton has the same origin as the magnetic exchange coupling (i.e., hopping amplitude), one observes a large dispersion of the -excitation only when magnetic exchange coupling is large. The -excitations in iridates have been extensively studied Liu et al. (2012); Gretarsson et al. (2013b); Hozoi et al. (2014); Moretti-Sala et al. (2014). In a recent RIXS study of , Kim et al. were able to extract separate dispersion for different spin-orbit exciton modes utilizing the different photon polarization dependence of these modes Kim et al. (2014).
On the theory side, an important recent development has been the advances in Ab Initio quantum chemistry calculation methods to accurately determine the excitation energy. This method was applied to , , and , which showed that description works well in the former caseGretarsson et al. (2013b), but not so well in the latter two materials Liu et al. (2012); Moretti-Sala et al. (2014). In the case of pyrochlore iridates, such as and , combined RIXS and quantum chemistry study found that non-cubic contributions to the crystal field splitting are quite significant in all pyrochlore materials studied, and the =1/2 description is somewhat questionable Hozoi et al. (2014). In addition, Hozoi et al. found that the trigonal distortion of the octahedra is not the major contributor to this non-cubic crystal field splitting in pyrochlore iridates. Rather it was found that the next nearest neighbor Ir and Eu/Y ions provide symmetry breaking field that causes the levels to split. In their recent study of layered , it was also found that the next nearest neighbors contribute significantly in determining crystal field levels in this materialBogdanov et al. (2014).
On the other hand, excitations in iridates with oxidation states other than Ir4+ have not been investigated much.Yuan et al. (2017) Materials with Ir5+ and Ir3+ oxidation state with and electronic configurations, respectively, are expected to show excitation spectra quite different from that observed for the systems mentioned above. An additional energy scale, Hund’s coupling (), needs to be considered in the case of the system, and in some cases, RIXS spectra can be analyzed to estimate both and with high precision.Yuan et al. (2017) We also expect that the study of electronic states in and configurations will shed light on the hole- or electron-doping of the state, which is drawing much attention recently.Liu et al. (2016); Gretarsson et al. (2016); Pincini et al. (2017); Cao et al. (2017) Since electronic states near the Fermi level are dominated by Ir states, hole or electron-doping of the state would be equivalent to introducing (Ir5+) or (Ir3+) states, respectively, in the ionic picture.
Despite intense interest and many RIXS investigations of iridates, a systematic study of the RIXS cross-section in various iridates, including incident energy dependence, is still lacking. Studying Ei dependence of RIXS is useful for understanding the resonant process, as shown in the case of cuprates and other transition metal compounds.Lu et al. (2006); Ghiringhelli et al. (2009); Harada et al. (2000) There have been only a limited number of incident energy dependence studies, for example, in Ishii et al. (2011), Gretarsson et al. (2013a), and Moretti-Sala et al. (2014).
Even fewer core-level RXES studies have been carried out for iridates except for Gretarsson et al. (2011). RXES can give us detailed information about the valence of Ir atoms. This is particularly important for studying mixed valence iridate compounds such as . The usual experimental method for studying oxidation state, x-ray absorption spectroscopy (XAS) is not very informative in the case of Ir edge, since core-hole lifetime effect broadens spectral features. The RXES and XAS measured using high energy-resolution fluorescence detection (HERFD) can overcome this limitation, and both of these methods are employed in the present study.
The purpose of the current work is twofold. First, we would like to focus on higher energy excitations for these compounds often ignored in previous RIXS studies, and in particular, provide a systematic view of the -excitation spectra of iridates by comparing various iridate compounds. The second purpose of the current work is to focus more on the spectroscopic aspect of iridate RIXS. Instead of focusing on momentum dependence, which is important for understanding solid-state phenomena, here we focus more on the incident energy dependence and the x-ray absorption and emission processes, which are best understood in the ionic/atomic picture. Of course, we also acknowledge that even these excitations have significant contributions from neighboring atoms and even further lying ions, as recently pointed out in Ref. Bogdanov et al., 2014, However, our interest here is a phenomenological description and for the most part, we will rely heavily on local atomic descriptions.
In the next section, we will first discuss experimental details of our spectrometer setup, and also the samples used in our study. Experimental results and discussions will be divided into two sections. First, we will present RXES and HERFD results. In the following section, RIXS data will be presented. This section will be further divided into two subsections discussing -dependence and excitations. The low energy -excitations below 1 eV have been the subject of several earlier publications, and therefore will not be discussed in detail. Due to the broad nature of the topics presented in this article, results and discussions are presented together in each subsection.
II Experimental methods
II.1 Instrumentation
The RXES experiments were carried out at the Advanced Photon Source using 9ID RIXS spectrometer, utilizing the same setup used in the previous RXES study of .Gretarsson et al. (2011) The beam was monochromatized by a double-crystal Si(111) and a Si(333) channel-cut secondary crystal to select incident photon energy near the Ir edges. A spherical (1-m-radius) diced Ge(337) analyzer was used to select final photon energy near the Ir L () emission line at 9.1 keV. The scattering plane was vertical. The overall energy resolution [full width at half maximum (FWHM)] in this configuration was about 240 meV. The XAS data using high energy-resolution fluorescence detection method (HERFD-XAS) was also collected using the same setup.
Two different experimental setups were used for the RIXS experiments at the 9ID beamline. Most of the incident energy dependence and the dd excitation spectra presented in Sec. IV were obtained using the lower-resolution setup, which was similar to the RXES setup described above, but with a Si(844) channel-cut secondary monochromator and a spherical (1-m-radius) diced Si(844) analyzer. In order to minimize the elastic background intensity, measurements were carried out in the horizontal scattering geometry, for which the scattering angle was close to 90 degrees. The overall energy resolution of about 150 meV (FWHM) was obtained. Low-lying -excitations below 1 eV were measured using a higher resolution setup. By using a better-focused x-ray beam, an overall energy resolution of 80 meV (FWHM) and a significant reduction of the elastic line could be achieved.
II.2 Samples
| Structural Motif | Ir-Ir(Å) | Form | Reference111Previous RIXS study, if any. | Note | |
|---|---|---|---|---|---|
| Ir | fcc | 2.71 | powder | commercial | |
| honeycomb | 3.45 | xtal | Ir3+ | ||
| rutile | 3.16 | powder | commercial | ||
| honeycomb | 2.98 | powder | Gretarsson et al.,2013b | ||
| square | 3.89 | xtal | Kim et al.,2012a | ||
| square | xtal | Clancy et al.,2014 | |||
| square | xtal | Clancy et al.,2014 | |||
| square | xtal | Clancy et al.,2014 | |||
| chain | 3.19 | xtal | mixed valence | ||
| pyrochlore | 3.63 | powder | Hozoi et al.,2014 | ||
| double perovskite | 5.79 | xtal | Yuan et al.,2017 | Ir5+ |
In Table 1, samples studied in this investigation are listed and relevant information for each sample is provided. We used both single crystal samples and powder samples. We found that most of the excitations studied here (with the exception of based materials) have very little momentum dependence. This is due to the small magnetic exchange energy (order of 10 meV or less), which is too small to give a sizable dispersion for excitations compared to the instrumental resolution, thereby justifying our use of polycrystalline powder samples. For example, earlier studies showed that the RIXS spectra of single crystal Na2IrO3 and are very similar to those measured using powder samples.Gretarsson et al. (2013b) Powder samples of and have been synthesized using the standard solid-state reaction method. The IrO2 and Ir metal samples are commercial samples purchased from Alfa Aesar (99.99 %) and used without further treatment.
The Ir3+ reference sample, -IrCl3, crystallizes in monoclinic structure C2/m Brodersen et al. (1965). Single crystal samples were synthesized using vacuum sublimation as described in Ref. Brodersen et al., 1965. Small dark yellow transparent crystals are used in our measurement. IrCl6 octahedra share edges to form a layer of honeycomb net, which is stacked in monoclinic fashion. This structure is rather similar to -RuCl3, which is drawing much interest due to the magnetic behavior associated with Kitaev-Heisenberg Hamiltonian Plumb et al. (2014); Sears et al. (2015); Majumder et al. (2015); Sandilands et al. (2015); Kubota et al. (2015); Kim et al. (2015); Banerjee et al. (2016). Unlike its ruthenium cousin, the Ir3+ has filled t2g states (), which makes this material a band insulator with a large insulating gap. Due to the plate-like crystal morphology, the experiment was carried out with photon polarization within the hexagonal plane.
The same single crystal sample of ordered double perovskite used in the earlier RIXS investigation was used here.Yuan et al. (2017) Details of the crystal growth was reported in Ref. Cao et al., 2014. We note that in this sample the iridium ions have Ir5+ () valence. Since non-magnetic Y3+ is placed between two Ir ions, the nearest-neighbor Ir-Ir distance in this material is much larger than that in other materials. The nearest-neighbor Ir-Ir bond lengths are compared in Table 1. Except for Ir and , Ir is connected to its neighbor Ir through O (or Cl) ligand ions, and the variation in the bond lengths just reflect the difference in the Ir-O-Ir angles in these compounds. Due to the long-range nature of hopping, we expect the hopping integral to be much suppressed in .
has been studied with RIXS quite extensively, and a comprehensive doping dependence of the low energy magnetic excitation in doped is available elsewhere Liu et al. (2016); Gretarsson et al. (2016); Pincini et al. (2017); Cao et al. (2017). The samples studied in this paper are the same samples used in earlier magnetic diffraction and transport experiments Qi et al. (2012); Clancy et al. (2014). We will present here the incident energy dependence and high energy charge excitations which have not been reported in earlier investigations. We note that the incident energy study of the undoped sample using coarse energy resolution was reported in Ref. Ishii et al., 2011.
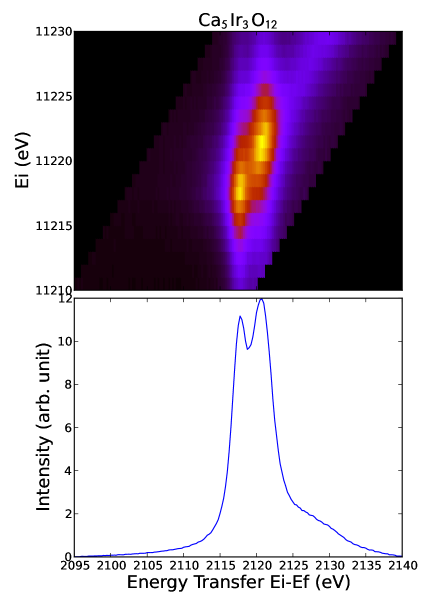
We also investigated a mixed valence compound Ca5Ir3O12 . This compound was initially identified as phase Sarkozy et al. (1974), but later structural refinements found that the correct stoichiometry is Ca5Ir3O12 and the structure is described as hexagonal with symmetry Dijksma et al. (1993); Cao et al. (2007). Single crystals were synthesized using the method reported in Ref. Cao et al., 2007. This material has a chain motif, and magnetic order was observed below about 7 K. Since the average valence of Ir in this compound is Ir4.67+, one would naively expect mixed valence of about 2/3 Ir5+ and 1/3 Ir4+. We do observe a mixture of 4+ and 5+ valence states in this compound.
III Results and discussion: RXES
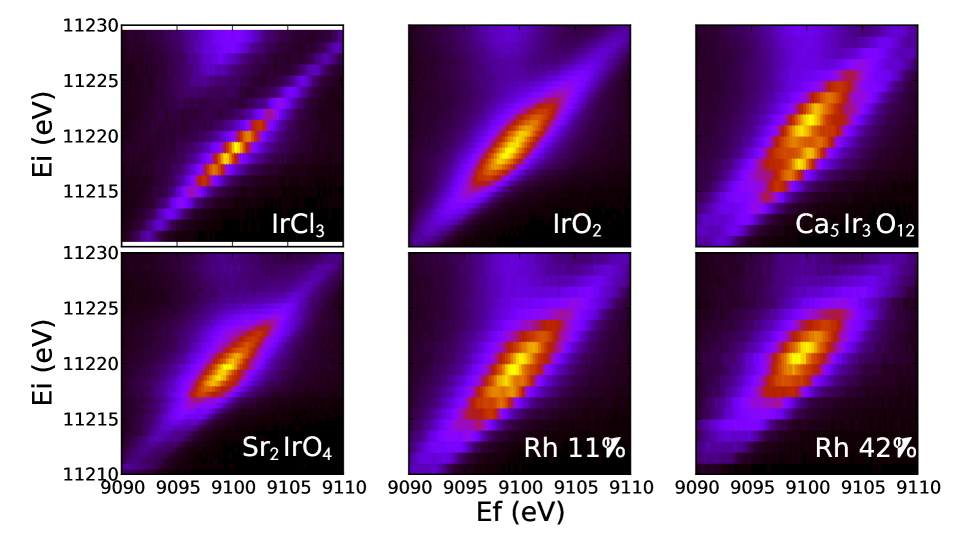
In Fig. 2, the intensity of the Ir L emission for various iridate compounds is shown as a two-dimensional map of and . De Groot and Kotani (2008) There are two major spectral features observed in this intensity map. One is an intense resonant feature with characteristic elliptical shape, and the other is a faint streak of intensity at higher values. These two features exist in all six samples, but perhaps it is easiest to see this in the case of IrO2. The difference between these two features is their dependence on . The strong feature occurs when the transferred energy () takes on a definite value, similar to the Raman shift observed in a light scattering experiment. That is, as the incident energy increases, the emission occurs at correspondingly higher energy. This results in the elliptical shape of the excitation in this vs. map, in which the slope of the major axis of the ellipse is one (i.e., 1 eV change in results in 1 eV change in ). On the other hand, the weak higher feature occurs at a constant value, and this corresponds to normal fluorescence. This type of two-feature behavior is commonly observed in RXES studies.Rueff and Shukla (2010); Döring et al. (2004) In our study, we focus only on the strongly Raman-like feature with an elliptical shape.
These RXES maps are very useful for elucidating the oxidation state of ions. One of the best known methods to study oxidation state is x-ray absorption spectroscopy (XAS), which is traditionally obtained by measuring transmission through thin samples or detecting fluorescence yield from the sample as incident photon energy is varied across the absorption edge. In the latter case, a typical solid-state detector with an energy resolution of a few hundred eV is used to detect the intensity of a particular fluorescence line, or several lines together, which is often called a fluorescence yield (FY) mode. However, both methods suffer when the absorption line width becomes extremely broad due to very short core-hole lifetime. This is the case in iridate materials; for example, the width of 2p core level in Ir is 5.25 eV, which is much broader than that of 3d transition metals like Cu (0.56 eV).Krause and Oliver (1979) As a result, the XAS spectra at Ir L-edges are very broad without clear spectral features to speak of.Clancy et al. (2012) There have been several efforts to address this shortcoming of the XAS method. In their pioneering work, Hamalainen and coworkers were able to obtain much sharper XAS spectra of Dysprosium by utilizing a high resolution analyzer to detect only emitted photons with a specific energy.Hämäläinen et al. (1991) Since then there have been numerous theoretical and experimental studies exploiting this HERFD-XAS technique.De Groot and Kotani (2008)
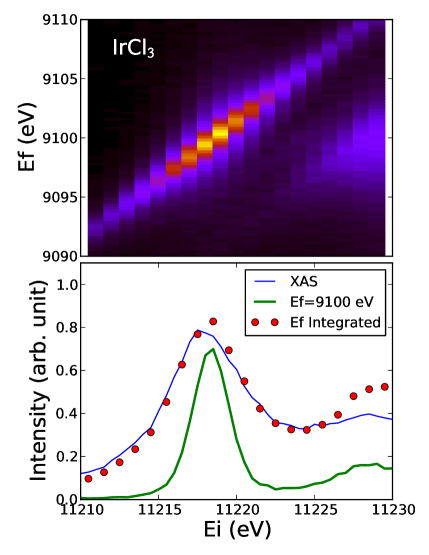
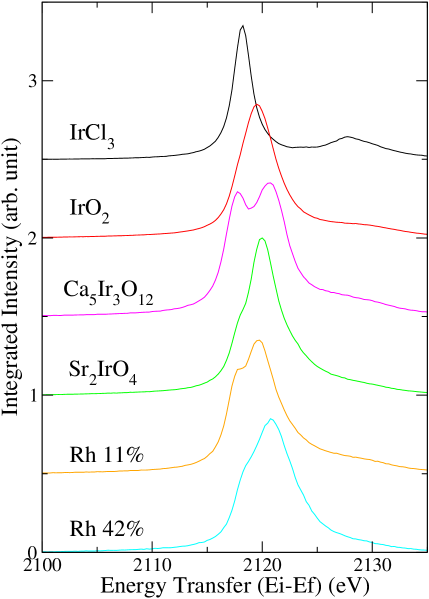
The reason why one can reduce the core-hole lifetime broadening using the high resolution analyzer method can be easily understood by inspecting the RXES map. In Fig. 3, we illustrate this using the example of IrCl3. The horizontal and vertical axes are flipped in this case to show vs. map. A typical XAS experiment using a detector with a coarse energy resolution is equivalent to having no capability of distinguishing values in this figure. To simulate regular XAS spectra we integrated over all values and plotted this in Fig. 3 as filled circles. Indeed, this result agrees very well with the XAS data obtained using a solid state detector shown as a solid line in Fig. 3(b). However, a high resolution analyzer enables one to select a particular value, and by doing so, one can reduce the apparent linewidth of the XAS spectra as shown here. If we plot only the intensity corresponding to the =9100 eV, we obtain the thick green solid line shown in Fig. 3(b). While the observed width of the integrated intensity (or the FY-XAS width) is roughly 5 eV as expected, this is reduced by about a factor of 2 in the HERFD-XAS spectrum obtained by selecting =9100 eV. This observed width of 2.7 eV is much sharper than the Ir 2p lifetime (5.25 eV) and close to the lifetime of about 2 eV as described below. In Fig. 4, we compare the XAS data for various iridate samples obtained using the HERFD method with those obtained with the normal fluorescence method.
While the normal XAS results are more or less indistinguishable from one another, the HERFD-XAS results show some interesting structures in the main absorption peak (the so-called white line). The first thing to note is the clear shift of the peak position in the case of IrCl3, which is the only compound with +3 valence. This type of edge shift in XAS is commonly observed, and used to distinguish oxidation states in mixed valence compounds. In the case of transition metal compounds, van der Laan and Kirkman showed that the shift mostly originates from the difference in the Coulomb interaction between the core hole and valence electrons. van der Laan and Kirkman (1992) Small edge shifts of order eV were observed going from Ir4+ to Ir6+ in the conventional XAS data reported by Laguna-Marco et al. on a series of Ir-based double perovskites.Laguna-Marco et al. (2015) Instead of a shift, what is clearly observed in our HERFD-XAS data on Ca5Ir3O12 and Rh-doped is the broadening of the absorption feature when Ir5+ is introduced. Note that Ca5Ir3O12 has nominally 67 % Ir5+, and some Ir5+ are also present in the Rh doped samples. If one compares these compounds to IrO2 and , both with purely +4 valence, there seems to be an additional feature on the lower energy side. For Ca5Ir3O12 , there is a clear splitting between two peaks, while Rh doped shows broadening. Although it is tempting to attribute the splitting to +4 and +5 valence, things are a little more complicated due to the large crystal field splitting of about 3 eV between the t2g and eg states as described below.
The low-energy feature (split peak or broadening due to a shoulder) originates from the increased transition probability into Ir states in Ir5+ ions. At the Ir edge, 2p3/2 core electrons are excited into empty 5d states. For IrCl3, the only available states are eg states, and the line width probably represents the eg band width in IrCl3. For Ir4+ ions, nominally one empty state becomes available (compared to 4 states per ion), and the peak becomes broader. The data indeed looks like there is a weak shoulder feature at lower energy side. As you increase Ir5+ composition, the number of empty states increases and the shoulder feature becomes more prominent. Note that at edge, there is no selection rule preventing transitions involving spin-orbit coupled states unlike at the edge.
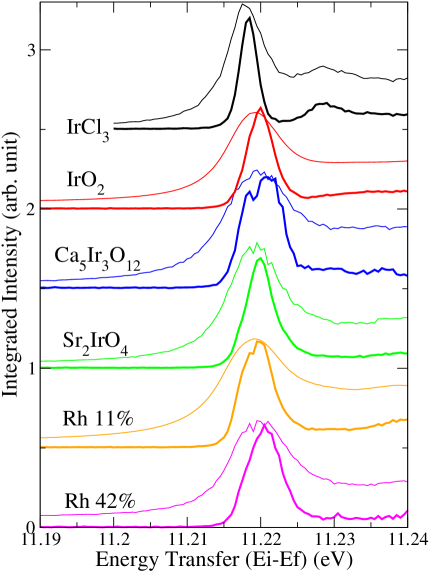
An alternative way to visualize the RXES data is to plot against the energy transferred to the system () as illustrated for Ca5Ir3O12 in Fig. 5. This intensity map clearly shows that the resonant spectral features occur at constant energy transfer. One should note that the transitions involved in this experiment are followed by . The final state of this RXES process, therefore, is identical to removing an electron from the state, which would be similar to edge XAS.222True XAS final state would have a hole in and an extra electron in states instead of states. In this case integrating over is equivalent to integration over all final states, since different corresponds to different excited (final) states of the absorption process. We can obtain “quasi” XAS spectra for the Ir edge as shown in the bottom panel by integrating over all values. This “quasi -edge” XAS shows even clearer splitting between the two peaks corresponding to transitions to t2g and eg levels. In Fig. 6, such quasi -edge XAS spectra are shown for the samples considered in this study. The information contained in this plot is equivalent to the one in Fig. 4, but the linewidths are much narrower, reflecting the lifetime of 3d electronic states. We fitted the results shown in Fig. 6 to a two-peak Lorentzian lineshape. The fitting results are listed in Table 2. The overall trend is quite similar to the HERFD-XAS data, but sharper spectral features allow one to make quantitative comparisons with future calculations. One thing we would like to comment on is the behavior of Rh doped samples seem to be somewhat anomalous, since the peaks in the Rh-11% sample are at slightly lower energy than either undoped or Rh-42% samples. In their recent investigation of the doping dependence of x-ray absorption spectra (conventional FY method), Chikara and coworkers found that the evolution of charge partitioning between Rh and Ir with Rh doping is anomalous. Specifically, Rh doping introduces holes in the Ir sites at low doping, but at high doping Rh takes up the holes and the fraction of Ir5+ ions stay below 25%. Our results may reflect this anomalous behavior, but further systematic studies are clearly needed to gain quantitative information about this.
| t2g (eV) | width (eV) | eg (eV) | width (eV) | |
|---|---|---|---|---|
| - | - | 2118.2 | 2.0 | |
| - | - | 2119.6 | 3.8 | |
| 2117.7 | 2.2 | 2120.7 | 4.0 | |
| 2118.4 | 2 | 2120.3 | 3.4 | |
| Rh 11 % | 2117.8 | 2 | 2120.0 | 3.6 |
| Rh 42 % | 2118.7 | 2 | 2121.1 | 3.8 |
IV Results and discussion: RIXS
IV.1 dependence
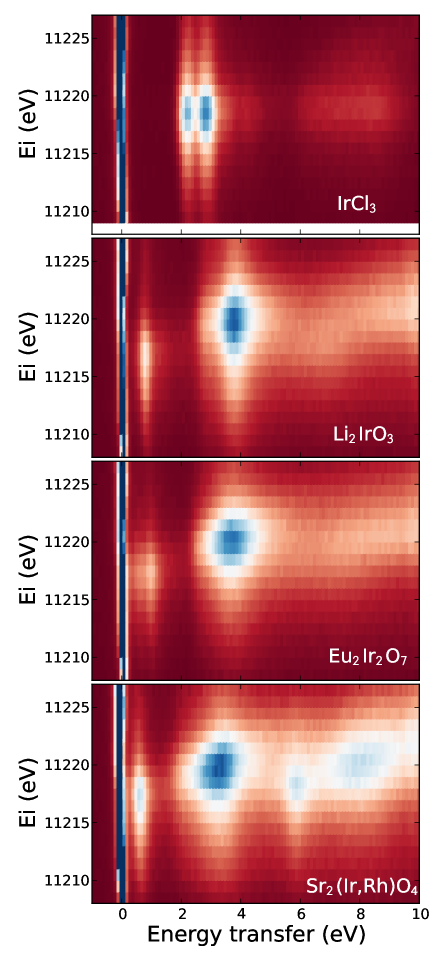
In Fig. 7, the incident energy dependence of the RIXS spectra for various iridates are shown. The RIXS intensity is measured as a function of energy transfer, which corresponds to the excitation energy of electrons in the sample. The momentum transfers are fixed for these measurements. The incident energy dependence is also easy to visualize by plotting the RIXS intensity map as shown in this figure. The intensity scale is in an arbitrary unit, since the absolute intensity comparison between different samples is difficult.
RIXS is a second order process involving an intermediate state (state in Fig. 1). RIXS intensity is usually calculated using the Kramers-Heisenberg formula:
| (1) |
where is the energy transfer, and is the intermediate state lifetime. Since the intensity is enhanced when the incident energy is tuned near the intermediate state energy (), inspection of the incident energy dependence of each excitation can help identify the particular intermediate state involved in the resonant enhancement. Since these intermediate states correspond to the final state of XAS, one can gain insight into the intermediate states by comparing the incident energy dependence and the XAS spectrum. In Sec. III, we found that the XAS spectra are composed of empty t2g and eg state contributions; the empty t2g state (XAS final, RIXS intermediate) is found about 3 eV below the main peak in the absorption spectrum.
The most intense spectral feature in the RIXS map is around eV excitation energy, which resonates around eV (the XAS peak positions in Fig. 4). This is the excitation between the t2g and eg states. For this excitation, the intermediate state would correspond to , where underline denotes having a core hole in the Ir state; then one of the t2g electrons fall to fill the core hole, and the final state would be (see Fig. 1). As mentioned in the introduction, RIXS is particularly effective in detecting this type of excitation, which is made up of allowed dipole transitions. The other excitations between d-levels, in particular the excitation between non-degenerate t2g states occurs through an intermediate state, and therefore will occur at a lower value. As one can see in Fig. 7, these intra-t2g excitations can be observed in the energy region below eV, and as expected resonate at about 3 eV lower than the resonance energy of the eg excitation. This trend is quite universal in all the samples studied, except for IrCl3, which is a system and does not have empty t2g states.
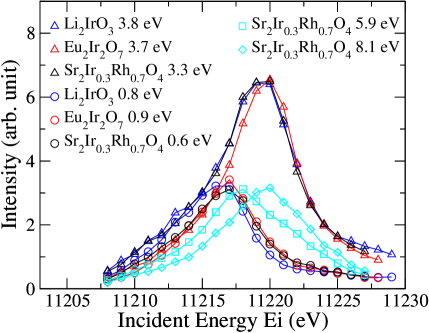
One should note that only these two states are involved in the iridate RIXS process. Even the high energy excitations observed above 6 eV show resonance behavior corresponding to the intermediate state similar to t2g or eg excitations. The origin of these higher energy excitations is unclear, but most likely due to the charge-transfer excitation from oxygen to iridium. We note that excitations in the similar energy range have been observed in the oxygen K-edge RIXS measurement of Sr2IrO4.Liu et al. (2015) The Ir3+ compound, IrCl3, does not have an empty t2g state, and the intra-t2g transitions are absent. The existence of only two resonance energies is clearly illustrated in Fig. 8, in which the dependence of the main spectral features in select samples are shown. This plot is obtained by taking vertical cuts through chosen excitation energies in Fig. 7, and plotting the intensity as a function of (exact values of are noted in the figure). There are clearly only two resonance energies, around eV and eV. This is quite a striking observation, especially when compared to the resonance behavior (observed through - map) of Cu K-edge RIXS spectra, which exhibit much more complex behavior.Kim et al. (2002); Lu et al. (2005) In Ref. Kim et al., 2007, it was pointed out that the RIXS resonance behavior depends crucially on the intrinsic width of the excitation when compared to the inverse core-hole lifetime. In most cuprate materials such as , the intrinsic charge transfer excitation energy width is of the same order as the Cu 1s lifetime of 1-2 eV, and the excitation spectra observed for Cu K-edge RIXS exhibit relatively complicated resonance behavior. In some energy regions, one can observe the resonance varies continuously with excitation energy . In contrast, Ir 2p lifetime (5 eV) is much larger than the typical width of a excitation, and we observe resonance behavior very similar to the short core-hole lifetime limit shown in Fig. 4 of Ref. Kim et al., 2007. The only exceptions are high energy excitations at =5.9 eV and 8.1 eV in the case of , which is a metallic sample. In this case, one expects drastic broadening of charge excitation widths due to mobile electrons. As a result, resonance behavior is no longer bimodal as found in other cases.
This observation brings up the issue of the response function of RIXS. In their study of RIXS cross-section, van den Brink and van Veenendaal showed that the matrix element of the RIXS cross-section can be factored out in Eq. (1), leaving charge and spin response functions that only depend on the properties of the valence electron system.van den Brink and van Veenendaal (2006) The caveat is that this approximation only holds in the limit of ultra-short core-hole lifetime, and it seems like iridates are great examples of materials where this approximation works well. Empirically, the dependence shown in Fig. 7 supports this, since the choice of the incident photon energy changes only the intensity of the peak and does not affect the peak position.
IV.2 dd Excitations
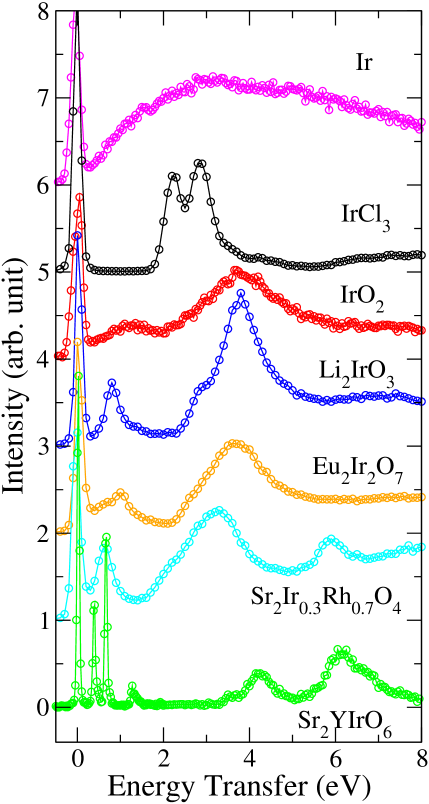
In Fig. 9, RIXS spectra for different iridate samples are compared. The incident energy was chosen to maximize the low energy intra-t2g excitations. Since the t2g to eg excitation has the rather strong intensity and broad resonance, it is also clearly visible even with the lower . Thus we regard the spectra shown in Fig. 9 as rough representatives of electronic excitations in iridate samples over a wide energy range. Only very low energy magnetic excitations cannot be resolved from the elastic line.
What is noteworthy is the difference between Ir and all the other samples. Elemental Ir, perhaps not surprisingly, does not show any spectral features other than extremely broad intensity distribution over the whole energy range probed. This type of broad excitation spectra is commonly observed in metals and includes contributions from fluorescence.Magnuson et al. (2003) The IrO2 spectrum also seems quite distinct from the other spectra. There are two broad features arising from the two types of excitations, reflecting the octahedral environment of the Ir atom in this sample. All the other samples show qualitatively similar excitation spectra made up of low energy intra-t2g excitation, t2g-eg excitation in the range of 2-5eV. There are some excitations at even higher energy above 6 eV, which may be due to multi electron transitions and/or charge transfer excitations, but we will not discuss these excitations in this paper. To aid our discussion we show a schematic representation of the density of states for an Ir4+ system in Fig. 1(c).
All intra-t2g excitations more or less fall within the energy range 0.5-1 eV. This is expected since the primary energy scale determining the t2g splitting in iridates is the spin-orbit coupling (), which does not depend much on structural details. In contrast, the excitations between the occupied t2g states and empty eg states are quite broad, reflecting the wide bandwidths due to the strong hybridization between Ir eg and oxygen 2p states. In addition to the widths, we note that the positions of the t2g-eg excitations are more or less unchanged across different materials, except for and , for which Ir has +3 and +5 nominal oxidation states, respectively. A simple electrostatic consideration can qualitatively account for this difference. Larger crystal field splitting for Ir5+ than for Ir4+ is expected since cation-anion electrostatic attraction will be stronger for more positive Ir5+ ions. This also results in shorter Ir-O bond lengths for (1.97 Å for and 2.02 Å for ). On the other hand, is expected to have weaker electrostatic interaction due to the net charge, and also due to the larger ionic size of chlorine ions. Not surprisingly the Ir-Cl bond length is much larger (2.3 Å) than Ir-O bond lengths. However, quantitative analysis beyond this simple discussion is outside the scope of this paper.
The energy scale of the t2g-eg excitation is closely related to the difference in the resonance energy of the excitations (Fig. 8) as discussed in the previous subsection. Both measure roughly the same energy scale , but there is a quantitative difference. The RIXS intermediate state (XAS final state) contains a core hole, which pulls the valence energy level down. All energy levels experience similar shifts, but because of this effect, the energy scale could be renormalized to a slightly smaller value. On the other hand, the RIXS final state does not have a core hole and therefore does not suffer from the core-hole effect. Another difference is that the x-ray absorption spectroscopy measures the splitting between the empty t2g states and the empty eg states, while RIXS measures the excitation energy between the filled t2g states and the empty eg states. Since the t2g states are only partially filled, the energy splitting measured with RIXS is larger than that measured with XAS.
Since the intra-t2g excitations below 1 eV in various Ir4+ compounds have been investigated in detail in earlier studies, we will not go into detailed discussions about these excitations. However, we would like to point out that the RIXS spectrum of , in which Ir5+ takes on electronic configuration, is very different from those of Ir4+ materials. The peak positions can be explained using the atomic model including both spin-orbit coupling and Hund’s coupling as shown in Ref. Yuan et al., 2017 However, we observe extremely sharp peak widths in this case. In fact, these peaks are resolution limited, as one can easily compare their widths with the elastic peak width. As discussed in Sec.IIB, the narrow peak widths reflect the fact that Ir in this double perovskite compound is isolated from other Ir ions due to the intervening non-magnetic Y ions. The narrow peak widths, therefore, reflects negligible hybridization and very narrow Ir d bandwidths. On the other hand, the broad width of the intra-t2g excitations in IrO2 reflects the wide metallic bandwidth in this compounds.Kahk et al. (2014)
V Conclusions
We presented RXES and RIXS spectra of iridate samples with various structures, oxidation states, and transport properties. We discussed how quantitative and detailed information about unoccupied states can be obtained using the RXES map. One way is to use high energy resolution of the analyzer to obtain HERFD-XAS spectrum, which overcomes the core-hole lifetime broadening. We also illustrated one can obtain quasi -edge absorption spectrum using hard x-rays, which could be useful for studying materials under various sample environments (e.g., diamond anvil cells, magnets, etc.).
Iridium edge RIXS spectrum is essentially dominated by electronic transitions between various 5d states, but actual spectra are extremely diverse. Our comprehensive examination reveals a few general points to take away from RIXS studies.
Resonance condition: Because of the short core-hole lifetime, the RIXS resonance condition is simplified for excitations in iridates. The strong teg transition intensity is resonantly enhanced near the peak of x-ray absorption, while the spin-orbit excitations and magnons at low energy ( eV) resonate at an incident energy about 3 eV below the absorption peak. This information is quite helpful for choosing incident energy for future experiments. Our data also demonstrates that the ultra-short core-hole lifetime approximation works very well in the insulating iridates, facilitating comparison with theoretical calculations.van den Brink and van Veenendaal (2006)
Bandwidth: The peak width is the quantity that varies the most among the iridate compounds studied here. Iridium ions in are separated by another non-magnetic ion, which makes the transitions between the spin-orbit split states well-defined atomic-like transitions. The RIXS spectra show sharp resolution limited peaks in this case. On the other hand, metallic , the RIXS peaks should be considered as interband transitions, and the peak width represents the bandwidth. In all iridates the transitions between the occupied t2g states to unoccupied eg states tend to be broad, presumably reflecting stronger hybridization between eg orbitals and oxygen orbitals.
Acknowledgements.
Research at the University of Toronto was supported by the Natural Sciences and Engineering Research Council of Canada through Discovery Grant and Research Tools and Instruments Grant. G.C. acknowledges NSF support via grant DMR-1712101. This research used resources of the Advanced Photon Source, a U.S. Department of Energy (DOE) Office of Science User Facility operated for the DOE Office of Science by Argonne National Laboratory under Contract No. DE-AC02-06CH11357.References
- Kotani and Shin (2001) A. Kotani and S. Shin, Rev. Mod. Phys. 73, 203 (2001).
- Rueff and Shukla (2010) J.-P. Rueff and A. Shukla, Rev. Mod. Phys. 82, 847 (2010).
- Ament et al. (2011) L. J. P. Ament, M. van Veenendaal, T. P. Devereaux, J. P. Hill, and J. van den Brink, Rev. Mod. Phys. 83, 705 (2011).
- Schülke (2007) W. Schülke, Electron dynamics by inelastic X-ray scattering (Oxford University Press, Oxford, 2007).
- De Groot and Kotani (2008) F. De Groot and A. Kotani, Core level spectroscopy of solids (CRC press, 2008).
- de Groot et al. (1998) F. M. F. de Groot, P. Kuiper, and G. A. Sawatzky, Phys. Rev. B 57, 14584 (1998).
- Kuiper et al. (1998) P. Kuiper, J.-H. Guo, C. Såthe, L.-C. Duda, J. Nordgren, J. J. M. Pothuizen, F. M. F. de Groot, and G. A. Sawatzky, Phys. Rev. Lett. 80, 5204 (1998).
- Chiuzbăian et al. (2005) S. G. Chiuzbăian, G. Ghiringhelli, C. Dallera, M. Grioni, P. Amann, X. Wang, L. Braicovich, and L. Patthey, Phys. Rev. Lett. 95, 197402 (2005).
- Hill et al. (2008) J. P. Hill, G. Blumberg, Y.-J. Kim, D. S. Ellis, S. Wakimoto, R. J. Birgeneau, S. Komiya, Y. Ando, B. Liang, R. L. Greene, D. Casa, and T. Gog, Phys. Rev. Lett. 100, 097001 (2008).
- Ellis et al. (2010) D. S. Ellis, J. Kim, J. P. Hill, S. Wakimoto, R. J. Birgeneau, Y. Shvyd’ko, D. Casa, T. Gog, K. Ishii, K. Ikeuchi, A. Paramekanti, and Y.-J. Kim, Phys. Rev. B 81, 085124 (2010).
- Braicovich et al. (2009) L. Braicovich, L. J. P. Ament, V. Bisogni, F. Forte, C. Aruta, G. Balestrino, N. B. Brookes, G. M. De Luca, P. G. Medaglia, F. M. Granozio, M. Radovic, M. Salluzzo, J. van den Brink, and G. Ghiringhelli, Phys. Rev. Lett. 102, 167401 (2009).
- Ament et al. (2009) L. J. P. Ament, G. Ghiringhelli, M. M. Sala, L. Braicovich, and J. van den Brink, Phys. Rev. Lett. 103, 117003 (2009).
- Haverkort (2010) M. W. Haverkort, Phys. Rev. Lett. 105, 167404 (2010).
- Schlappa et al. (2009) J. Schlappa, T. Schmitt, F. Vernay, V. N. Strocov, V. Ilakovac, B. Thielemann, H. M. Rønnow, S. Vanishri, A. Piazzalunga, X. Wang, L. Braicovich, G. Ghiringhelli, C. Marin, J. Mesot, B. Delley, and L. Patthey, Phys. Rev. Lett. 103, 047401 (2009).
- Le Tacon et al. (2011) M. Le Tacon, G. Ghiringhelli, J. Chaloupka, M. M. Sala, V. Hinkov, M. Haverkort, M. Minola, M. Bakr, K. Zhou, S. Blanco-Canosa, et al., Nature Physics 7, 725 (2011).
- Schlappa et al. (2012) J. Schlappa, K. Wohlfeld, K. Zhou, M. Mourigal, M. Haverkort, V. Strocov, L. Hozoi, C. Monney, S. Nishimoto, S. Singh, et al., Nature 485, 82 (2012).
- Dean et al. (2012) M. P. M. Dean, R. Springell, C. Monney, K. Zhou, J. Pereiro, I. Božović, B. Dalla Piazza, H. Rønnow, E. Morenzoni, J. Van Den Brink, et al., Nature materials 11, 850 (2012).
- Dean et al. (2013a) M. P. M. Dean, G. Dellea, R. Springell, F. Yakhou-Harris, K. Kummer, N. Brookes, X. Liu, Y. Sun, J. Strle, T. Schmitt, et al., Nature materials 12, 1019 (2013a).
- Dean et al. (2013b) M. P. M. Dean, A. J. A. James, R. S. Springell, X. Liu, C. Monney, K. J. Zhou, R. M. Konik, J. S. Wen, Z. J. Xu, G. D. Gu, V. N. Strocov, T. Schmitt, and J. P. Hill, Phys. Rev. Lett. 110, 147001 (2013b).
- Dean (2015) M. Dean, Journal of Magnetism and Magnetic Materials 376, 3 (2015), pseudogap, Superconductivity and Magnetism.
- Ishii et al. (2011) K. Ishii, I. Jarrige, M. Yoshida, K. Ikeuchi, J. Mizuki, K. Ohashi, T. Takayama, J. Matsuno, and H. Takagi, Phys. Rev. B 83, 115121 (2011).
- Kim et al. (2012a) J. Kim, D. Casa, M. H. Upton, T. Gog, Y.-J. Kim, J. F. Mitchell, M. van Veenendaal, M. Daghofer, J. van den Brink, G. Khaliullin, and B. J. Kim, Phys. Rev. Lett. 108, 177003 (2012a).
- Dhital et al. (2013) C. Dhital, T. Hogan, Z. Yamani, C. de la Cruz, X. Chen, S. Khadka, Z. Ren, and S. D. Wilson, Phys. Rev. B 87, 144405 (2013).
- Ye et al. (2012) F. Ye, S. Chi, H. Cao, B. C. Chakoumakos, J. A. Fernandez-Baca, R. Custelcean, T. F. Qi, O. B. Korneta, and G. Cao, Phys. Rev. B 85, 180403 (2012).
- Choi et al. (2012) S. K. Choi, R. Coldea, A. N. Kolmogorov, T. Lancaster, I. I. Mazin, S. J. Blundell, P. G. Radaelli, Y. Singh, P. Gegenwart, K. R. Choi, S.-W. Cheong, P. J. Baker, C. Stock, and J. Taylor, Phys. Rev. Lett. 108, 127204 (2012).
- Kim et al. (2012b) J. Kim, A. H. Said, D. Casa, M. H. Upton, T. Gog, M. Daghofer, G. Jackeli, J. van den Brink, G. Khaliullin, and B. J. Kim, Phys. Rev. Lett. 109, 157402 (2012b).
- Moretti Sala et al. (2015) M. Moretti Sala, V. Schnells, S. Boseggia, L. Simonelli, A. Al-Zein, J. G. Vale, L. Paolasini, E. C. Hunter, R. S. Perry, D. Prabhakaran, A. T. Boothroyd, M. Krisch, G. Monaco, H. M. Rønnow, D. F. McMorrow, and F. Mila, Phys. Rev. B 92, 024405 (2015).
- Hogan et al. (2016) T. Hogan, R. Dally, M. Upton, J. P. Clancy, K. Finkelstein, Y.-J. Kim, M. J. Graf, and S. D. Wilson, Phys. Rev. B 94, 100401 (2016).
- Lu et al. (2017) X. Lu, D. E. McNally, M. Moretti Sala, J. Terzic, M. H. Upton, D. Casa, G. Ingold, G. Cao, and T. Schmitt, Phys. Rev. Lett. 118, 027202 (2017).
- Lupascu et al. (2014) A. Lupascu, J. P. Clancy, H. Gretarsson, Z. Nie, J. Nichols, J. Terzic, G. Cao, S. S. A. Seo, Z. Islam, M. H. Upton, J. Kim, D. Casa, T. Gog, A. H. Said, V. M. Katukuri, H. Stoll, L. Hozoi, J. van den Brink, and Y.-J. Kim, Physical Review Letters 112 (2014), 10.1103/PhysRevLett.112.147201.
- Liu et al. (2016) X. Liu, M. P. M. Dean, Z. Y. Meng, M. H. Upton, T. Qi, T. Gog, Y. Cao, J. Q. Lin, D. Meyers, H. Ding, G. Cao, and J. P. Hill, Phys. Rev. B 93, 241102 (2016).
- Gretarsson et al. (2016) H. Gretarsson, N. H. Sung, J. Porras, J. Bertinshaw, C. Dietl, J. A. N. Bruin, A. F. Bangura, Y. K. Kim, R. Dinnebier, J. Kim, A. Al-Zein, M. Moretti Sala, M. Krisch, M. Le Tacon, B. Keimer, and B. J. Kim, Phys. Rev. Lett. 117, 107001 (2016).
- Pincini et al. (2017) D. Pincini, J. G. Vale, C. Donnerer, A. de la Torre, E. C. Hunter, R. Perry, M. Moretti Sala, F. Baumberger, and D. F. McMorrow, Phys. Rev. B 96, 075162 (2017).
- Cao et al. (2017) Y. Cao, X. Liu, W. Xu, W.-G. Yin, D. Meyers, J. Kim, D. Casa, M. H. Upton, T. Gog, T. Berlijn, G. Alvarez, S. Yuan, J. Terzic, J. M. Tranquada, J. P. Hill, G. Cao, R. M. Konik, and M. P. M. Dean, Phys. Rev. B 95, 121103 (2017).
- Meyers et al. (2017) D. Meyers, Y. Cao, G. Fabbris, N. J. Robinson, L. Hao, C. Frederick, N. Traynor, J. Yang, J. Lin, M. H. Upton, D. Casa, J.-W. Kim, T. Gog, E. Karapetrova, Y. Choi, D. Haskel, P. J. Ryan, L. Horak, X. Liu, J. Liu, and M. P. M. Dean, e-print arXiv:1707.08910 (2017).
- Gretarsson et al. (2013a) H. Gretarsson, J. P. Clancy, Y. Singh, P. Gegenwart, J. P. Hill, J. Kim, M. H. Upton, A. H. Said, D. Casa, T. Gog, and Y.-J. Kim, Phys. Rev. B 87, 220407 (2013a).
- Donnerer et al. (2016) C. Donnerer, M. C. Rahn, M. M. Sala, J. G. Vale, D. Pincini, J. Strempfer, M. Krisch, D. Prabhakaran, A. T. Boothroyd, and D. F. McMorrow, Phys. Rev. Lett. 117, 037201 (2016).
- Clancy et al. (2016) J. P. Clancy, H. Gretarsson, E. K. H. Lee, D. Tian, J. Kim, M. H. Upton, D. Casa, T. Gog, Z. Islam, B.-G. Jeon, K. H. Kim, S. Desgreniers, Y. B. Kim, S. J. Julian, and Y.-J. Kim, Phys. Rev. B 94, 024408 (2016).
- Chun et al. (2018) S. H. Chun, B. Yuan, D. Casa, J. Kim, C.-Y. Kim, Z. Tian, Y. Qiu, S. Nakatsuji, and Y.-J. Kim, Phys. Rev. Lett. 120, 177203 (2018).
- Abragam and Pryce (1951) A. Abragam and M. H. L. Pryce, Proceedings of the Royal Society of London A: Mathematical, Physical and Engineering Sciences 205, 135 (1951).
- Hozoi et al. (2014) L. Hozoi, H. Gretarsson, J. P. Clancy, B.-G. Jeon, B. Lee, K. H. Kim, V. Yushankhai, P. Fulde, D. Casa, T. Gog, J. Kim, A. H. Said, M. H. Upton, Y.-J. Kim, and J. van den Brink, Phys. Rev. B 89, 115111 (2014).
- Liu et al. (2012) X. Liu, V. M. Katukuri, L. Hozoi, W.-G. Yin, M. P. M. Dean, M. H. Upton, J. Kim, D. Casa, A. Said, T. Gog, T. F. Qi, G. Cao, A. M. Tsvelik, J. van den Brink, and J. P. Hill, Phys. Rev. Lett. 109, 157401 (2012).
- Gretarsson et al. (2013b) H. Gretarsson, J. P. Clancy, X. Liu, J. P. Hill, E. Bozin, Y. Singh, S. Manni, P. Gegenwart, J. Kim, A. H. Said, D. Casa, T. Gog, M. H. Upton, H.-S. Kim, J. Yu, V. M. Katukuri, L. Hozoi, J. van den Brink, and Y.-J. Kim, Phys. Rev. Lett. 110, 076402 (2013b).
- Moretti-Sala et al. (2014) M. Moretti-Sala, K. Ohgushi, A. Al-Zein, Y. Hirata, G. Monaco, and M. Krisch, Phys. Rev. Lett. 112, 176402 (2014).
- Kim et al. (2014) J. Kim, M. Daghofer, A. H. Said, T. Gog, J. van den Brink, G. Khaliullin, and B. J. Kim, Nat. Comm. 5, 4453 (2014).
- Bogdanov et al. (2014) N. A. Bogdanov, V. M. Katukuri, J. Romhanyi, V. Yushankhai, V. Kataev, B. Büchner, J. van den Brink, and L. Hozoi, Nat. Comm. 6, 7306 (2014).
- Yuan et al. (2017) B. Yuan, J. P. Clancy, A. M. Cook, C. M. Thompson, J. Greedan, G. Cao, B. C. Jeon, T. W. Noh, M. H. Upton, D. Casa, T. Gog, A. Paramekanti, and Y.-J. Kim, Phys. Rev. B 95, 235114 (2017).
- Lu et al. (2006) L. Lu, J. N. Hancock, G. Chabot-Couture, K. Ishii, O. P. Vajk, G. Yu, J. Mizuki, D. Casa, T. Gog, and M. Greven, Phys. Rev. B 74, 224509 (2006).
- Ghiringhelli et al. (2009) G. Ghiringhelli, A. Piazzalunga, C. Dallera, T. Schmitt, V. N. Strocov, J. Schlappa, L. Patthey, X. Wang, H. Berger, and M. Grioni, Phys. Rev. Lett. 102, 027401 (2009).
- Harada et al. (2000) Y. Harada, T. Kinugasa, R. Eguchi, M. Matsubara, A. Kotani, M. Watanabe, A. Yagishita, and S. Shin, Phys. Rev. B 61, 12854 (2000).
- Gretarsson et al. (2011) H. Gretarsson, J. Kim, D. Casa, T. Gog, K. R. Choi, S. W. Cheong, and Y.-J. Kim, Phys. Rev. B 84, 125135 (2011).
- Clancy et al. (2014) J. P. Clancy, A. Lupascu, H. Gretarsson, Z. Islam, Y. F. Hu, D. Casa, C. S. Nelson, S. C. LaMarra, G. Cao, and Y.-J. Kim, Phys. Rev. B 89, 054409 (2014).
- Brodersen et al. (1965) K. Brodersen, F. Moers, and H. Schnering, Naturwissenschaften 52, 205 (1965).
- Plumb et al. (2014) K. W. Plumb, J. P. Clancy, L. J. Sandilands, V. V. Shankar, Y. F. Hu, K. S. Burch, H.-Y. Kee, and Y.-J. Kim, Physical Review B 90 (2014), 10.1103/PhysRevB.90.041112.
- Sears et al. (2015) J. A. Sears, M. Songvilay, K. W. Plumb, J. P. Clancy, Y. Qiu, Y. Zhao, D. Parshall, and Y.-J. Kim, Physical Review B 91 (2015), 10.1103/PhysRevB.91.144420.
- Majumder et al. (2015) M. Majumder, M. Schmidt, H. Rosner, A. A. Tsirlin, H. Yasuoka, and M. Baenitz, Phys. Rev. B 91, 180401 (2015).
- Sandilands et al. (2015) L. J. Sandilands, Y. Tian, K. W. Plumb, Y.-J. Kim, and K. S. Burch, Physical Review Letters 114 (2015), 10.1103/PhysRevLett.114.147201.
- Kubota et al. (2015) Y. Kubota, H. Tanaka, T. Ono, Y. Narumi, and K. Kindo, Phys. Rev. B 91, 094422 (2015).
- Kim et al. (2015) H.-S. Kim, V. S. V., A. Catuneanu, and H.-Y. Kee, Phys. Rev. B 91, 241110 (2015).
- Banerjee et al. (2016) A. Banerjee, C. A. Bridges, J.-Q. Yan, A. A. Aczel, L. Li, M. B. Stone, G. E. Granroth, M. D. Lumsden, Y. Yiu, J. Knolle, S. Bhattacharjee, D. L. Kovrizhin, R. Moessner, D. A. Tennant, D. G. Mandrus, and S. E. Nagler, Nat. Mater. (2016).
- Cao et al. (2014) G. Cao, T. F. Qi, L. Li, J. Terzic, S. J. Yuan, L. E. DeLong, G. Murthy, and R. K. Kaul, Phys. Rev. Lett. 112, 056402 (2014).
- Qi et al. (2012) T. F. Qi, O. B. Korneta, L. Li, K. Butrouna, V. S. Cao, X. Wan, P. Schlottmann, R. K. Kaul, and G. Cao, Phys. Rev. B 86, 125105 (2012).
- Sarkozy et al. (1974) R. F. Sarkozy, C. W. Moeller, and B. L. Chamberland, J. Solid State Chem. 9, 242 (1974).
- Dijksma et al. (1993) F. J. J. Dijksma, J. F. Vente, E. Frikkee, and D. J. W. IJdo, Mat. Res. Bull. 28, 1145 (1993).
- Cao et al. (2007) G. Cao, V. Durairaj, S. Chikara, S. Parkin, and P. Schlottmann, Phys. Rev. B 75, 134402 (2007).
- Döring et al. (2004) G. Döring, C. Sternemann, A. Kaprolat, A. Mattila, K. Hämäläinen, and W. Schülke, Phys. Rev. B 70, 085115 (2004).
- Krause and Oliver (1979) M. O. Krause and J. H. Oliver, J. Phys. Chem. Ref. Data 8, 329 (1979).
- Clancy et al. (2012) J. P. Clancy, N. Chen, C. Y. Kim, W. F. Chen, K. W. Plumb, B. C. Jeon, T. W. Noh, and Y.-J. Kim, Phys. Rev. B 86, 195131 (2012).
- Hämäläinen et al. (1991) K. Hämäläinen, D. P. Siddons, J. B. Hastings, and L. E. Berman, Phys. Rev. Lett. 67, 2850 (1991).
- van der Laan and Kirkman (1992) G. van der Laan and I. W. Kirkman, Journal of Physics: Condensed Matter 4, 4189 (1992).
- Laguna-Marco et al. (2015) M. A. Laguna-Marco, P. Kayser, J. A. Alonso, M. J. Martínez-Lope, M. van Veenendaal, Y. Choi, and D. Haskel, Phys. Rev. B 91, 214433 (2015).
- Note (1) True XAS final state would have a hole in and an extra electron in states instead of states.
- Liu et al. (2015) X. Liu, M. P. M. Dean, J. Liu, S. G. Chiuzbăian, N. Jaouen, A. Nicolaou, W. G. Yin, C. R. Serrao, R. Ramesh, H. Ding, and J. P. Hill, Journal of Physics: Condensed Matter 27, 202202 (2015).
- Kim et al. (2002) Y.-J. Kim, J. Hill, C. Burns, S. Wakimoto, R. Birgeneau, D. Casa, T. Gog, and C. Venkataraman, Physical Review Letters 89, 177003 (2002).
- Lu et al. (2005) L. Lu, G. Chabot-Couture, X. Zhao, J. Hancock, N. Kaneko, O. Vajk, G. Yu, S. Grenier, Y. Kim, D. Casa, T. Gog, and M. Greven, Physical Review Letters 95, 217003 (2005).
- Kim et al. (2007) Y.-J. Kim, J. P. Hill, S. Wakimoto, R. J. Birgeneau, F. C. Chou, N. Motoyama, K. M. Kojima, S. Uchida, D. Casa, and T. Gog, Physical Review B 76, 155116 (2007).
- van den Brink and van Veenendaal (2006) J. van den Brink and M. van Veenendaal, EPL (Europhysics Letters) 73, 121 (2006).
- Magnuson et al. (2003) M. Magnuson, J.-E. Rubensson, A. Föhlisch, N. Wassdahl, A. Nilsson, and N. Mårtensson, Phys. Rev. B 68, 045119 (2003).
- Kahk et al. (2014) J. M. Kahk, C. G. Poll, F. E. Oropeza, J. M. Ablett, D. Céolin, J.-P. Rueff, S. Agrestini, Y. Utsumi, K. D. Tsuei, Y. F. Liao, F. Borgatti, G. Panaccione, A. Regoutz, R. G. Egdell, B. J. Morgan, D. O. Scanlon, and D. J. Payne, Phys. Rev. Lett. 112, 117601 (2014).