Enhanced atomic gas fractions in recently merged galaxies: quenching is not a result of post-merger gas exhaustion.
Abstract
We present a detailed assessment of the global atomic hydrogen gas fraction (=log[MHI/M⋆]) in a sample of post-merger galaxies identified in the Sloan Digital Sky Survey (SDSS). Archival H i measurements of 47 targets are combined with new Arecibo observations of a further 51 galaxies. The stellar mass range of the post-merger sample, our observing strategy, detection thresholds and data analysis procedures replicate those of the extended GALEX Arecibo SDSS Survey (xGASS) which can therefore be used as a control sample. Our principal results are: 1) The post-merger sample shows a 50 per cent higher H i detection fraction compared with xGASS; 2) Accounting for non-detections, the median atomic gas fraction of the post-merger sample is larger than the control sample by 0.3 – 0.6 dex; 3) The median atomic gas fraction enhancement (), computed on a galaxy-by-galaxy basis at fixed stellar mass, is 0.51 dex. Our results demonstrate that recently merged galaxies are typically a factor of 3 more H i rich than control galaxies of the same M⋆. If the control sample is additionally matched in star formation rate, the median H i excess is reduced to = 0.2 dex, showing that the enhanced atomic gas fractions in post-mergers are not purely a reflection of changes in star formation activity. We conclude that merger-induced starbursts and outflows do not lead to prompt quenching via exhaustion/expulsion of the galactic gas reservoirs. Instead, we propose that if star formation ceases after a merger, it is more likely due to an enhanced turbulence which renders the galaxy unable to effectively form new stars.
keywords:
galaxies: interactions, galaxies: ISM, galaxies: peculiar1 Introduction
It is now well established that galaxy-galaxy interactions can have a profound effect on both the gas and stellar content of their participants. Boosts in star formation, enhanced nuclear accretion, morphological distortions and re-distribution of metals are both predicted by simulations (e.g. Di Matteo et al. 2007; Cox et al. 2008; Perez, Michel-Dansac & Tissera 2011; Torrey et al. 2012; Moreno et al. 2015; Capelo et al. 2015; Bustamante et al. 2018; Blecha et al. 2018) and confirmed by observations (e.g. Woods & Geller 2007; Ellison et al. 2008, 2011, 2013; Scudder et al. 2012; Satyapal et al. 2014; Patton et al. 2016; Weston et al. 2017; Goulding et al. 2018). However, much less is known about the detailed gas physics of interacting galaxies, and how the budget of the different gas phases evolves during the merger, with limited insight from simulations and obsevations alike.
Perhaps the most well known effect on the galactic gas content studied in merger simulations is the central concentration that results from tidal torques (Mihos & Hernquist 1994; 1996). As a result of the internal asymmetries and instabilities caused by the gravitational interaction, gas inflows dilute the central gas-phase metallicity (Montuori et al. 2010; Perez et al. 2011; Rupke et al. 2010; Torrey et al. 2012; Bustamante et al. 2018). Moreover, Hani et al. (2018) have recently used a zoom-in simulation of an approximately equal mass merger to show that interactions can additionally impact their outer gas reservoirs. By considering the circumgalactic medium (CGM) out to 150 kpc, Hani et al. (2018) find a significant increase in the hydrogen covering fraction, characteristic gas halo size and metallicity that can endure several Gyrs after the merger is complete. The emerging picture from these merger simulations is thus that interactions can both funnel gas inwards, and re-distribute material into the CGM.
Despite the progress of these theoretical works, relatively few studies have attempted to compile a detailed accounting of the multi-phase gas budget throughout the merger process. Although a few cosmological simulations have found an enhanced H i fraction in either paired (Tonnesen & Cen 2012) or post-merger (Rafieferantsoa et al. 2015) galaxies, these simulations lack the spatial resolution to trace the detailed physics of the interstellar medium (ISM). The technical challenges in such an endevour are significant, both in the implementation of the complex physical processes occuring in the ISM and also resolving the scales on which these processes occur (e.g. Teyssier et al. 2010; Renaud et al. 2014).
Most previous high resolution simulations have been run on single interactions, which precludes a statistical study. Moreno et al. (2018) have recently made progress in this regard by simulating a suite of galaxy mergers that incorporate the state-of-the-art Feedback In Realistic Environments 2 (FIRE-2) code (Hopkins et al. 2018). These simulations are run at a resolution sufficient to resolve the processes of both star formation (at the level of giant molecular clouds) and its energy feedback111For reference, the FIRE-2 merger simulations have mass resolution M⊙, a minimum softening of 10 pc and a minimum temperature of 10K. See Moreno et al. (2018) for more details.. Moreno et al. (2018) have shown that the balance of gas in different phases (ionized, atomic and molecular) undergoes a complex exchange through different times of the merger. Nonetheless, they conclude that the net result of these reactions is a boost in the molecular gas mass in the interaction phase, that is predominantly fuelled from the atomic gas reservoir. However, the atomic reservoir can be simultaneously replenished from gas that cools from the ionized phase. Over most of the interaction the combined effect of conversion of atomic gas into molecular and cooling of ionized gas into the atomic phase balance out, leading to only a very small increase ( 5 per cent) in the H i mass (averaged across the simulation suite).
On the observational side, numerous works have mapped the atomic (e.g. Hibbard & Yun 1999; Koribalski & Dickey 2004; Manthey et al. 2008a, b; Fernandez et al. 2010) or molecular (e.g. Tacconi et al. 1999; Aalto et al., 2001; Yun & Hibbard 2001; Wang et al. 2004) gas content of individual merging galaxies. Such studies regularly find that gas is re-distributed during the merger, which results in both tidal tails and central molecular gas concentations (e.g. Hibbard & van Gorkom 1996; Georgakakis et al. 2000; Ueda et al. 2014; Yamashita et al. 2017). However, fewer studies have previously attempted to statistically compare the gas content of mergers (either selected to be close pairs or single coalesced post-merger galaxies) with that of the non-interacting population.
Investigations of the statistical gas content of mergers have generally supported the predicted boost in the molecular gas content of galaxy mergers (e.g. Braine & Combes 1993; Combes et al. 1994; Casasola, Bettoni & Galletta 2004; Larson et al. 2016), but also found shorter molecular gas depletion times (molecular gas mass/SFR), due to the enhanced SFRs (e.g. Solomon & Sage 1988; Georgakakis et al. 2000; Saintonge et al. 2012; Michiyama et al. 2016). However, these studies are potentially undermined by various technical limitations, such as sample size, lack of a well matched control sample and assumptions of single or bimodal CO-to-H2 conversion factors in interacting and isolated galaxies. In a pair of companion papers, Violino et al. (2018) and Sargent et al. (in prep) study the molecular gas fraction in pairs and post-mergers respectively, with physically motivated (continuous) conversion factors and a carefully matched control sample whose H2 masses were computed with identical procedures, e.g. aperture corrections and conversion factors. After these rigourous experimental procedures, the works of Violino et al. (2018) and Sargent et al. (in prep) robustly confirm the enhanced molecular gas fractions in pairs (by 0.4 dex) and post-mergers (by 0.6 dex), respectively (at fixed stellar mass). The observed H2 enhancement is in qualitative agreement with the simulations of Moreno et al. (2018), although the 27 orbital variations of a 1:2.5 mass merger yield a more modest median molecular gas fraction enhancement of 0.1 dex.
However, the situation for the experimental measurement of the atomic gas content remains incomplete and more contentious. Again, although studies of the atomic gas content of mergers (pairs or post-mergers) have been performed, experimental problems remain due to either small sample size, lack of a robust control sample, accounting for multiple galaxies in a large telescope beam or shallow survey depth. As a result, apparently conflicting results have been reported, with some studies finding little difference between the H i gas fraction (log = log [MHI/M⋆] 222Although we will also discuss molecular gas fractions in this paper, refers to the atomic gas fraction unless otherwise stated.) in mergers and non-mergers (e.g. Braine & Combes 1993; Ellison et al. 2015; Stierwalt et al. 2015; Zuo et al. 2018) and others claiming an enhanced (Casasola et al. 2004; Huchtmeier et al. 2008; Jaskot et al. 2015), or decreased atomic content (Hibbard & van Gorkom 1996).
In the work presented here, we attempt to tackle several of the short-comings encountered by previous studies of the H i gas content of galaxy mergers and resolve the controversy of their atomic gas fractions. First, we identify a sample of galaxies in the post-coalescence phase (hereafter, post-mergers) so that it is not necessary to account for the combined contribution of two galaxies’ 21 cm emission in the large Arecibo beam. Second, we significantly enlarge previous observational samples - our final sample consists of observations for 98 post-mergers, compared to the statistical sample of 37 in our previous work (Ellison et al. 2015). Finally, and potentially most importantly, the study presented here is sensitive to much lower atomic gas fractions than presented in Ellison et al (2015). The depth of our earlier work was dictated by the comparison of H i gas fractions in mergers with those of a control sample taken from the Arecibo Legacy Fast ALFA (ALFALFA) survey (Giovanelli et al. 2005). However, since ALFALFA is a relatively shallow 21 cm survey, it provides 21 cm detections only for the most H i gas-rich galaxies at a given stellar mass. In the work presented here, our observations are designed to achieve the much deeper 21 cm sensitivity of the GALEX Arecibo SDSS Survey (GASS; Catinella et al. 2010, 2013) and its low mass extension, which together make up the extended GASS sample (xGASS; Catinella et al. 2018). The xGASS survey contains 1200 galaxies with measurements of that are sensitive to a few per cent over a mass range 9.0 log M 11.5. The xGASS survey therefore represents an excellent control sample, being both sensitive, large and spanning a broad range of stellar masses.
The paper is laid out as follows. In Sec. 2 we describe our survey strategy and the identification of post-mergers. Observations performed at the Arecibo telescope, and their data reduction, are described in Sec. 3. Our results are presented and discussed in Sec 4 and 5 respectively, and our conclusions are summarized in Sec. 6. We adopt a cosmology in which H0=70 km/s/Mpc, =0.3, =0.7.
2 Survey strategy and sample selection
The principal defining strategy of our sample selection and observations is to follow the procedures of the xGASS survey (Catinella et al. 2018). The H i detection threshold is designed to replicate that of xGASS and the data reduction and analysis procedures are identical (see Sec. 3 for more details). The sample of post-mergers selected for this work is therefore chosen to simultaneously take advantage of extant archival HI measurements but also permit an unbiased comparison with xGASS.
In order to select our sample of post-mergers, we begin by compiling candidates from three sources. The first is the post-merger catalog compiled by Darg et al. (2010) from Galaxy Zoo with further visual classification performed by Ellison et al. (2013) to remove suspect cases. The final Galaxy Zoo sample contains 100 post-mergers (see Ellison et al. 2013 for more details). To this we add a further 113 galaxies based on the visual classifications of Nair & Abraham (2010); any duplicates with the Galaxy Zoo sample are removed. We apply a redshift () and declination ( deg) cut to both the Galaxy Zoo and Nair & Abraham (2010) samples in order to define a target list that is readily observable from Arecibo, which reduces the sample from 213 to only 37.
In order to increase the sample size, we turn to the quantitative morphological classifications of Simard et al. (2011). All galaxies within the Arecibo declination and redshift cut defined above, and with Simard et al. (2011) -band asymmetries 0.05 are visually inspected, which yields a further 114 post-merger galaxies. The post-merger parent sample is therefore a combination of the Galaxy Zoo, Nair & Abraham (2010) and asymmetry-selected samples and contains 151 post-mergers, all of which should be readily observable from Arecibo, based on cuts of redshift and declination.
Three further cuts are made to the combined post-merger sample in order to achieve an unbiased survey design that can be compared with a control sample selected from xGASS. First, SDSS images of galaxies in the post-merger sample are visually checked for companions within 1 arcmin of the primary target, in order to avoid potential contamination in the Arecibo beam. Second, since we will assess the gas fraction in post-mergers via a quantitative comparison with the xGASS survey, whose survey limit is log M 9.0 M⊙, we remove any post-mergers less massive than this threshold. Finally, we set a survey footprint that is bounded not only by Arecibo observing limits, but also by our observing time allocation (Sec. 3). Thus, in addition to the declination limits described above, we also require that the right ascension lies in the range 10 17 hours333The vast majority of the post-merger sample lies in this range to start with: only 9 galaxies are removed in the right ascension cut..
In summary, the final post-merger sample is defined by cuts in stellar mass (log M 9.0 M⊙), declination ( deg), right ascension (10 17 hours) and redshift () and contains 107 targets.
Archival observations exist for 47/107 of the post-mergers in our final sample. 36 H i detections are found in the ALFALFA survey (Haynes et al. 2011 and the 70 data release444http://egg.astro.cornell.edu/alfalfa/data/index.php), 6 detections from Springob et al. (2005), two detections in Ellison et al. (2015) and three galaxies were targetted as part of the xGASS sample, of which two are detections and one yields an upper limit. Since our survey strategy is to replicate the depth of the xGASS survey, the xGASS non-detection was not re-observed. We do not attempt to expand the post-merger sample by adding archival observations outside of our defined sample. Doing so has the potential to bias gas fractions if previous surveys have not followed the same consistent depth and survey strategy.
3 Arecibo observations
Accounting for the 47 previously observed post-mergers leaves 60 additional targets requiring new observations. Since the sample is selected within the right ascension criterion 10 17 hours, all unobserved galaxies could be targeted with a single 32 hour Arecibo proposal concentrated on the Spring sky, with observation blocks spread between January and April 2017.
Our objective was to replicate the observing strategy of the xGASS survey, sampling galaxies randomly selected from the SDSS down to a stellar mass limit of log M⋆ = 9.0 M⊙. The GASS survey has an atomic gas fraction limit of 1.5 percent at log M 10.5 M⊙ and reaches a fixed log MHI = 8.7 at stellar masses down to log M 10.0 (Catinella et al. 2010). The low mass extension to GASS also aims to achieve atomic gas fraction detections down to a few per cent, although with a slightly different set of mass dependent criteria (see Catinella et al. 2018). The design of our post-merger observations aimed to achieve similar depths to xGASS such that detection fractions and average atomic gas fractions could be fairly compared.
In practice, 51/60 of the previously unobserved post-mergers in our sample were observed, with insufficient time to complete the final 9 targets. The 9 unobserved targets represent a random subset.
The Arecibo observations were carried out in six sessions, between January and April 2017, with 32 hours allocated under program A3117 (PI Ellison). We observed remotely in standard position-switching mode, using the L-band wide receiver and the interim correlator as a backend. Two correlator boards with 12.5 MHz bandwidth, one polarization, and 2048 channels per spectrum (yielding a velocity resolution of 1.4 km s-1 at 1370 MHz before smoothing) were centered at or near the frequency corresponding to the SDSS redshift of the target. The H i spectra were recorded every second with 9-level sampling.
We observed each galaxy until detected with a signal-to-noise of 5 or higher, or until a gas fraction limit of 2% was reached. Consistently with xGASS, upper limits for non-detections are computed assuming a 5 signal with 300 km s-1 velocity width (appropriate since all of the non-detections are for galaxies with log M 10 M⊙), if the spectrum was smoothed to half width.
The data reduction, performed in the IDL environment, includes Hanning smoothing, bandpass subtraction, excision of radio frequency interference (RFI), and flux calibration. The spectra obtained from each on/off pair are weighted by 1/, where is the root mean square noise measured in the signal-free portion of the spectrum, and co-added. The two orthogonal linear polarizations (kept separated up to this point) are averaged to produce the final spectrum. The spectrum is then boxcar smoothed, baseline subtracted and measured as explained in Catinella et al. (2010). Velocity widths are measured at the 50% of each flux peak, and corrected for instrumental broadening and cosmological redshift as described in Catinella et al. (2012). The RFI excision technique is illustrated in detail in Catinella & Cortese (2015).
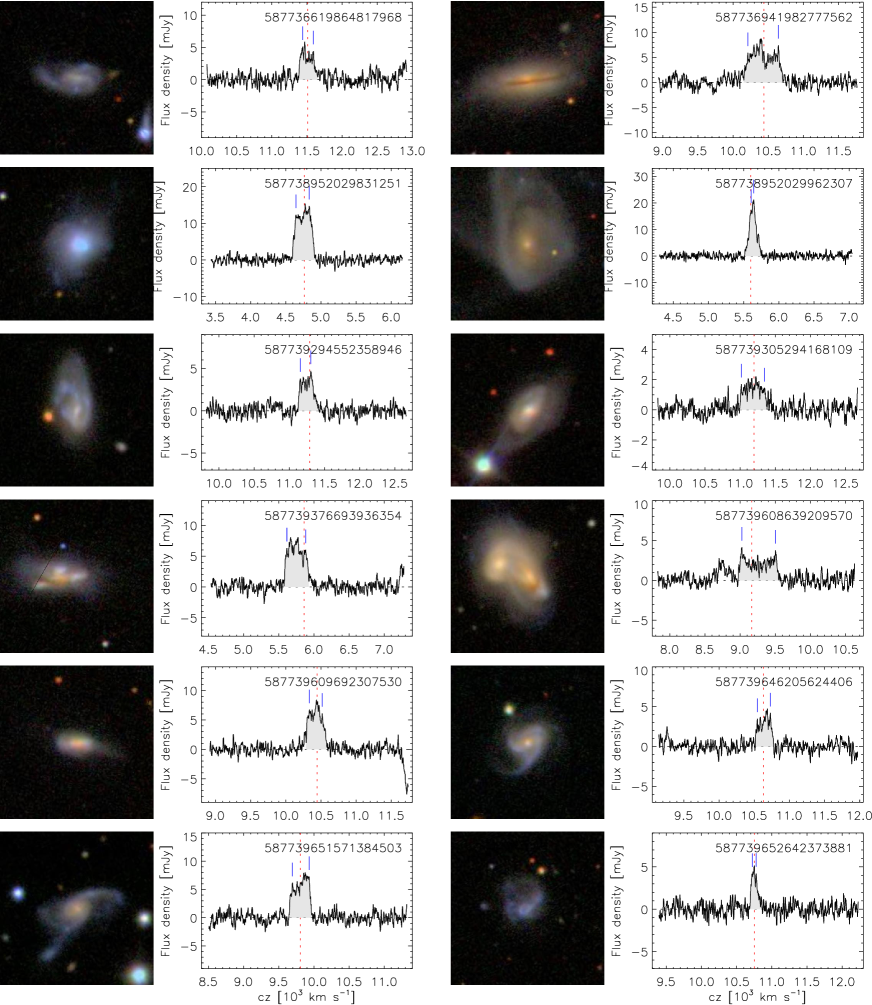
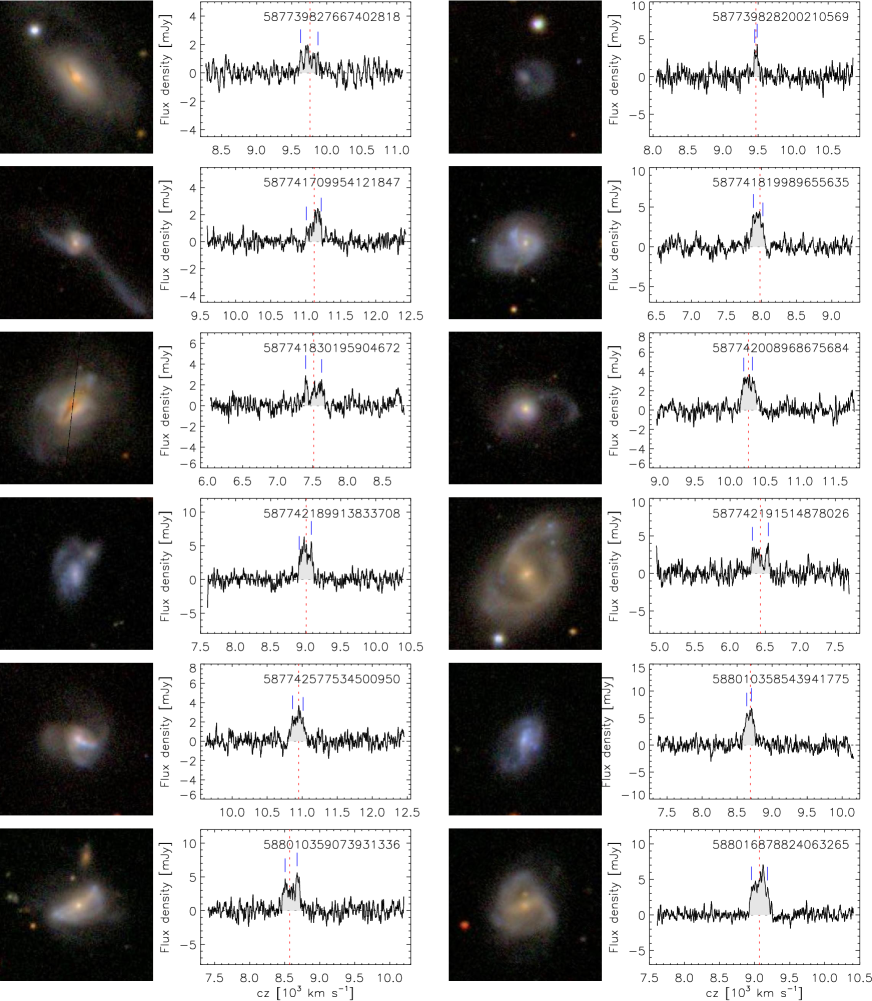
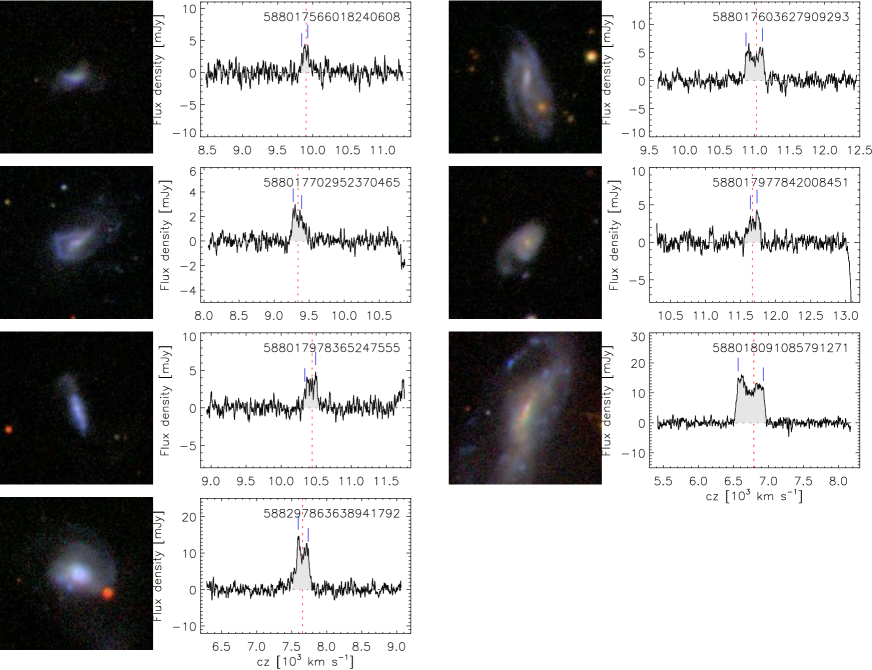
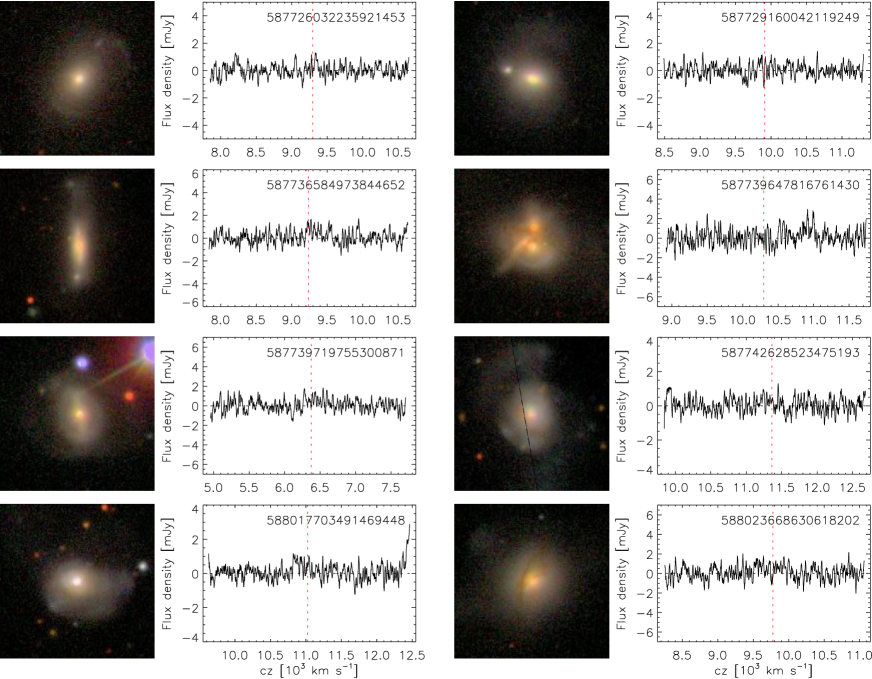
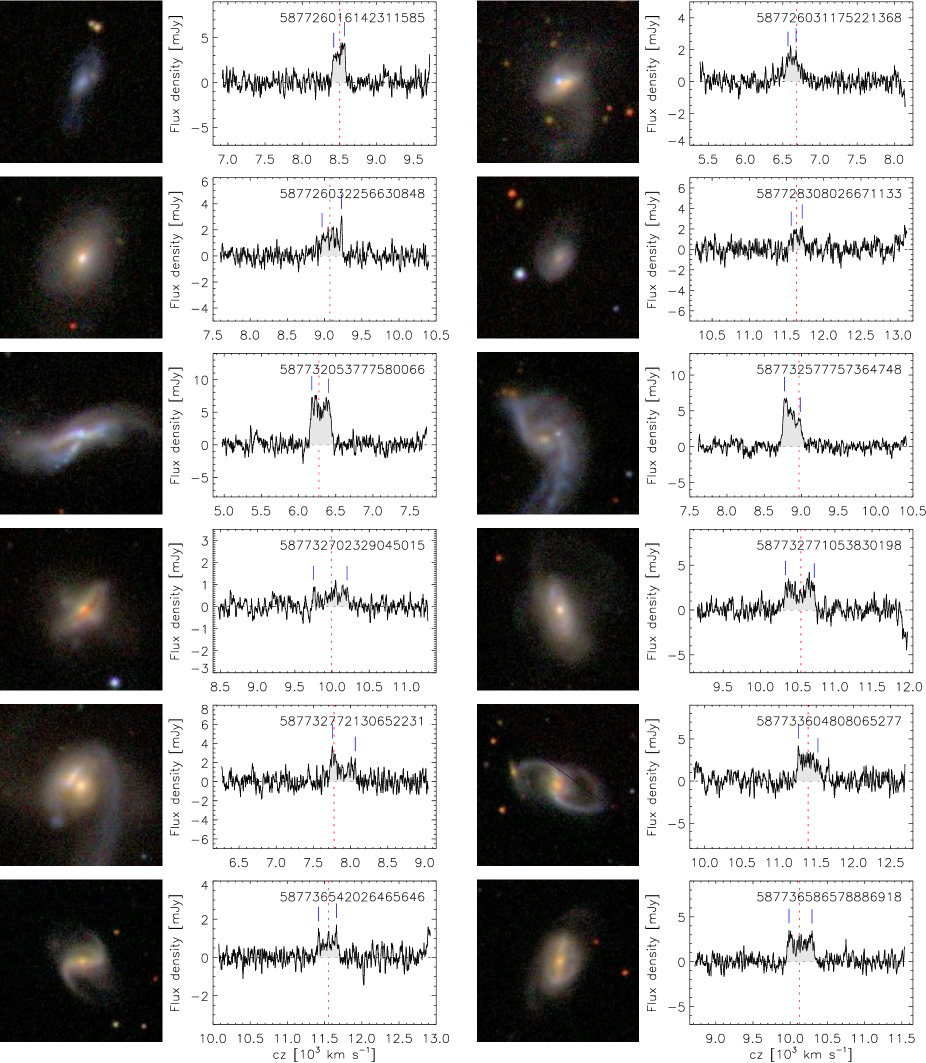
A summary of observations for the 51 newly observed post-mergers is given in Table 1. The upper part of the table reports the 43 detections and the lower part lists the 8 non-detections. Fig. 1 shows the first 12 detections listed in Table 1, which are ordered by SDSS objID. For each galaxy we show the SDSS postage stamp and the extracted spectrum. Panels showing the remaining detections, as well as the non-detections, are presented in the Appendix.
H i masses (in solar units) are computed via the redshift dependent equation (e.g. Catinella et al. 2018):
| (1) |
where is the luminosity distance to the galaxy at redshift as measured from the H i spectrum (column 4 in Table 1). For non-detections, the upper limit for the H i mass was computed using the SDSS redshift (column 4 in Table 2). Table 2 lists the compiled H i masses and upper limits for the 107 post-mergers in our final sample - 47 values from the literature, 51 new observations and 9 unobserved targets.
| objID | RA | Dec | zHI | Ton | W50 | RMS | S/N | ||
| (deg) | (deg) | (min) | (km/s) | (Jy km/s) | (Jy km/s) | (mJy) | |||
| 587726016142311585 | 179.23955 | 3.28063 | 0.028325 | 8 | 167.6 | 0.59 | 0.08 | 0.69 | 12.9 |
| 587726031175221368 | 180.99823 | 1.41085 | 0.022101 | 30 | 159.4 | 0.27 | 0.04 | 0.35 | 11.8 |
| 587726032256630848 | 198.46830 | 2.13257 | 0.030343 | 19 | 268.1 | 0.41 | 0.06 | 0.43 | 11.3 |
| 587728308026671133 | 164.08866 | 1.76512 | 0.038801 | 10 | 170.8 | 0.26 | 0.07 | 0.59 | 6.3 |
| 587732053777580066 | 127.22636 | 34.65166 | 0.021013 | 5 | 266.8 | 1.68 | 0.10 | 0.75 | 27.1 |
| 587732577757364748 | 124.47457 | 3.37657 | 0.029620 | 10 | 245.9 | 1.23 | 0.08 | 0.59 | 25.6 |
| 587732702329045015 | 160.29066 | 6.82006 | 0.033293 | 35 | 454.5 | 0.23 | 0.05 | 0.27 | 6.5 |
| 587732771053830198 | 178.60401 | 9.60905 | 0.035119 | 10 | 387.7 | 0.91 | 0.11 | 0.67 | 13.3 |
| 587732772130652231 | 185.74051 | 10.54832 | 0.026352 | 10 | 322.5 | 0.53 | 0.10 | 0.67 | 8.6 |
| 587733604808065277 | 253.34229 | 33.02841 | 0.038028 | 5 | 286.1 | 0.76 | 0.11 | 0.74 | 11.6 |
| 587736542026465646 | 233.99535 | 6.38257 | 0.038487 | 25 | 241.5 | 0.23 | 0.05 | 0.35 | 8.0 |
| 587736586578886918 | 225.20738 | 36.03508 | 0.033821 | 10 | 331.8 | 0.78 | 0.09 | 0.59 | 14.1 |
| 587736619864817968 | 247.13706 | 23.59831 | 0.038373 | 4 | 196.8 | 0.83 | 0.10 | 0.81 | 13.9 |
| 587736941982777562 | 217.83852 | 35.62303 | 0.034767 | 4 | 466.7 | 2.74 | 0.18 | 0.96 | 23.1 |
| 587738952029831251 | 201.08403 | 36.59609 | 0.015834 | 5 | 251.9 | 3.28 | 0.12 | 0.90 | 45.6 |
| 587738952029962307 | 201.40139 | 36.38123 | 0.018771 | 5 | 102.9 | 2.26 | 0.07 | 0.91 | 54.0 |
| 587739294552358946 | 169.65756 | 33.48587 | 0.037503 | 10 | 198.0 | 0.78 | 0.07 | 0.61 | 17.5 |
| 587739305294168109 | 194.56861 | 35.83894 | 0.037310 | 24 | 340.5 | 0.52 | 0.07 | 0.41 | 13.3 |
| 587739376693936354 | 125.18686 | 19.36220 | 0.019187 | 5 | 312.7 | 1.95 | 0.11 | 0.75 | 29.0 |
| 587739608639209570 | 215.92608 | 28.34609 | 0.030889 | 9 | 508.4 | 1.22 | 0.12 | 0.62 | 14.8 |
| 587739609692307530 | 161.12063 | 30.66089 | 0.034774 | 5 | 242.0 | 1.56 | 0.10 | 0.73 | 26.5 |
| 587739646205624406 | 160.75167 | 29.10123 | 0.035487 | 8 | 209.2 | 0.71 | 0.07 | 0.59 | 16.0 |
| 587739651571384503 | 239.38416 | 20.05347 | 0.032707 | 5 | 272.5 | 1.72 | 0.12 | 0.84 | 24.0 |
| 587739652642373881 | 233.54299 | 23.49964 | 0.035863 | 5 | 91.6 | 0.43 | 0.06 | 0.69 | 12.1 |
| 587739827667402818 | 221.18423 | 22.43805 | 0.032527 | 9 | 251.9 | 0.29 | 0.08 | 0.47 | 5.8 |
| 587739828200210569 | 211.44225 | 25.16498 | 0.031591 | 5 | 50.9 | 0.22 | 0.05 | 0.80 | 7.0 |
| 587741709954121847 | 168.41890 | 27.24117 | 0.037079 | 20 | 209.3 | 0.30 | 0.05 | 0.37 | 10.6 |
| 587741819989655635 | 144.87699 | 19.12943 | 0.026500 | 9 | 167.2 | 0.65 | 0.07 | 0.66 | 14.7 |
| 587741830195904672 | 169.65079 | 24.86748 | 0.025086 | 15 | 250.8 | 0.40 | 0.07 | 0.52 | 9.6 |
| 587742008968675684 | 120.76626 | 9.67965 | 0.034242 | 13 | 187.3 | 0.60 | 0.07 | 0.55 | 15.4 |
| 587742189913833708 | 206.55437 | 23.08402 | 0.030016 | 5 | 186.9 | 0.82 | 0.08 | 0.71 | 16.3 |
| 587742191514878026 | 182.64450 | 25.92821 | 0.021446 | 4 | 237.2 | 0.59 | 0.11 | 0.81 | 9.3 |
| 587742577534500950 | 229.06901 | 15.27590 | 0.036486 | 9 | 180.4 | 0.49 | 0.07 | 0.56 | 12.4 |
| 588010358543941775 | 167.65603 | 4.19140 | 0.028927 | 4 | 130.9 | 0.83 | 0.09 | 0.88 | 15.7 |
| 588010359073931336 | 151.83607 | 4.07930 | 0.028670 | 4 | 231.2 | 0.86 | 0.11 | 0.83 | 13.3 |
| 588016878824063265 | 120.11882 | 21.13626 | 0.030256 | 10 | 259.0 | 1.17 | 0.08 | 0.54 | 26.1 |
| 588017566018240608 | 165.28135 | 11.37236 | 0.032988 | 5 | 97.7 | 0.34 | 0.08 | 0.93 | 7.0 |
| 588017603627909293 | 233.83991 | 32.21680 | 0.036686 | 5 | 254.8 | 1.24 | 0.11 | 0.80 | 18.6 |
| 588017702952370465 | 230.72835 | 8.34895 | 0.031184 | 20 | 175.1 | 0.39 | 0.04 | 0.39 | 14.6 |
| 588017977842008451 | 243.55236 | 22.77767 | 0.038992 | 7 | 166.2 | 0.57 | 0.07 | 0.66 | 12.8 |
| 588017978365247555 | 211.19749 | 36.60761 | 0.034756 | 9 | 182.7 | 0.61 | 0.08 | 0.67 | 13.1 |
| 588018091085791271 | 250.59864 | 25.08653 | 0.022491 | 4 | 392.0 | 4.93 | 0.14 | 0.92 | 59.6 |
| 588297863638941792 | 128.88771 | 30.53429 | 0.025558 | 5 | 178.7 | 2.29 | 0.13 | 1.06 | 31.5 |
| 587726032235921453 | 151.13947 | 1.78775 | … | 19 | … | … | … | 0.43 | … |
| 587729160042119249 | 199.24912 | 5.65679 | … | 10 | … | … | … | 0.43 | … |
| 587736584973844652 | 237.57736 | 28.81188 | … | 8 | … | … | … | 0.52 | … |
| 587739647816761430 | 161.79663 | 30.72437 | … | 4 | … | … | … | 0.72 | … |
| 587739719755300871 | 198.10772 | 28.53771 | … | 8 | … | … | … | 0.57 | … |
| 587742628523475193 | 219.30721 | 14.66514 | … | 16 | … | … | … | 0.41 | … |
| 588017703491469448 | 235.86262 | 7.91169 | … | 15 | … | … | … | 0.37 | … |
| 588023668630618202 | 173.68616 | 19.03339 | … | 8 | … | … | … | 0.68 | … |
| SDSS objID | RA | Dec | zSDSS | log M⋆ | log MHI | log fgas | fgas | HI Reference |
|---|---|---|---|---|---|---|---|---|
| (deg) | (deg) | (M⊙) | (M⊙) | (dex) | (dex) | |||
| 587726016142311585 | 179.23955 | 3.28063 | 0.0284 | 9.16 | 9.31 | 0.15 | 0.29 | This work |
| 587726031175221368 | 180.99823 | 1.41085 | 0.0223 | 10.11 | 8.75 | -1.36 | -0.32 | This work |
| 587726032235921453 | 151.13947 | 1.78775 | 0.0310 | 10.60 | 8.93 | -1.67 | -0.37 | This work |
| 587726032256630848 | 198.46830 | 2.13257 | 0.0303 | 10.53 | 9.21 | -1.32 | 0.08 | This work |
| 587728308026671133 | 164.08866 | 1.76512 | 0.0388 | 9.86 | 9.21 | -0.65 | 0.05 | This work |
| 587728309101789218 | 167.22810 | 2.67660 | 0.0357 | 10.34 | 9.70 | -0.64 | 0.72 | ALFALFA |
| 587728879262105824 | 144.02909 | 3.01169 | 0.0187 | 9.22 | 9.48 | 0.26 | 0.45 | ALFALFA |
| 587728879794192715 | 133.04220 | 2.84024 | 0.0290 | 10.31 | 9.94 | -0.37 | 0.84 | ALFALFA |
| 587728949589377044 | 161.26500 | 0.43439 | 0.0263 | 10.29 | … | … | … | … |
| 587729158966345769 | 194.58816 | 4.88565 | 0.0361 | 10.37 | 9.98 | -0.39 | 1.05 | ALFALFA |
| 587729160042119249 | 199.24912 | 5.65679 | 0.0331 | 10.74 | 8.99 | -1.75 | -0.45 | This work |
| 587732053777580066 | 127.22636 | 34.65166 | 0.0209 | 9.87 | 9.50 | -0.37 | 0.43 | This work |
| 587732577757364748 | 124.47457 | 3.37657 | 0.0299 | 9.69 | 9.66 | -0.03 | 0.70 | This work |
| 587732702329045015 | 160.29066 | 6.82006 | 0.0333 | 10.59 | 9.04 | -1.55 | -0.25 | This work |
| 587732771053830198 | 178.60401 | 9.60905 | 0.0352 | 10.66 | 9.68 | -0.98 | 0.25 | This work |
| 587732772130652231 | 185.74051 | 10.54832 | 0.0259 | 10.60 | 9.19 | -1.41 | -0.11 | This work |
| 587733411530932307 | 243.64022 | 36.94379 | 0.0380 | 10.32 | … | … | … | … |
| 587733604808065277 | 253.34229 | 33.02841 | 0.0380 | 10.54 | 9.67 | -0.87 | 0.51 | This work |
| 587734622163763258 | 120.86694 | 25.10267 | 0.0276 | 10.13 | 9.18 | -0.95 | 0.07 | Springob et al. (2005) |
| 587734893287440431 | 174.04155 | 10.05556 | 0.0207 | 10.37 | 9.73 | -0.64 | 0.80 | ALFALFA |
| 587736478124408901 | 209.25492 | 11.61143 | 0.0387 | 10.80 | … | … | … | … |
| 587736542026465646 | 233.99535 | 6.38257 | 0.0386 | 10.43 | 9.15 | -1.28 | 0.27 | This work |
| 587736543096799321 | 226.32453 | 8.15355 | 0.0391 | 10.11 | 9.81 | -0.30 | 0.74 | ALFALFA |
| 587736546311340046 | 225.62214 | 5.54494 | 0.0376 | 10.62 | 10.40 | -0.22 | 1.03 | ALFALFA |
| 587736584973844652 | 237.57736 | 28.81188 | 0.0308 | 10.95 | 9.01 | -1.94 | … | This work |
| 587736585511305375 | 239.12874 | 28.43732 | 0.0214 | 9.25 | 9.40 | 0.15 | 0.34 | ALFALFA |
| 587736586578886918 | 225.20738 | 36.03508 | 0.0338 | 10.48 | 9.58 | -0.90 | 0.63 | This work |
| 587736619864817968 | 247.13706 | 23.59831 | 0.0384 | 9.60 | 9.71 | 0.11 | 0.67 | This work |
| 587736808838594663 | 207.99749 | 13.96750 | 0.0367 | 11.27 | … | … | … | … |
| 587736808840560852 | 212.67228 | 13.55800 | 0.0163 | 10.33 | 8.67 | -1.66 | -0.28 | Springob et al. (2005) |
| 587736916750499857 | 215.63870 | 13.71719 | 0.0255 | 10.31 | 10.13 | -0.18 | 1.03 | ALFALFA |
| 587736941982777562 | 217.83852 | 35.62303 | 0.0348 | 10.84 | 10.15 | -0.69 | … | This work |
| 587738409254453314 | 156.84348 | 12.28372 | 0.0330 | 9.58 | 9.57 | -0.01 | 0.55 | ALFALFA |
| 587738564942102919 | 121.85340 | 6.86320 | 0.0150 | 9.82 | 9.49 | -0.33 | 0.39 | ALFALFA |
| 587738617018122300 | 149.71387 | 32.07308 | 0.0269 | 10.69 | 9.94 | -0.75 | 0.49 | xGASS |
| 587738952029831251 | 201.08403 | 36.59609 | 0.0159 | 9.34 | 9.55 | 0.21 | 0.45 | This work |
| 587738952029962307 | 201.40139 | 36.38123 | 0.0187 | 10.10 | 9.53 | -0.57 | 0.47 | This work |
| 587739159266590725 | 153.54405 | 34.34299 | 0.0376 | 10.34 | 9.83 | -0.51 | 0.85 | Ellison et al. (2015) |
| 587739294552358946 | 169.65756 | 33.48587 | 0.0377 | 10.09 | 9.67 | -0.42 | 0.61 | This work |
| 587739305294168109 | 194.56861 | 35.83894 | 0.0374 | 10.57 | 9.49 | -1.08 | 0.22 | This work |
| 587739376693936354 | 125.18686 | 19.36220 | 0.0195 | 9.59 | 9.49 | -0.10 | 0.46 | This work |
| 587739382067822837 | 234.00632 | 25.55095 | 0.0362 | 10.43 | 9.88 | -0.55 | 1.00 | ALFALFA |
| 587739406784790531 | 192.17092 | 34.47761 | 0.0142 | 9.42 | 9.35 | -0.07 | 0.32 | xGASS |
| 587739407324479578 | 200.14753 | 34.13933 | 0.0232 | 10.29 | … | … | … | … |
| 587739507154288785 | 185.06547 | 33.66081 | 0.0216 | 10.70 | 9.62 | -1.08 | 0.16 | Ellison et al. (2015) |
| 587739608082481247 | 163.43365 | 29.97818 | 0.0339 | 10.48 | 10.04 | -0.44 | 1.09 | ALFALFA |
| 587739608639209570 | 215.92608 | 28.34609 | 0.0306 | 10.80 | 9.70 | -1.10 | 0.27 | This work |
| 587739609692307530 | 161.12063 | 30.66089 | 0.0348 | 10.21 | 9.90 | -0.31 | 0.72 | This work |
| 587739646205624406 | 160.75167 | 29.10123 | 0.0355 | 10.21 | 9.58 | -0.63 | 0.40 | This work |
| 587739647816761430 | 161.79663 | 30.72437 | 0.0343 | 11.10 | 9.24 | -1.86 | … | This work |
| 587739648351338524 | 155.80313 | 29.86167 | 0.0376 | 10.43 | 10.42 | -0.01 | 1.54 | ALFALFA |
| 587739651571384503 | 239.38416 | 20.05347 | 0.0327 | 9.89 | 9.89 | 0.00 | 0.83 | This work |
| 587739652642373881 | 233.54299 | 23.49964 | 0.0359 | 9.19 | 9.37 | 0.18 | 0.36 | This work |
| 587739719755300871 | 198.10772 | 28.53771 | 0.0213 | 10.44 | 8.73 | -1.71 | -0.21 | This work |
| SDSS objID | RA | Dec | zSDSS | log M⋆ | log MHI | log fgas | fgas | HI Reference |
|---|---|---|---|---|---|---|---|---|
| (deg) | (deg) | (M⊙) | (M⊙) | (dex) | (dex) | |||
| 587739809956495377 | 228.95128 | 20.02236 | 0.0363 | 10.63 | 9.60 | -1.03 | 0.19 | ALFALFA |
| 587739827136954541 | 235.88197 | 17.31290 | 0.0301 | 10.51 | 9.89 | -0.62 | 0.80 | ALFALFA |
| 587739827667402818 | 221.18423 | 22.43805 | 0.0326 | 10.83 | 9.12 | -1.71 | … | This work |
| 587739828200210569 | 211.44225 | 25.16498 | 0.0316 | 9.32 | 8.96 | -0.36 | -0.12 | This work |
| 587739828743962776 | 228.00939 | 21.29817 | 0.0158 | 10.69 | 9.88 | -0.81 | 0.43 | Springob et al. (2005) |
| 587739843773857915 | 219.84399 | 19.99086 | 0.0302 | 11.02 | 9.93 | -1.09 | … | ALFALFA |
| 587739845393186912 | 240.21455 | 15.15126 | 0.0340 | 10.47 | 10.01 | -0.46 | 1.10 | ALFALFA |
| 587741386735812754 | 120.49371 | 15.05875 | 0.0161 | 10.10 | 8.45 | -1.65 | -0.61 | xGASS |
| 587741490357862526 | 134.36642 | 20.12898 | 0.0313 | 9.93 | 9.70 | -0.23 | 0.66 | ALFALFA |
| 587741490371166352 | 166.47407 | 28.79972 | 0.0331 | 11.02 | 10.15 | -0.87 | … | ALFALFA |
| 587741533301768296 | 121.92075 | 14.94325 | 0.0288 | 10.55 | 9.74 | -0.81 | 0.57 | ALFALFA |
| 587741709943308422 | 141.88987 | 21.51811 | 0.0365 | 10.58 | 10.01 | -0.57 | 0.73 | ALFALFA |
| 587741709954121847 | 168.41890 | 27.24117 | 0.0371 | 10.16 | 9.24 | -0.92 | 0.11 | This work |
| 587741721213534291 | 195.87117 | 26.55050 | 0.0221 | 10.57 | 9.94 | -0.63 | 0.67 | ALFALFA |
| 587741726041309213 | 183.67686 | 24.98057 | 0.0220 | 9.89 | 9.34 | -0.55 | 0.28 | ALFALFA |
| 587741815711858726 | 157.65187 | 21.85477 | 0.0218 | 9.84 | 9.44 | -0.40 | 0.26 | Springob et al. (2005) |
| 587741819989655635 | 144.87699 | 19.12943 | 0.0266 | 9.80 | 9.29 | -0.51 | 0.21 | This work |
| 587741830195904672 | 169.65079 | 24.86748 | 0.0251 | 10.39 | 9.03 | -1.36 | 0.13 | This work |
| 587742008968675684 | 120.76626 | 9.67965 | 0.0342 | 10.31 | 9.48 | -0.83 | 0.38 | This work |
| 587742060544720960 | 206.10219 | 20.40956 | 0.0270 | 11.15 | 10.10 | -1.05 | … | ALFALFA |
| 587742062170603854 | 241.82595 | 13.22804 | 0.0353 | 9.22 | 9.85 | 0.63 | 0.82 | ALFALFA |
| 587742189913833708 | 206.55437 | 23.08402 | 0.0301 | 9.36 | 9.50 | 0.14 | 0.43 | This work |
| 587742191514878026 | 182.64450 | 25.92821 | 0.0215 | 10.52 | 9.06 | -1.46 | -0.02 | This work |
| 587742577534500950 | 229.06901 | 15.27590 | 0.0365 | 10.35 | 9.44 | -0.91 | 0.47 | This work |
| 587742610812239923 | 241.15390 | 9.95316 | 0.0340 | 9.76 | 9.76 | 0.00 | 0.68 | ALFALFA |
| 587742611343802434 | 229.25508 | 13.10297 | 0.0295 | 9.79 | 9.95 | 0.16 | 0.93 | Springob et al. (2005) |
| 587742628523475193 | 219.30721 | 14.66514 | 0.0379 | 10.88 | 9.08 | -1.8 | … | This work |
| 587744638026907800 | 124.46932 | 12.89799 | 0.0323 | 10.66 | 9.96 | -0.70 | 0.53 | ALFALFA |
| 587744874250240260 | 125.74443 | 10.39764 | 0.0010 | 10.67 | … | … | … | … |
| 587745243615199518 | 120.98490 | 8.69958 | 0.0167 | 9.76 | 9.90 | 0.14 | 0.82 | ALFALFA |
| 587745243629158413 | 152.65950 | 16.68502 | 0.0170 | 9.56 | … | … | … | … |
| 588010358531031086 | 138.01528 | 2.87586 | 0.0256 | 10.30 | 9.70 | -0.60 | 0.54 | ALFALFA |
| 588010358543941775 | 167.65603 | 4.19140 | 0.0290 | 9.51 | 9.47 | -0.04 | 0.48 | This work |
| 588010359073931336 | 151.83607 | 4.07930 | 0.0286 | 10.26 | 9.48 | -0.78 | 0.33 | This work |
| 588010359086579785 | 180.80914 | 4.83215 | 0.0385 | 9.64 | 9.77 | 0.13 | 0.67 | ALFALFA |
| 588010360148656136 | 153.99977 | 4.95476 | 0.0320 | 10.41 | 9.89 | -0.52 | 0.92 | ALFALFA |
| 588010879833145381 | 180.72790 | 5.61263 | 0.0193 | 9.80 | … | … | … | … |
| 588010879841992790 | 201.04017 | 5.25972 | 0.0249 | 9.90 | 9.80 | -0.10 | 0.83 | ALFALFA |
| 588010880378404942 | 199.99113 | 5.80788 | 0.0213 | 10.31 | 9.76 | -0.55 | 0.66 | ALFALFA |
| 588016878824063265 | 120.11882 | 21.13626 | 0.0302 | 10.44 | 9.66 | -0.78 | 0.72 | This work |
| 588017566018240608 | 165.28135 | 11.37236 | 0.0330 | 9.11 | 9.19 | 0.08 | 0.17 | This work |
| 588017569779744827 | 203.10099 | 11.10636 | 0.0315 | 10.03 | … | … | … | … |
| 588017603627909293 | 233.83991 | 32.21680 | 0.0368 | 9.69 | 9.85 | 0.16 | 0.89 | This work |
| 588017702952370465 | 230.72835 | 8.34895 | 0.0312 | 9.24 | 9.20 | -0.04 | 0.15 | This work |
| 588017703491469448 | 235.86262 | 7.91169 | 0.0368 | 10.75 | 9.01 | -1.74 | -0.43 | This work |
| 588017977842008451 | 243.55236 | 22.77767 | 0.0389 | 9.86 | 9.57 | -0.29 | 0.41 | This work |
| 588017978365247555 | 211.19749 | 36.60761 | 0.0348 | 9.05 | 9.50 | 0.45 | 0.53 | This work |
| 588017978916667581 | 245.99499 | 22.39337 | 0.0371 | 10.69 | 10.27 | -0.42 | 0.82 | Springob et al. (2005) |
| 588018091085791271 | 250.59864 | 25.08653 | 0.0226 | 10.01 | 10.03 | 0.02 | 0.97 | This work |
| 588023046943473782 | 144.29931 | 21.66922 | 0.0202 | 10.94 | 9.79 | -1.15 | … | ALFALFA |
| 588023668630618202 | 173.68616 | 19.03339 | 0.0326 | 11.06 | 9.17 | -1.89 | … | This work |
| 588297863638941792 | 128.88771 | 30.53429 | 0.0255 | 9.76 | 9.81 | 0.05 | 0.73 | This work |
| 588848900971888657 | 146.79909 | 0.70269 | 0.0306 | 9.56 | 10.17 | 0.61 | 1.19 | ALFALFA |
4 Results
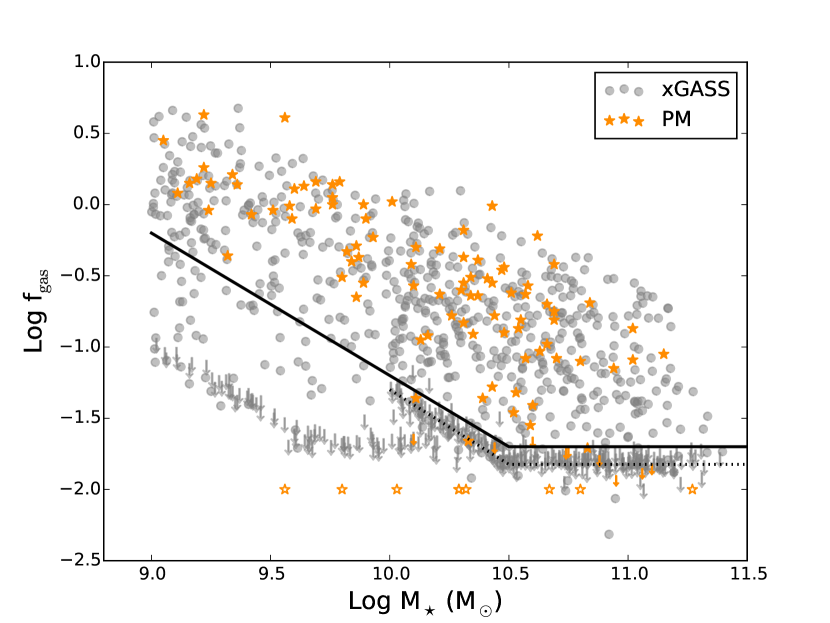
In Fig. 2 we show the distribution of H i gas fractions in the post-merger sample with orange stars and arrows for detections and upper limits respectively. The nine unobserved post-mergers are shown with open stars and an arbitrary atomic gas fraction log = . For reference, galaxies from xGASS (Catinella et al. 2018) are also shown – grey filled symbols indicate xGASS detections and downward arrows are upper limits. The original GASS survey threshold is shown by the dotted line; the break in the H i detection fraction threshold at log (M) = 10.5 was implemented to mitigate the large exposure times required for a constant threshold at the lowest masses. However, it can be seen that at log M 10.0 M⊙ the xGASS upper limits scatter around this threshold since the detectability of a source depends on its velocity width as well as its 21 cm flux.
For the purpose of this study, we define an effective detection threshold of 2 percent for log M 10.5 M⊙ and log MHI= 8.8 M⊙ below that mass. The adapted detection threshold is shown with a solid line in Fig. 2 and can be seen to be a more conservative boundary between the detections and upper limits. We stress that the exact placement of this definition does not qualitatively affect the conclusions of this paper, it simply allows us to consistently treat data points above and below the threshold.
From Fig. 2 it is obvious by eye that the post-mergers occupy a region of preferentially high at a given M⋆, and that there is an almost complete absence of gas-poor post-mergers. In the following sub-sections, we quantify the difference between the post-mergers and xGASS in three different ways: the H i detection fraction, the median and the atomic gas fraction offset (from a mass-matched control sample) and assess the impact of including/excluding non-detections in these statistics. We demonstrate that a full accounting of non-detections is critical for a full assessment of gas fraction statistics and that a deep H i survey such as xGASS plays a crucial role in this measurement.
4.1 HI detection fraction
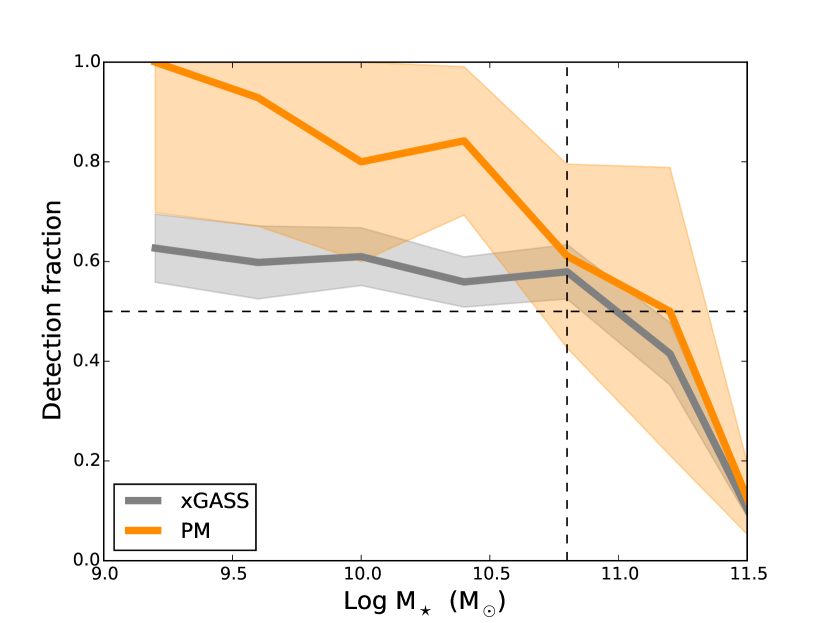
In Fig. 3 we plot the H i detection fraction as a function of stellar mass for both the xGASS (grey line) and post-merger (orange line) samples. Galaxies are counted as non-detections if their upper limit, or actual measured lies below the detection threshold shown by the solid line in Fig 2. Upper limits above the detection threshold (only 1 in our post-merger sample) are treated as non-observations (i.e. not counted in the detection fraction statistics). The shaded regions show the 1 bound and the horizontal dashed line shows a 50 per cent detection rate. Both the xGASS and post-merger samples show a steeply declining detection fraction at high stellar masses. However, the post-mergers have a systematically higher 21 cm detection fraction at all stellar masses, a result that is most significant at log M 10.5 M⊙, where the majority of the post-mergers are located (Fig. 2) and hence the statistics are most robust. In this mass regime, the H i detection fraction amongst the post-merger sample is 50 per cent higher than the xGASS control sample. In a smaller, shallower sample of post-mergers Ellison et al. (2015) also found a higher (factor of two) detection fraction compared with their ALFALFA control sample.
4.2 Median fgas
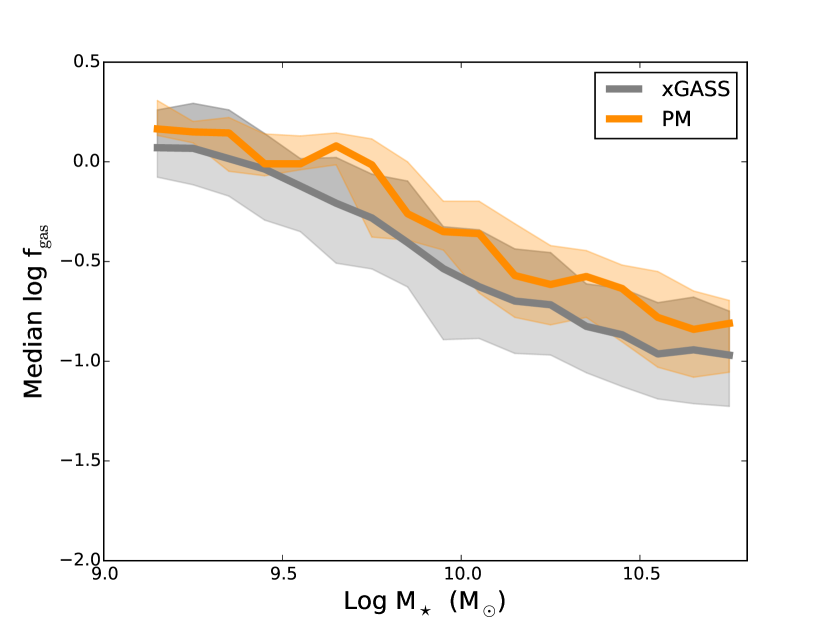
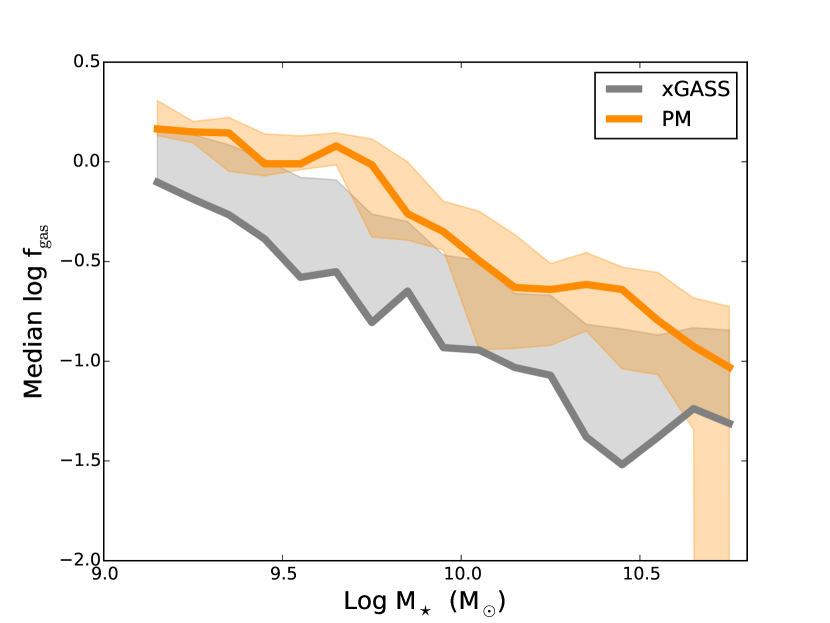
In Fig. 4 we compute the median for the xGASS and post-merger samples, shown by the grey and orange lines, respectively. The shaded zones in Fig. 4 show the 25th and 75th percentiles of the distribution. In the top panel of the figure we show the median for both samples only considering galaxies for which there is an H i detection. In order to homogenize the sample of detections, we only include detections that lie above our adopted detection threshold (solid line in Fig 2), ignoring detections below this limit. The median from H i detections in the post-merger sample is systematically above the median value for the full xGASS sample, by 0.1 – 0.2 dex, across the full range in stellar mass, although there is considerable overlap between the 25th and 75th percentiles of the two samples.
In Fig. 3 we showed that the H i detection fraction of the post-merger sample was significantly higher than xGASS. Therefore, the difference between the median of the two samples is likely to be under-estimated if the non-detections are ignored. In the lower panel of Fig. 4 we re-compute the median for the post-merger and xGASS samples now including the non-detections, which yields a more complete and fair assessment of the difference between the two samples. Since Fig. 3 shows that the xGASS sample has a detection fraction 50 per cent for log M 10.8 M⊙ (vertical dashed line in Fig. 3), it is only possible to determine a median for the xGASS sample at stellar masses below this threshold. Moreover, the 25th percentile can not be computed for the xGASS sample (at any stellar mass) due to the insufficient detection fraction (as adopted in this work), hence the lower grey shaded area is not plotted. The lower panel of Fig. 4 again shows that the post-merger line lies systematically above the xGASS sample. The median of the post-merger sample is little changed compared to the upper panel, because the H i detection fraction is high and therefore the median is not much changed by the inclusion of non-detections. However, the larger fraction of non-detections in the xGASS sample leads to a significantly lower median when the non-detections are included. The difference between the median in the post-mergers and xGASS is now typically 0.3 – 0.6 dex.
4.3 Gas fraction offset:
In order to quantify on a galaxy-by-galaxy basis the enhancement (or deficit) of relative to the typical atomic gas fraction at that stellar mass, we use the ‘gas fraction offset’, , first introduced in our previous work on post-merger gas fractions (Ellison et al. 2015). is computed for each galaxy in turn by identifying all galaxies in the xGASS sample of the same stellar mass (within 0.15 dex) and computing the difference between log in the post-merger galaxy and median value of the matched control galaxies. Therefore, a galaxy with = +1.0 has an atomic gas fraction 10 times higher than expected for its stellar mass. We require a minimum of 5 mass-matched control galaxies per post-merger. If this is not achieved within the 0.15 dex tolerance, we grow the tolerance by 0.1 dex and repeat until at least 5 matches are achieved. In practice, typically 100 control galaxies are matched to each post-merger without the need to grow the mass matching tolerance.
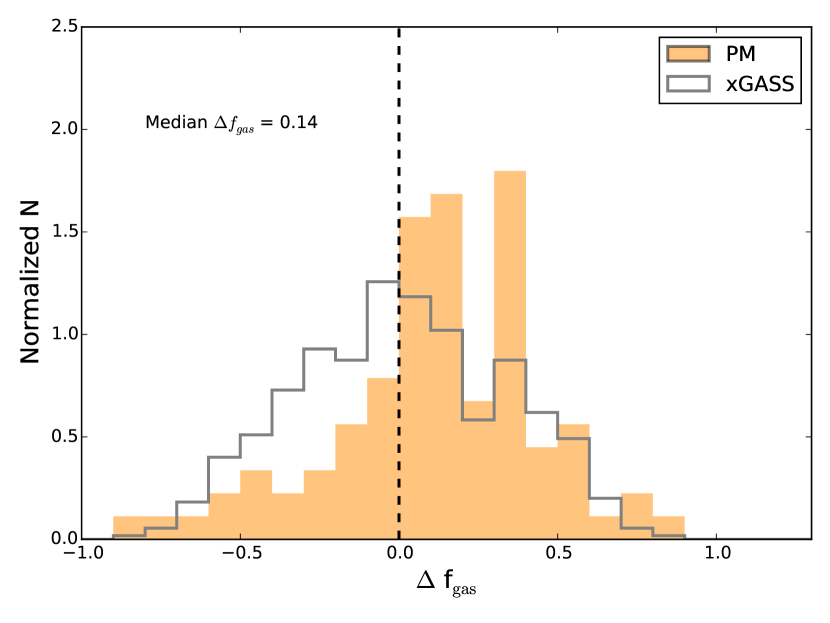
In Fig. 5 we show the distribution of for the post-mergers. Following our analysis of the median , we begin by showing in the upper panel the distribution of for the xGASS and post-merger sample considering only H i detections above the adopted detection threshold. By definition, the distribution of for xGASS is symmetric around zero. The post-mergers are biased towards positive values of ; the median atomic gas fraction offset is = +0.14, indicating that, on average, the post-mergers are 40 per cent more H i rich than their mass-matched control sample.
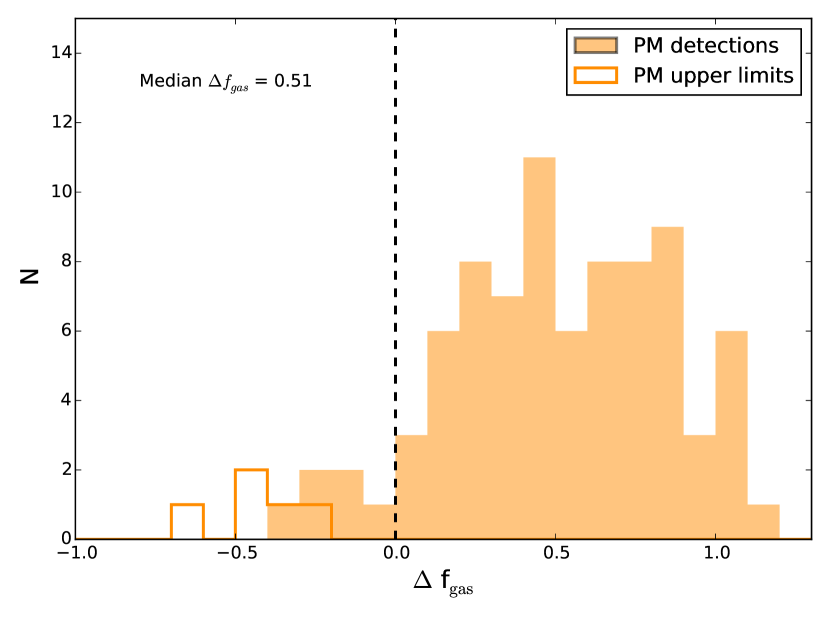
However, we saw in the previous sub-section that considering only detections for the xGASS control sample can under-estimate the offset relative to the post-mergers, due to the higher fraction of H i non-detections in the former. In the lower panel of Fig. 5 we show the distribution of for the post-mergers that include non-detections from xGASS in the calculation of the control sample’s gas fraction. When including H i non-detections from the xGASS control sample, can only be computed for galaxies with log M 10.8 M⊙, since the median of the xGASS control sample is not constrained for higher masses (Fig 3). These values are also reported in Table 2.
The solid histogram in the lower panel of Fig 5 shows the values for the 83 post-mergers with log M 10.8 M⊙ with H i detections. The 5 non-detections in this stellar mass range, which correspond to upper limits in , are shown by the open histogram. Of the 9 unobserved targets in the final post-merger sample, 8 have log M 10.8 M⊙. These are not plotted in Fig. 5 and could be located at any value of . However, the overwhelming majority of the post-merger sample have positive values of , such that the 8 unobserved targets will not influence the conclusion that the post-mergers are gas-rich. Once the non-detections have been included in the control sample, the median gas fraction offset is = +0.51 dex, indicating that the post-mergers are typically 3 times more abundant in atomic gas than the control sample.
5 Discussion
5.1 Comparison with previous results
In our previous study of the H i content of post-mergers, Ellison et al. (2015) found that the gas fractions in a sample of 37 post-mergers were consistent with a control sample drawn from the ALFALFA survey. However, we also found that the post-merger sample exhibited a factor of two higher H i detection fraction than the ALFALFA control sample. The combination of these results led us to speculate that the shallow survey depth of the dataset, enforced by the adoption of ALFALFA as the comparison sample, may have led to an under-estimate of the atomic gas fraction offset in post-mergers. Ellison et al. (2015) concluded that, contrary to being gas depleted after an interaction-induced starburst, post-merger galaxies may actually be relatively gas-rich.
In the new work presented here, we have confirmed the speculation of Ellison et al. (2015), thanks to a larger, deeper H i survey of post-mergers and the availability of an equivalently deep comparison sample: xGASS. In Figures 4 and 5 we have demonstrated the importance of including H i non-detections and shown that the median and are under-estimated if only detections are used. Once non-detections are accounted for, post-merger galaxies have, on average, a higher H i gas fraction by a factor of 3, compared with a mass-matched control sample in xGASS (Catinella et al. 2018).
Our work is consistent with that of Janowiecki et al. (2017) who found that centrals in groups of two (i.e. pairs) in xGASS had a factor of two higher than isolated central galaxies of the same stellar mass. Other surveys that have reported elevated H i gas fractions in mergers include Casasola et al. (2004), Huchtmeier et al. (2008) and Jaskot et al. (2015). Conversely, based on a sample of dwarf galaxy pairs, Stierwalt et al. (2015) found H i gas fractions consistent with their control sample. However, since the Stierwalt et al. (2015) control sample was drawn from ALFALFA, the comparison may suffer from the same limitation as that of Ellison et al. (2015). The new results presented here highlight the importance of sensitive H i measurements and the need to take into account non-detections.
5.2 The connection with SFR and asymmetry
Analogous to the enhanced atomic gas fractions in merging galaxies presented here, elevated fractions of molecular gas have also been reported in interacting galaxies of various stages (Braine & Combes 1993; Combes et al. 1994; Casasola et al. 2004). The most readily comparable study to our investigation of atomic gas are the studies of molecular gas in close galaxy pairs by Violino et al. (2018), Pan et al. (in prep) and in post-mergers by Sargent et al. (in prep.). These works have also drawn their merger samples from the SDSS and used comparable matching techniques to the ones presented here in order to compute gas fraction offsets in the molecular phase. Violino et al. (2018) and Pan et al. (in prep) measure a molecular gas fraction = 0.4 dex for close galaxy pairs and Sargent et al. (in prep) find a 0.6 dex enhancement for the post-mergers, compared with a stellar mass matched sample. Both Violino et al. and Sargent et al. find that the molecular gas fraction enhancement is reduced if SFR is used as an additional matching parameter (although = 0.2 dex for the post-mergers even after this additional matching). Indeed, it is well known that (at fixed M⋆) galaxies with higher SFR have higher H2 fractions (Saintonge et al. 2012, 2016).
A galaxy’s atomic gas fraction has also been shown to correlate with its SFR. For example, Brown et al. (2015) show that, at fixed stellar mass, galaxies with bluer colours (a proxy for specific SFR) have higher gas fractions (see also Saintonge et al. 2016). We therefore repeated our calculations for the post-mergers, matching in both stellar mass and total SFR, the latter of which is also taken from the MPA/JHU catalogs (e.g. Brinchmann et al. 2004; Salim et al. 2007). Although there may be concern that significant star formation may be obscured in merging galaxies, Sargent et al. (in prep) have performed a thorough testing of the SFRs in a smaller sample of post-mergers selected from SDSS, and find consistent results with SFRs derived from the UV+IR. In addition to the baseline mass matching tolerance of 0.15 dex, we also now require that the total SFR of the control galaxies matches the post-merger within 0.1 dex. If less than 5 control galaxies are simultaneously matched in mass and SFR, both quantities have their matching tolerances increased by 0.1 dex. Most post-mergers have at least 5 control galaxies without the need to expand the matching tolerances. However, whilst the typical number of controls per post-merger was 100 when matching in mass alone, this number decreases to 10–20 for simultaneous matching with SFR.
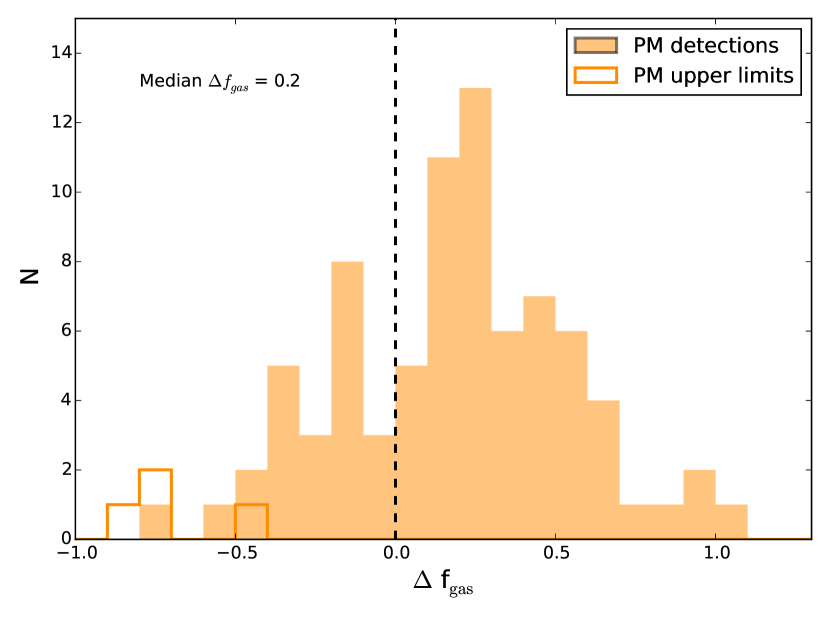
In Fig. 6 we show the distribution of for the mass and SFR-matched control sample. Fig. 6 includes H i non-detections in both the post-merger and control sample and is hence comparable to the lower panel of Fig 5. The additional match in SFR has reduced the median from +0.51 dex (lower panel of Fig. 5) to +0.2 dex (Fig 6), which closely mirrors the molecular gas fraction offsets in post-mergers with and without SFR matching found by Sargent et al. (in prep.). Fig. 6 shows that even accounting for the elevated SFRs in mergers, an excess of H i gas, relative to the control sample, remains.
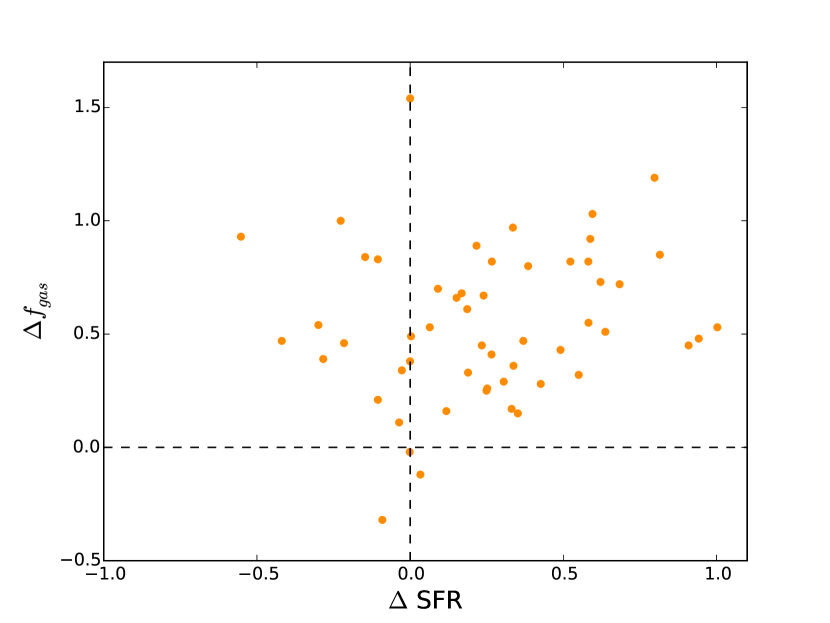
In Fig. 7 we further investigate the connection between SFR and enhanced atomic gas fractions by plotting versus SFR, which is defined as the SFR relative to main sequence galaxies of the same stellar mass, redshift and local environment (see Ellison et al. 2018 for more details on the calculation of SFR). Fig. 7 shows that, as known from Ellison et al. (2013), the post-merger sample has generally elevated SFRs (i.e. positive SFR). However, Fig. 7 also shows that there is no correlation between SFR and (the Pearson correlation coefficient is 0.15); post-merger galaxies show enhanced H i gas fractions over a wide range of SFR offsets.
We also checked for a possible correlation between galaxy asymmetry and . Galaxy asymmetry may be used as a rough indicator of the time since the merger, although it is also sensitive to the physical properties of the progenitors and their orbits (Lotz et al. 2010a,b; Ji, Peirani & Yi 2014). We took the -band asymmetry index from Simard et al. (2011), which measures the fraction of the light in the asymmetric component after the subtraction of a bulge+disk model. We found no relationship between asymmetry and , confirming a similar result in our earlier work (Ellison et al. 2015).
5.3 The connection with AGN
The H i CGM content of galaxies has recently been found to be enhanced in galaxies that host AGN (Berg et al. 2018). Based on a sample of 20 AGN host galaxies selected from the SDSS, Berg et al. (2018) measured enhanced Ly absorption in the CGM at impact parameters 160 – 300 kpc. Berg et al. (2018) speculate that galaxies that host AGN may have preferentially higher gas fractions. There is a well documented connection between galaxy mergers and AGN triggering (Ellison et al. 2011; Satyapal et al. 2014; Khabiboulline et al. 2014), which could indicate that mergers are responsible for the enhanced CGM H i content observed by Berg et al. (2018). Of the post-mergers in our sample, 25 are classified as optical AGN (Kauffmann et al. 2003). However, the distribution of these 25 optically selected AGN in our post-merger sample is indistinguishable from the atomic gas fraction offsets of rest of the sample (see also Fabello et al. 2011). This does not necessarily rule out a connection between merger-triggered AGN and elevated atomic gas fractions, since AGN life-times can be short and flicker on the timescales associated with the post-merger stage (e.g. Schawinski et al. 2015).
5.4 Environmental dependence
It is well known that the H i content of galaxies depends on large scale environment, with lower gas fractions in both cluster and group environments (Solanes et al. 2001; Chung et al. 2009; Kilborn et al. 2009; Cortese et al. 2011; Hess & Wilcotts 2013). Galaxies classified as satellites within their halo (Yang et al. 2007) appear to be the most H i deficient at a given stellar mass (Catinella et al. 2013). Of the 107 post-mergers in our sample, 57 are classified as isolated centrals, 23 are group centrals, 23 are satellites and 4 are not in the Yang et al. (2007) catalog. The post-merger satellite fraction (22 per cent) is therefore somewhat lower than the xGASS control sample in general (32 per cent), indicating that environmental differences might lead to lower atomic gas fractions in the control.
In order to test for trends with halo class, we repeated our calculation of , separating both the control and post-merger sample into 3 categories based on Yang et al. (2007): satellite, group central and isolated central. Only controls of the same halo type are matched to each post-merger, i.e. a post-merger galaxy that is classified as a satellite only has controls that are also classified as satellites. We additionally attempted to match in halo mass, but the statistics for this proved insufficient. We restrict our calculation of to the 83 galaxies with log M and H i detections (i.e. the solid histogram in Fig 5), ignoring the 5 non-detections in this stellar mass range.
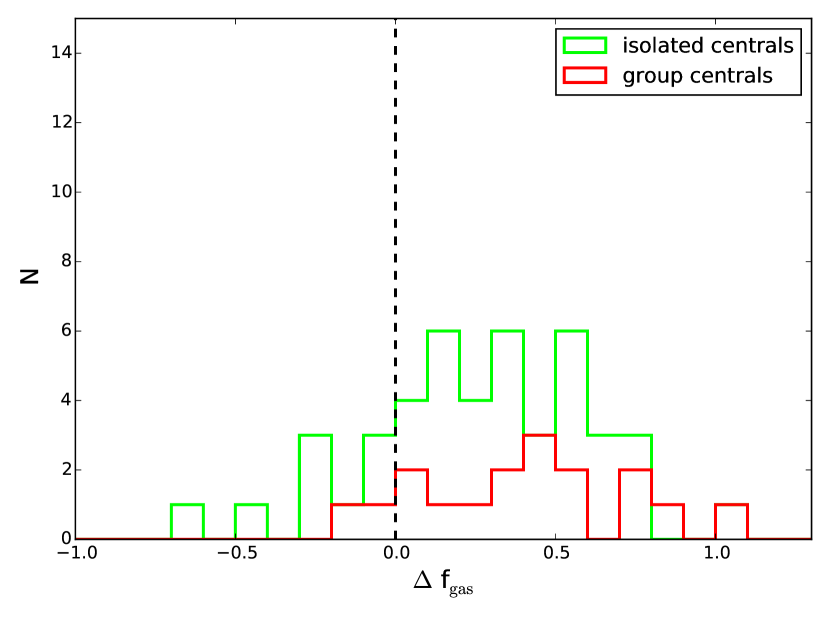
Fig. 8 shows the distribution for group and isolated centrals in the post-merger sample, both of which are still strongly skewed towards positive values, despite the additional environmental matching. Unfortunately, is unconstrained for all of the post-merger satellite galaxies due to a 50 per cent non-detection rate amongst their controls. We have therefore not found any evidence that the high H i gas fractions in the post-merger sample are the result of an environmental bias on the halo scale. However, our environment testing is limited by available data, and we have not been able to investigate halo mass effects, nor the impact on satellite galaxies, for the reasons described above. Furthermore, larger scale environmental effects, such as inflowing gas from the IGM are not accounted for in these tests.
5.5 Why are post-mergers HI rich?
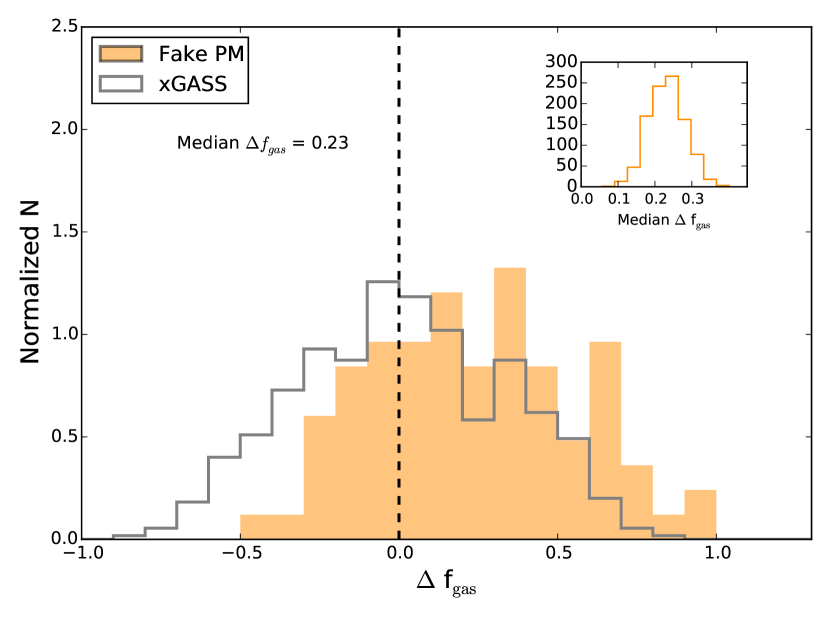
In Ellison et al. (2015) we discussed possible reasons behind the enhanced atomic gas fraction in post-merger galaxies, and re-visit that discussion here in light of both new data and simulations. First, we re-consider the suggestion put forward by Ellison et al. (2015) that post-mergers might naturally be H i enhanced due to the arithmetic combination of the progenitor sample. We repeat the experiment of Ellison et al. (2015) in which we produced a fake sample of post-mergers from their control sample. Whereas Ellison et al. (2015) did this experiment using the shallow (and hence, gas-rich) ALFALFA sample, we will do it using the xGASS sample. We draw at random two sets of 83 galaxies (the number of H i detections in our post-merger sample) from the xGASS detections and sum their stellar and atomic gas masses, to emulate the arithmetic combination occuring in a merger. We then compute the of the resulting post-merger sample. This process is repeated 1000 times with the median of each fake post-merger survey recorded.
In the main panel Fig. 9 we show the distribution of one fake post-merger survey generation, consisting of 83 galaxies as the filled orange histogram. For reference, the initial xGASS distribution of is shown in grey; this is the same distribution shown in the top panel of Fig. 5 and is symmetric around zero by construction. The median of this iteration is 0.23 dex. The inset histogram shows the distribution of median from the 1000 fake survey generations. The typical expected median simply from combining pairs of xGASS galaxies is 0.25 dex. This result is qualitatively consistent with, although slightly larger than, the observed atomic gas fraction enhancement measured in the real post-merger sample when only considering detections ( = 0.14 dex, Fig. 5). This experiment indicates that we might naturally expect post-mergers to have higher atomic gas fractions than their mass matched control sample.
Even if an arithmetic combination of galaxy pairs is expected to yield a positive atomic gas fraction offset, this enhancement might be mitigated by the elevated SFRs (and subsequent depletion/expulsion of the gas reservoir) experienced by galaxy mergers. In Ellison et al. (2015) we made a crude assessment of this by using a suite of simulated binary mergers and assuming that the enhanced star formation could be used to estimate the maximum depletion of the H i reservoir. However, since the simulations used by Ellison et al. (taken from Moreno et al. 2015) did not account for the different ISM gas phases, we could not distinguish different gas phases and trace the transition between them.
Moreno et al. (2018) have recently performed a new suite of binary merger simulations using the state-of-the-art FIRE-2 code, which aims to recover the detailed physics of the ISM at high resolution (Hopkins et al. 2018). Moreno et al. (2018) study a range of galaxy merger orbits and trace the multi-phase ISM during the pair (pre-coalescence) phase of 27 interactions. The molecular gas reservoir is found to be enhanced throughout the interaction phase, by 0.1 dex on average, which in turn fuels additional star formation. This is qualitatively consistent with observational studies of enhanced molecular gas fractions in pairs (Violino et al. 2018). Early in the simulated interactions, the enhanced molecular gas fraction is mirrored by a decline in the atomic gas fraction, as the latter’s reservoir fuels the former. However, the atomic gas fraction is steadily replenished throughout the simulated interactions as hot gas cools. Therefore, despite the enhanced star formation rates that are observed in simulations and observations alike, the results from Moreno et al. (2018) indicate that we might not expect to see this draining the atomic gas reservoir. Instead, the results from Moreno et al. (2018) indicate that if we see any change in H i it could be a small enhancement - the median change in HI gas fraction in their suite is a 5 per cent increase. Further H i replenishment could come from cooling of a hot halo (e.g. Moster et al. 2011). We therefore propose that the observed enhancement in is dominated by the arithmetic combination of the progenitor’s atomic gas reservoirs, with a possible minor contribution from the net enhancement of the atomic component from cooled ionized gas.
Finally, we consider whether the high atomic gas fractions in our post-merger sample could be due to a selection bias. The post-merger sample is selected based on visual classifications of asymmetry and disruption. Simulations have shown that such strong tidal features are more prevalent and longer lived in interacting galaxies with high gas fractions (Lotz et al. 2010a). It is therefore possible that the progenitors of our post-merger sample had pre-existing high gas fractions. Indeed, the images of our post-mergers (Figs 1 and 11) indicate their progenitors were more likely to be disks than ellipticals. We have therefore repeated the analysis presented in Sec. 4.3 using only control galaxies that are disk dominated. This is achieved by imposing an -band bulge fraction cut of 0.3 (Simard et al. 2011) onto the control pool of xGASS galaxies. We find our results are largely unchanged, with the resulting median still at 0.5 dex. Therefore, whilst we can not rule out that the progenitor galaxies of our post-merger sample might have been already gas-rich, we have not found evidence of this bias.
Our results have shown that elevated H i gas fractions can be achieved through the merger process, which raises the question of whether all high atomic gas fraction galaxies are post-mergers. To investigate this, we computed values for xGASS galaxies and visually inspected the SDSS images of the upper quartile of the sample, i.e. those with the largest atomic gas fraction enhancements. These galaxies rarely show any signs of interactions, indicating that elevated can also be achieved through non-merger processes (see also Sancisi et al 2008; Gereb et al. 2018). Alternatively, the high galaxies in xGASS may have been due to a past merger, but their optical asymmetries have now faded. Indeed, Lutz et al. (2018) have recently found that warps and H i asymmetries are more common in gas-rich galaxies.
5.6 Do galaxy mergers lead to quenching?
Simulations have played a pivotal role in our understanding of galaxy mergers, having successfully predicted many facets of the interaction process. For example, merger simulations predict (and can model) morphological asymmetries (e.g. Pop et al., 2018; Mortazavi et al. 2016), boosts in SFR (e.g. Di Matteo et al. 2007; Cox et al. 2008; Moreno et al. 2015), enhanced nuclear accretion (Capelo et al. 2015; Blecha et al. 2018) and changes in metallicity gradients (Perez et al. 2011; Torrey et al. 2012; Bustamante et al 2018). Importantly, simulations have also predicted that a wholesale removal of gas can occur, either due to ejection by powerful winds (e.g. Di Matteo et al. 2005; Hopkins et al. 2008) or consumption by star formation (e.g. Bekki 1998). This potentially key phase in the merger process, which links mergers to the quenching of star formation, remains unproven by observations.
The results presented here demonstrate that, contrary to being gas depleted, recently merged galaxies exhibit an excess of atomic hydrogen gas. A similar excess (at fixed stellar mass) is also present in the molecular phase, both before and after the interaction is complete (Braine & Combes 1993; Casasola et al. 2004; Violino et al. 2018; Pan et al. in prep; Sargent et al. in prep). Taken together, these observational studies indicate that the merger process is unlikely to lead to the quenching of star formation as a result of gas exhaustion or expulsion. Moreover, our results indicate that the enhanced molecular gas fractions do not simply result in a net depletion of the atomic gas reservoirs. Indeed, Jaskot et al. (2015) find that starburst galaxies have very similar H i gas fractions to ‘normal’ star forming galaxies. The simulations of Moreno et al. (2018) show that these observations can be understood via the complex conversion of gas between different phases. Specifically, although atomic gas does feed the molecular phase during the interaction, the atomic component can also be replenished by cooling from the ionized phase.
One caveat to our conclusion that mergers do not lead to atomic gas depletion is that the post-mergers in our sample have been selected based on strong morphological asymmetries, and hence likely represent fairly recently coalesced systems. Their SFRs are still enhanced (e.g. Fig. 7) and studies of similarly selected systems have shown nuclear accretion is on-going (e.g. Satyapal et al. 2014; Weston et al. 2017). It is therefore possible that gas blowout/consumption is yet to happen. However, there are several complementary results that support our conclusions. First, Fabello et al. (2011) have shown that the H i gas fractions of AGN are consistent with non-AGN host galaxies, and conclude that the AGN therefore has little impact on its galactic gas reservoir. Indeed, Berg et al. (2018) find slightly higher Ly absorption equivalent widths in quasar sightlines that probe local Seyfert hosts. Regarding gas consumption, several studies have shown that post-starburst galaxies retain a considerable molecular (French et al. 2015; Rowlands et al. 2015; Alatalo et al. 2016; Suess et al. 2017; Smercina et al. 2018) and atomic (Buyle et al. 2006; Zwaan et al. 2013) gas reservoirs. Since a significant fraction of post-starbursts seem to be related to late stage mergers (Zabludoff et al. 1996; Goto 2005; Meusinger et al. 2017; Pawlik et al. 2018) their substantial gas reservoirs indicate that the gas remains even after an interaction-induced starburst is complete. Finally, since 40 per cent of early-type galaxies have been shown to maintain significant molecular gas reservoirs (e.g. Young et al. 2014), it seems that the cessation of star formation and morphological transformation do not always go hand-in-hand with an absence of gas.
If the atomic and molecular gas reservoirs are not significantly depleted by the merging process, do galaxy mergers lead to the cessation of star formation in their post-merger remnant? If the answer is ‘yes’ (e.g. Wiegel et al. 2017), then the mechanism may not be gas consumption or expulsion as previously proposed. Instead, there may be a mechanism that prevents the cold gas reservoir (which we have shown be particularly abundant in post-mergers) from turning into stars. Indeed, the 0.2 dex excess in atomic (this paper) and molecular (Sargent et al., in prep) gas fractions, even when matching in SFR, does suggest that conversion of these two phases is proceeding at a less efficient rate in post-mergers (see also Davis et al. 2015).
The internal dynamics of galactic gas may offer a plausible mechanism for decreasing the star formation efficiency of merging galaxies. Although our understanding of gas instabilities is over half a century old (Safronov 1960; Toomre 1964), there is a growing appreciation that kinematics may play a crucial role in governing the state of galactic gas and the potential for quenching in a galaxy (e.g. Obreschkow et al. 2016; Wong et al. 2016; Pontzen et al. 2017; Falgarone et al. 2017). The ISM of galaxy mergers may plausibly be expected to be highly turbulent, due to a combination of gravitational torques, shocks and outflows from star formation and AGN (e.g. Veilleux et al. 2013; Sell et al. 2014; Rich, Kewley & Dopita 2015; Mortazavi & Lotz 2018). In turn, it is expected that increased turbulence will make the ISM stable against gravitational collapse, even if there is abundant gas present in the galaxy (e.g. Alatalo et al. 2015; Smercina et al. 2018). van de Voort et al. (2018) have recently claimed that such dynamical effects may explain the low star formation efficiencies in a sample of early-type post-merger galaxies, despite significant cold gas reservoirs. For the quenching to be long-lived, the injection of turbulence would need to be persistent (or recurrent); stochastic AGN activity in the ‘maintenance mode’ is one possible mechanism to achieve this (e.g. Pontzen et al. 2017).
Alternatively, the gas remaining after the merger’s starburst might simply be too diffuse to efficiently form stars. Maps of star formation, atomic and molecular gas in nearby galaxies have shown that it is the latter that correlates with star formation, rather than the former (e.g. Bigiel et al. 2008; Leroy et al. 2008, 2013). Moreover, it is important to recognize that the molecular gas traced by CO 1-0 observations (the transition used in most of the molecular gas studies referenced herein) can be relatively diffuse and not necessarily in compact giant molecular clouds (e.g. Pety et al. 2013; Caldu-Primo et al. 2015). Stars form out of the dense molecular gas that is better traced with transitions such as HCN (e.g. Wu et al. 2005; Lada et al. 2012). Even within the dense gas the star formation efficiency and dense gas fraction seem to vary on local conditions (Usero et al. 2015; Bigiel et al. 2016). Taken taken, these studies of gas in local galaxies show that an abundance of gas (even an abundance of molecular gas) is not a sufficient condition to form stars, with a complex dependence on local conditions.
5.7 A revised view of the galaxy merger process
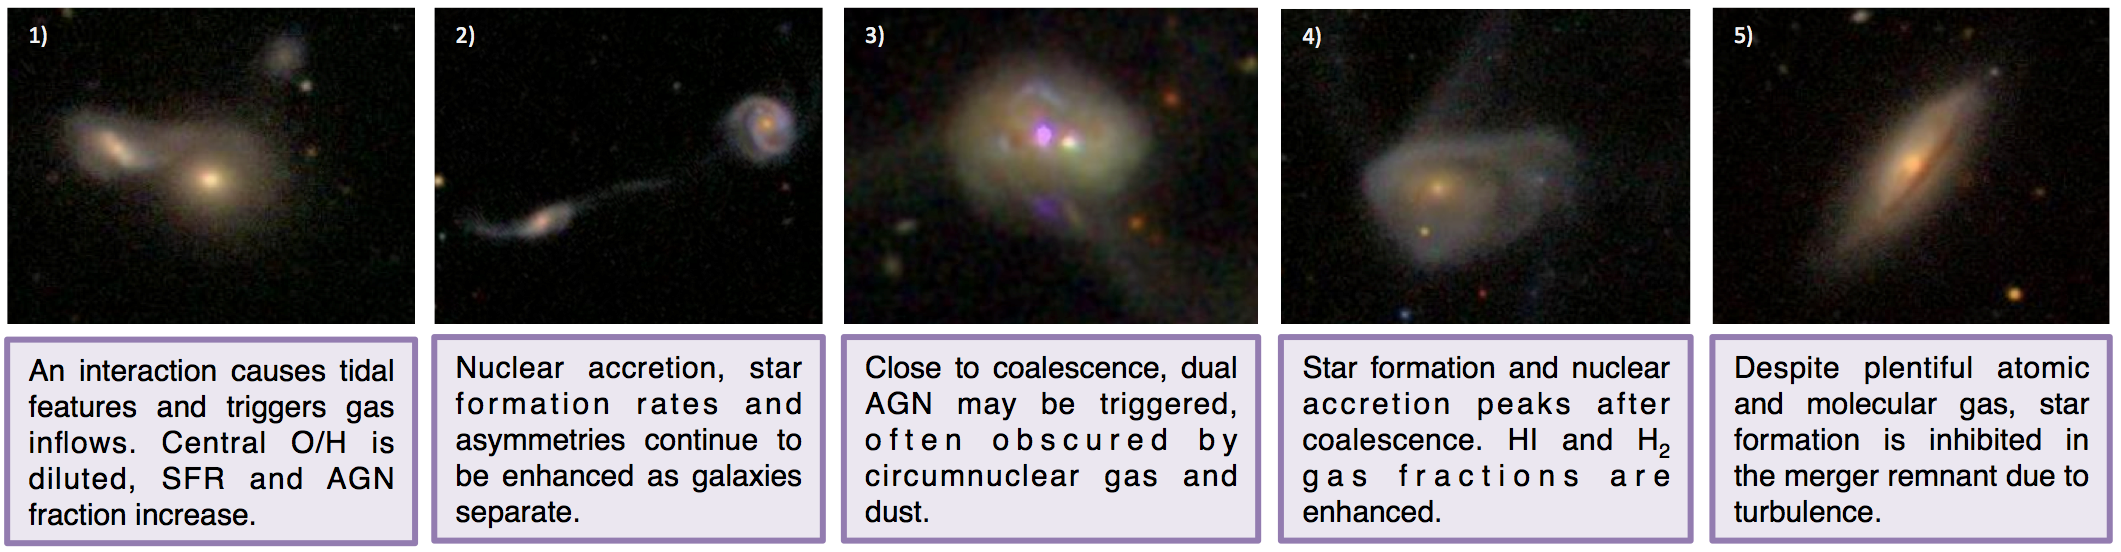
In Fig. 10 we suggest a revision of the Hopkins et al. (2008) schematic picture of the galaxy merger process, pieced together from, and illustrated by, a decade of work on mergers selected from the SDSS and complementary multi-wavelength data.
-
1.
Galaxies that experience a close encounter trigger tidal disturbances that morphologically alter both the stellar and gas components (e.g. Ellison et al. 2010; Patton et al. 2016). The interaction leads to diluted central metallicities, enhanced SFRs (e.g. Ellison et al. 2008; Patton et al. 2011) and elevated AGN fractions (Ellison et al. 2011; Satyapal et al. 2014; Khabiboulline et al. 2014).
-
2.
As the galaxies separate after their first pericentric passage, changes in the metallicities, asymmetries, SFR and AGN fractions can persist to wide separations (e.g. Scudder et al. 2012; Patton et al. 2013, 2016).
-
3.
Close to coalescence, dual AGN become more frequent (Ellison et al. 2011, 2013). The increased nuclear obscuration by gas and dust result in a higher fraction of AGN that are selected in the mid-IR (Satyapal et al. 2014), a realization that has resulted in a significant increase in the number of dual AGN with separations 10 kpc (Ellison et al. 2017; Satyapal et al. 2017).
-
4.
After coalescence, recent post-merger galaxies exhibit SFRs and AGN fraction enhancements that exceed the pre-merger phase (Ellison et al. 2013). Atomic and molecular gas fractions are elevated for their stellar mass and SFR (this work; Sargent et al. in prep).
-
5.
We speculate that the abundant atomic and molecular gas in the post-merger remnant is neither consumed by star formation, nor expelled by winds. Complementary observations of post-merger and post-starburst galaxies suggest that both atomic and molecular gas reservoirs are retained, but rendered (at least temporarily) infertile either due to increased shocks and turbulence (e.g. Buyle et al. 2006; Zwaan et al. 2013; French et al. 2015; Rowlands et al. 2015; Alatalo et al. 2016; Suess et al. 2017; van de Voort et al. 2018; Smercina et al. 2018) or to its diffuse distribution/lower dense gas fraction.
Although many aspects of this picture remain the same as that proposed by Hopkins et al. (2008), (e.g. triggered star formation and nuclear accretion), we have found no evidence for the ‘blowout’ phase.
6 Conclusions
We have compiled a sample of 107 visually classified post-merger galaxies within a fixed right ascension and declination footprint (10 17 hours, 0 37 degrees) with and log M M⊙. 47 of these post-mergers have existing measurements of MHI in the literature. Arecibo observations of 51 of the remaining 60 post-mergers have been completed with an observing strategy identical to the xGASS sample of 1200 representative galaxies from from the SDSS with log M (Catinella et al. 2018). The identical observing strategy, data reduction pipeline and survey depth between xGASS and the post-mergers, facilitate a robust comparison between the two samples. The work presented here represents a factor of 3 increase in sample size and a factor of 5 in depth compared to our previous assessment of post-merger atomic gas fractions in Ellison et al. (2015).
Our primary results are as follows.
-
•
Post-mergers exhibit an elevated H i detection fraction compared with xGASS galaxies at the same stellar mass. We define an effective detection threshold = 2 percent for log M 10.5 M⊙ and log MHI= 8.8 M⊙ below that mass. The fraction of post-merger galaxies above this detection threshold exceeds that of the xGASS sample at fixed stellar mass. For log M 10.5 M⊙, the mass regime where most of our post-mergers are located, the H i detection fraction is enhanced by 50 per cent relative to the xGASS sample (Fig 3).
-
•
The median H i gas fraction is larger in the post-merger sample than in xGASS at fixed stellar mass. When only considering the H i detections, the median in the post-merger sample is larger than in xGASS by 0.2 dex. However, due to the different detection fractions in the two samples, this is an under-estimate of the true difference in median gas fractions. Accounting for the H i non-detections, the median in the post-merger sample is 0.3 – 0.6 dex larger than in xGASS (Fig. 4).
-
•
The median atomic gas fraction enhancement in post-mergers is a factor of 3 higher than control galaxies in xGASS. In order to compute the atomic gas fraction offset on a galaxy-by-galaxy basis, we construct a mass matched control sample of xGASS galaxies for each post-merger. Accounting for non-detections the median = 0.51 dex (Fig. 5). However, if SFR is additionally included in the matching parameters, the median atomic gas fraction enhancement is reduced to = 0.2 dex (Fig. 6).
-
•
There is no correlation between a galaxy’s H i gas fraction enhancement and its SFR enhancement (Fig. 7) or asymmetry. There is also no difference in the distribution of for galaxies hosting an AGN.
-
•
We find no evidence for an environmental origin for the enhanced atomic gas fractions in post-mergers. values are re-computed after requiring that control galaxies have the same halo classification (satellite, group central, isolated central) as the post-merger galaxy. Both group and isolated centrals in the post-merger sample have similar positive distributions of (Fig. 8).
We conclude that mergers represent an effective mechanism for elevating the H i gas fraction at a given stellar mass. However, the lack of merger signatures in the general xGASS galaxy sample with high indicates that mergers are not the only way for a galaxy to cultivate an H i rich ISM. We propose that the elevated in post-mergers could be a combination of the arithmetic combination of the progenitor galaxies, and the net cooling of the ionized/hot gas component of the ISM/halo.
Simulations by Moreno et al. (2018) find that atomic gas reservoirs remain relatively constant throughout the merger process. Combined with the results presented here, and other observational findings that post-starburst galaxies retain significant gas reservoirs (French et al. 2015; Rowlands et al. 2015; Suess et al. 2017), we conclude that merger-induced star formation is unlikely to lead to quenching via gas exhaustion or expulsion. However, the enhanced ISM turbulence that is likely to follow a galaxy merger could decrease the star formation efficiency (e.g. van de Voort et al. 2018), or lower the dense gas fraction and ultimately facilitate the transition to a passive remnant.
Acknowledgements
SLE gratefully acknowledges support from a CAASTRO visiting fellowship to UWA, during which this work was initiated, and from an NSERC Discovery Grant. BC is the recipient of an Australian Research Council Future Fellowship (FT120100660). Parts of this research were conducted by the Australian Research Council Centre of Excellence for All Sky Astrophysics in 3 Dimensions (ASTRO 3D), through project number CE170100013. Our thanks to Jorge Moreno and Mark Sargent for allowing us to cite results prior to publication.
This research has made use of the NASA/IPAC Extragalactic Database (NED) which is operated by the Jet Propulsion Laboratory, California Institute of Technology, under contract with the National Aeronautics and Space Administration.
The Arecibo Observatory is operated by SRI International under a cooperative agreement with the National Science Foundation (AST-1100968), and in alliance with Ana G. Méndez-Universidad Metropolitana, and the Universities Space Research Association.
Funding for the SDSS and SDSS-II has been provided by the Alfred P. Sloan Foundation, the Participating Institutions, the National Science Foundation, the U.S. Department of Energy, the National Aeronautics and Space Administration, the Japanese Monbukagakusho, the Max Planck Society, and the Higher Education Funding Council for England. The SDSS Web Site is http://www.sdss.org/.
The SDSS is managed by the Astrophysical Research Consortium for the Participating Institutions. The Participating Institutions are the American Museum of Natural History, Astrophysical Institute Potsdam, University of Basel, University of Cambridge, Case Western Reserve University, University of Chicago, Drexel University, Fermilab, the Institute for Advanced Study, the Japan Participation Group, Johns Hopkins University, the Joint Institute for Nuclear Astrophysics, the Kavli Institute for Particle Astrophysics and Cosmology, the Korean Scientist Group, the Chinese Academy of Sciences (LAMOST), Los Alamos National Laboratory, the Max-Planck-Institute for Astronomy (MPIA), the Max-Planck-Institute for Astrophysics (MPA), New Mexico State University, Ohio State University, University of Pittsburgh, University of Portsmouth, Princeton University, the United States Naval Observatory, and the University of Washington.
References
- [Aalto et al. 2001] Aalto, S., Huttemeister, S., Polatidis, A. G., 2001, A&A, 372, L29
- [Alatalo et al. (2015)] Alatalo, K, et al., 2015, ApJ, 812, 117
- [Alatalo et al. (2016)] Alatalo, K, et al., 2016, ApJ, 827, 106
- [Bekki (1998)] Bekki, K., 1998, ApJ, 502, L133
- [Berg et al. (2018)] Berg, T. A. M., Ellison, S. L., Tumlinson, J., Oppenheimer, B., Horton, R., Bordoloi, R., Schaye, J., 2018, MNRAS, in press
- [Bigiel et al. (2008)] Bigiel, F., Leroy, A., Walter, F., Brinks, E., de Blok, W. J. G., Madore, B., Thornley, M. D., 2008, AJ, 136, 2846
- [Bigiel et al. (2016)] Bigiel, F., et al. 2016, ApJ, 822, L26
- [Blecha et al. (2018)] Blecha, L., Snyder, G. F., Satyapal, S., Ellison, S. L., 2018, MNRAS, submitted
- [Braine & Combes (1993)] Braine, J., & Combes, F., 1993, A&A, 269, 7
- [Brinchmann et al. 2004] Brinchmann, J., Charlot, S., White, S. D. M., Tremonti, C., Kauffmann, G., Heckman, T., Brinkmann, J.,2004, MNRAS, 351, 1151
- [Bustamante et al. (2018)] Bustamante, S., Sparre, M., Springel, V., Grand, R. J. J., 2018, MNRAS, submitted
- [Buyle et al. (2006)] Buyle, P., Michielsen, D., De Rijcke, S., Pisano, D. J., Dejonghe, H., Freeman, K., 2006, ApJ, 649, 163
- [Caldu-Primo et al. 2015] Caldu-Primo, A., Schruba, A., Walter, F., Leroy, A., Bolatto, A. D., Vogel, S., 2015, AJ, 149, 76
- [Capelo et al. (2015)] Capelo, P. R., Volonteri, M., Dotti, M., Bellovary, J. M., Mayer, L., Governato, F., 2015, MNRAS, 447, 2123
- [Casasola et al. (2004)] Casasola, V., Bettoni, D., Galletta, G., 2004, A&A, 422, 941
- [Catinella et al. (2010)] Catinella, B., et al, 2010, MNRAS, 403, 683
- [Catinella et al. (2012)] Catinella, B., et al, 2012, A&A, 544, 65
- [Catinella et al. (2013)] Catinella, B., et al, 2013, MNRAS, 436, 34
- [Catinella et al. (2018)] Catinella, B., et al, 2018, MNRAS, 476, 875
- [Catinella & Cortese (2015)] Catinella, B., & Cortese, L., 2015, MNRAS, 446, 3526
- [Chung et al. (2009)] Chung, A., van Gorkom, J. H., Kenney, J. D. P., Crowl, H., Vollmer, B., 2009, AJ, 138, 1741
- [Combes et al. (1994)] Combes, F., Prugniel, P., Rampazzo, R., Sulentic, J. W., 1994, A&A, 281, 725
- [Cortese et al. (2011)] Cortese, L., Catinella, B., Boissier, S., Boselli, A., Heinis, S., 2011, MNRAS, 415, 1797
- [Cox et al. (2008)] Cox, T. J., Jonsson, P., Somerville, R. S., Primack, J. R., Dekel, A., 2008, MNRAS, 384, 386
- [Darg et al. (2010a)] Darg, D. W., et al., 2010, MNRAS, 401, 1552
- [Davis et al. (2015)] Davis, T. A., et al., 2015, MNRAS, 449, 3503
- [Di Matteo et al. (2007)] Di Matteo, P., Combes, F., Melchior, A.-L., Semelin, B., 2007, A&A, 468, 61
- [Di Matteo et al. (2005)] Di Matteo, T., Springel, V., Hernquist, L., 2005, Nature, 433, 604
- [Ellison et al. (2008)] Ellison, S. L., Patton, D. R., Simard, L., McConnachie, A. W., 2008 AJ, 135, 1877
- [Ellison et al. (2010)] Ellison, S. L., Patton, D. R., Simard, L., McConnachie, A. W., Baldry, I. K., Mendel, J. T., 2010, MNRAS 407, 1514.
- [Ellison et al. (2011)] Ellison, S. L., Patton, D. R., Mendel, J. T., Scudder, J. M., 2011, MNRAS, 418, 2043
- [Ellison et al. (2013)] Ellison, S. L., Mendel, J. T., Patton, D. R., Scudder, J. M., 2013, MNRAS, 453, 3627
- [Ellison et al., (2015)] Ellison, S. L., Fertig, D., Rosenberg, J. L., Nair, P., Simard, L., Torrey, P., Patton, D. R., 2015, MNRAS, 448, 221
- [Ellison et al., (2017)] Ellison, S. L., Secrest, N. J., Mendel, J. T., Satyapal, S., Simard, L., 2017, MNRAS, 470, L49
- [Ellison et al., (2018)] Ellison, S. L., Sanchez, S. F., Ibarra-Medel, H., Antonio, B., Mendel, J. T., Barrera-Ballesteros, J., 2018, MNRAS, 474, 2039
- [Fabello et al. (2011)] Fabello, S., Kauffmann, G., Catinella, B., Giovanelli, R., Haynes, M. P., Heckman, T. M., Schiminovich, D., 2011, MNRAS, 416, 1739
- [Falgarone et al. (2017)] Falgarone, E., et al., 2017, Nature, 548, 430
- [Fernandez et al. (2010)] Fernandez, X., van Gorkom, J. H., Schweizer, F., Barnes, J. E., 2010, AJ, 140, 1965
- [French et al. (2015)] French, K. D., Yang, Y., Zabludoff, A., Narayanan, D., Shirley, Y., Walter, F., Smith, J.-D., Tremonti, C. A., 2015, ApJ, 801, 1
- [Georgakakis et al. (2000)] Georgakakis, A., Forbes, D. A., Norris, Ray P., 2000, MNRAS, 318, 124
- [Gereb et al. (2018)] Gereb, K., Janowiecki, S., Catinella, B., Cortese, L., Kilborn, V., 2018, MNRAS, 476, 896
- [Giovanelli et al. (2005)] Giovanelli, R., et al., 2005, AJ, 130, 2598
- [Goto (2005)] Goto, T., 2005, MNRAS, 357, 937
- [Goulding et al. (2018)] Goulding, A. D., et al., 2018, PASJ, 70, 37
- [Hani et al. (2018)] Hani, M., Sparre, M., Ellison, S. L., Torrey, P. Vogelsberger, M., 2018, MNRAS, in press
- [Haynes et al. (2011)] Haynes, M. P., et al., 2011, AJ, 142, 170
- [Hess & Wilcots (2013)] Hess, K. M., Wilcots, E. M., 2013, AJ, 146, 124
- [Hibbard & van Gorkom (1996)] Hibbard, J. E., van Gorkom, J. H., 1996, AJ, 111, 655
- [Hibbard & Yun (1999)] Hibbard, J. E., & Yun, M. S., 1999, AJ, 118, 162
- [Hopkins et al. (2008)] Hopkins, P. F., Hernquist, L., Cox, T. J., Keres, D., 2008, ApJS, 175, 356
- [Hopkins et al. (2018)] Hopkins, P. F., et al., 2018, MNRAS, submitted
- [Huchtmeier et al. (2008)] Huchtmeier, W. K., Petrosian, A., Gopal-Krishna, McLean, B., Kunth, D., 2008, A&A, 492, 367
- [Janowiecki et al. (2017)] Janowiecki, S., Catinella, B., Cortese, L., Saintonge, A., Brown, T., Wang, J., 2017, MNRAS, 466, 4795
- [Jaskot et al. (2015)] Jaskot, A. E., Oey, M. S., Salzer, J. J., Van Sistine, A., Bell, E. F., Haynes, M. P., 2015, ApJ, 808, 66
- [Ji, Peirani & Yi (2014)] Ji, I., Peirani, S., & Yi, S. K., 2014, A&A, 566, 97
- [Kauffmann et al. (2003)] Kauffmann, G., et al., 2003, MNRAS, 346, 1055
- [Khabiboulline et al. (2014)] Khabiboulline, E. T., Steinhardt, C. L., Silverman, J. D., Ellison, S. L., Mendel, J. T., Patton, D. R., 2014, ApJ, 795, 62
- [Kilborn et al. (2009)] Kilborn, V. A., Forbes, D. A., Barnes, D. G., Koribalski, B. S., Brough, S., Kern, K., 2009, MNRAS, 400, 1962
- [Koribalski & Dickey (2014)] Koribalski, B., Dickey, J. M., 2004, MNRAS, 348, 1255
- [Larson et al. 2016] Larson, K. L., et al., 2016, ApJ, 825, 128
- [Leroy et al. (2008)] Leroy, A. K., Walter, F., Brinks, E., Bigiel, F., de Blok, W. J. G., Madore, B., Thornley, M. D., 2008, AJ, 136, 2782
- [Leroy et al. (2013)] Leroy, A. K., et al., 2013, AJ, 146, 19
- [Lada, Lombardi & Alves (2010)] Lada, C. J., Forbrich, J., Lombardi, M., & Alves, J. F., 2012, ApJ, 745, 190
- [Lotz et al. (2010)] Lotz, J. M., Jonsson, P., Cox, T. J., Primack, J. R., 2010a, MNRAS, 404, 590
- [Lotz et al. (2010)] Lotz, J. M., Jonsson, P., Cox, T. J., Primack, J. R., 2010b, MNRAS, 404, 575
- [Lutz (2018)] Lutz, K. A., et al., 2018, MNRAS, 476, 3744
- [Manthey et al. (2008)] Manthey, E., Aalto, S., Huttemeister, S., Oosterloo, T. A., 2008a, A&A, 484, 693
- [Manthey et al. (2008)] Manthey, E., Huttemeister, S., Aalto, S., Horellou, C., Bjerkeli, P., 2008b, A&A, 490, 975
- [Meusinger et al. (2017)] Meusinger, H., Brunecke, J., Schalldach, P., in der Au, A., 2017, A&A, 597, 134
- [Michiyama et al. (2016)] Michiyama, T., et al., 2016, PASJ, 68, 96
- [Mihos & Hernquist (1994)] Mihos, C., & Hernquist, L., 1994, ApJ, 425, L13
- [Mihos & Hernquist (1996)] Mihos, C., & Hernquist, L., 1996, ApJ, 464, 641
- [Montuori et al. (2010)] Montuori, M., Di Matteo, P., Lehnert, M. D., Combes, F., Semelin, B., 2010, A&A, 518, 56
- [Mortazavi & Lotz (2018)] Mortazavi, S. A., & Lotz, J. M., 2018, MNRAS, submitted
- [Mortazavi et al. (2016)] Mortazavi, S. A., Lotz, J. M., Barnes, J. E., Snyder, G. F., 2016, MNRAS, 455, 3058
- [Moster et al. (2011)] Moster, B. P., Maccio, A. V., Somerville, R. S., Naab, T., Cox, T. J. 2011, MNRAS, 415, 3750
- [Moreno et al. (2015)] Moreno, J., Torrey, P., Ellison, S. L., Patton, D. R., Bluck, A. F. L., Bansal, G., Hernquist, L., 2015, MNRAS, 448, 1107
- [Moreno et al. (2018)] Moreno, J., Torry, P., Ellison, S. L., et al., 2018, MNRAS, submitted
- [Nair & Abraham (2010a)] Nair, P. B., & Abraham, R. G., 2010, ApJS, 186, 427
- [Obreschkow et al. (2016)] Obreschkow, D., Glazebrook, K., Kilborn, V., Lutz, K., 2016, ApJ, 824, L26O
- [Patton et al. (2011)] Patton, D. R., Ellison, S. L., Simard, L., McConnachie, A. W., Mendel, J. T., 2011, MNRAS, 412, 591
- [Patton et al. (2013)] Patton, D. R., Torrey, P., Ellison, S. L., Mendel, J. T., Scudder, J. M., 2013, MNRAS, 433, L59
- [Patton et al. (2016)] Patton, D. R., Qamar, F. D., Ellison, S. L., Bluck, A. F. L., Simard, L., Mendel, J. T., Moreno, J., Torrey, P., 2016, MNRAS, 461, 2589
- [Pawlik et al. (2018)] Pawlik, M. M., et al., 2018, MNRAS, in press
- [Perez et al. (2011)] Perez, J., Michel-Dansac, L., Tissera, P. B., 2011, MNRAS, 417, 580
- [Pety et al. (2013)] Pety, J., et al., 2013, ApJ, 779, 43
- [Pontzen et al. (2017)] Pontzen, A., et al., 2017, MNRAS, 465, 547
- [Pop et al. (2018)] Pop, A.-R., Pillepich, A., Amorisco, N. C., Hernquist, L., 2018, MNRAS, submitted
- [Rafieferantsoa et al. (2015)] Rafieferantsoa, M., Dave, R., Angles-Alcazar, D., Katz, N., Kollmeier, J. A., Oppenheimer, B. D., 2015, MNRAS, 453, 3980
- [Renaud et al. (2014)] Renaud, F., Bournaud, F., Kraljic, K., Duc, P.-A., 2014, MNRAS, 442, L33
- [Rich et al. (2015)] Rich, J. A., Kewley, L. J., Dopita, M. A., 2015, ApJS, 221, 28
- [Rowlands et al. (2015)] Rowlands, K., Wild, V., Nesvadba, N., Sibthorpe, B., Mortier, A., Lehnert, M., da Cunha, E., 2015, MNRAS, 448, 258
- [Rupke, Kewley & Barnes (2010)] Rupke, D. S. N., Kewley, L. J., Barnes, J. E., 2010, ApJ, 710, L156
- [Safronov (1960)] Safronov, V. S., 1960, AnAp, 23, 979
- [Saintonge et al. (2012)] Saintonge, A., et al., 2012, ApJ, 758, 73
- [Saintonge (2016)] Saintonge, A., et al., 2016, MNRAS, 462, 1749
- [Salim et al. (2007)] Salim, S., et al, 2007, ApJS, 173, 267
- [Sancisi et al. (2008)] Sancisi, R., Fraternali, F., Oosterloo, T., van der Hulst, T., 2008, A&ARv, 15, 189
- [Satyapal et al. (2014)] Satyapal, S., Ellison, S. L., McAlpine, W., Hickox, R. C., Patton, D. R., Mendel, J. T., 2014, MNRAS, 441, 1297
- [Satyapal et al. (2017)] Satyapal, S., et al., 2017, ApJ, 848, 126
- [Schawinski et al. (2015)] Schawinski, K., Koss, M., Berney, S., Sartori, L. F., 2015, MNRAS, 451, 2517
- [Scudder et al. (2012b)] Scudder, J. M., Ellison, S. L., Torrey, P., Patton, D. R., Mendel, J. T., 2012, MNRAS, 426, 549
- [Sell et al. (2014)] Sell, P. H. et al., 2014, MNRAS, 441, 3417
- [Simard et al. (2011)] Simard, L., Mendel, J. T., Patton, D. R., Ellison S. L., McConnachie, A. W., 2011, ApJS, 196, 11
- [Smercina et al. (2018)] Smercina, A., et al., 2018, ApJ, 855, 51
- [Solanes et al. (2001)] Solanes, J. M., Manrique, A., Garcia-Gomez, C., Gonzalez-Casado, G., Giovanelli, R., Haynes, M. P., 2001, ApJ, 548, 97
- [Solomon & Sage (1988)] Solomon, P. M., & Sage, L. J., 1988, ApJ, 334, 613
- [Springob et al. (2005)] Springob, C. M., Haynes, M. P., Giovanelli, R., Kent, B. R.,
- [Stierwalt et al., 2015] Stierwalt, S., Besla, G., Patton, D., Johnson, K., Kallivayalil, N., Putman, M., Privon, G., Ross, G., 2015, ApJ, 805, 2
- [Suess et al. (2017)] Suess, K. A., Bezanson, R., Spilker, J. S., Kriek, M., Greene, J. E., Feldmann, R., Hunt, Q., Narayanan, D., 2017, ApJ, 846, L14
- [Tacconi et al. (1999)] Tacconi, L. J., Genzel, R., Tecza, M., Gallimore, J. F., Downes, D., Scoville, N. Z., 1999, ApJ, 524, 732
- [Teyssier et al. 2010)] Teyssier, R., Chapon, D., Bournaud, F., 2010, ApJ, 720, L149
- [Tonnesen & Cen (2012)] Tonnesen, S., & Cen, R., 2012, MNRAS, 425, 2313
- [Toomre (1964)] Toomre, A., 1964, ApJ, 139, 1217
- [Torrey et al. (2012)] Torrey, P., Cox, T. J., Kewley, L. J., Hernquist, L., 2012, ApJ, 746, 108
- [Ueda et al. (2014)] Ueda, J., et al. 2014, ApJS, 214, 1
- [Usero et al., (2015)] Usero, A., et al., 2015, AJ, 150, 115
- [van de Voort et al. (2018)] van de Voort, F., et al., 2018, MNRAS, 476, 122
- [Veilleux et al. (2013)] Veilleux, S., et al., 2013, ApJ, 776, 27
- [Violino et al. 2018] Violino, G., Ellison, S. L., Sargent, M., Coppin, K. E. K., Scudder, J. M., Mendel, J. T., Saintonge, A., MNRAS, 2018, 476, 2591
- [Wang et al. (2004)] Wang, J., Zhang, Q., Wang, Z., Ho, P. T. P., Fazio, G. G., Wu, Y., 2004, ApJ, 616, L67
- [Weigel et al. (2017)] Weigel, A. K., et al., 2017, ApJ, 845, 145
- [Weston et al. (2017)] Weston, M. E., McIntosh, D. H., Brodwin, M., Mann, J., Cooper, A., McConnell, A., Nielsen, J. L., 2017, MNRAS, 464, 3882
- [Woods & Geller (2007)] Woods, D. F., Geller, M. J., 2007, AJ, 134, 527
- [Wong et al. (2016)] Wong, O. I., Meurer, G. R., Zheng, Z., Heckman, T. M., Thilker, D. A., Zwaan, M. A., 2016, MNRAS, 460, 1106
- [Wu et al. 2005] Wu, J., Evans, N. J., II, Gao, Y., Solomon, P. M., Shirley, Y. L., Vanden Bout, P. A., 2005, ApJ, 635, L173
- [Yamashita et al. (2017)] Yamashita, T., et al., 2017, ApJ, 844, 96
- [Yang et al. (2007)] Yang, X., Mo, H. J., van den Bosch, F. C., Pasquali, A., Li, C., Barden, M., 2007, ApJ, 671, 153
- [Young et al. (2014)] Young, L. M., et al., 2014, MNRAS, 444, 3408
- [Yun & Hibbard (2001)] Yun, M. S., & Hibbard, J. E., 2001, ApJ, 550, 104
- [Zabludoff et al. (1996)] Zabludoff, A. I., Zaritsky, D., Lin, H., Tucker, D., Hashimoto, Y., Shectman, S. A., Oemler, A., Kirshner, R. P., 1996, ApJ, 466, 104
- [Zuo et al. (2018)] Zuo, P., Xu, C. K., Yun, M. S., Lisenfeld, U., Li, D., Cao, C., 2018, ApJ, in press
- [Zwaan et al. (2013)] Zwaan, M. A., Kuntschner, H., Pracy, M. B., Couch, W. J., 2013, MNRAS, 432, 492
Appendix A Arecibo spectra
Fig. 1 shows the first 12 H i detections from Table 1. In Figs. 11 and 2 we show the remaining detections and non-detections respectively.