Probing the 9.7 Interstellar Silicate Extinction Profile through the Spitzer/IRS Spectroscopy of OB Stars
Abstract
The 9.7 interstellar spectral feature, arising from the Si–O stretch of amorphous silicate dust, is the strongest extinction feature in the infrared (IR). In principle, the spectral profile of this feature could allow one to diagnose the mineralogical composition of interstellar silicate material. However, observationally, the 9.7 interstellar silicate extinction profile is not well determined. Here we utilize the Spitzer/IRS spectra of five early-type (one O- and four B-type) stars and compare them with that of unreddened stars of the same spectral type to probe the interstellar extinction of silicate dust around . We find that, while the silicate extinction profiles all peak at 9.7, two stars exhibit a narrow feature of FWHM 2.0 and three stars display a broad feature of FWHM 3.0. We also find that the width of the 9.7 extinction feature does not show any environmental dependence. With a FWHM of 2.2, the mean 9.7 extinction profile, obtained by averaging over our five stars, closely resembles that of the prototypical diffuse interstellar medium along the lines of sight toward Cyg OB2 No. 12 and WR 98a. Finally, an analytical formula is presented to parameterize the interstellar extinction in the IR at .
keywords:
ISM: dust, extinction – infrared: ISM – infrared: stars – stars: early-type1 Introduction
The wavelength dependence of the interstellar extinction, known as the interstellar extinction curve or the interstellar extinction law, varies substantially in the ultraviolet (UV) and optical wavelengths (see Draine 2003). Cardelli et al. (1989; hereafter CCM) found that this variation can be closely parameterized by a single parameter , where the dimensionless quantity is the total-to-selective extinction ratio between the band at and the band at . As varies from one region to another, the slope of the UV/optical extinction curve shows considerable variations from being steep in diffuse regions characterized by a smaller (typically ) to being flat in regions which are more dense and characterized by a larger (typically ; see Li et al. 2015). The 2175 extinction bump, the strongest spectral feature in the UV extinction curve, also varies with . While the peak wavelength of the 2175 bump is invariant, its width () increases with (see Figure 3.8 of Whittet 2003) and its height (), the excess extinction of the bump over the underlying linear background extinction, decreases with (see Figure 7 of CCM). In contrast, in the near- and mid-infrared wavelength range of , the interstellar extinction curve appears to be remarkably uniform over the sky and shows little variation with (e.g., see Martin & Whittet 1990, Wang & Jiang 2014, Xue et al. 2016).
At , the extinction curve exhibits a pronounced spectral feature at 9.7, the strongest extinction feature in the IR. This feature is attributed to the Si–O stretching absorption of silicate dust (Henning 2010). In principle, the spectral profile of the 9.7 silicate extinction feature allows one to diagnose the mineralogical composition of interstellar silicate material.111For example, based on the absence of any substructures in the interstellar 9.7 feature which is broad, smooth, and featureless, Li & Draine (2001), Kemper et al. (2004), Li et al. (2008), and Poteet et al. (2015) concluded that interstellar silicates are predominantly amorphous rather than crystalline. However, observationally, the spectral profile of the 9.7 silicate extinction is not as well determined as the UV/optical extinction curve, partly due to the substantial drop in extinction from the UV, optical to the IR. In the literature, one often relies on Mie theory together with the optical constants synthesized for “astronomical silicates” (Draine & Lee 1984) or the experimentally-measured optical constants of cosmic silicate analogues (e.g., see Jäger et al. 1994, Dorschner et al. 1995) to calculate the 9.7 extinction profile from submicron-sized spherical silicate grains.222For submicron-sized silicate grains, the calculated 9.7 extinction profile is insensitive to the exact grain size since they are in the Rayleigh regime (Bohren & Huffman 1983). The optical constants of “astronomical silicates” at 8–13 were constructed based on the Trapezium emission profile (Gillett et al. 1975) which peaks at 9.56 and has a full width of half maximum (FWHM) of 3.45 (Draine & Lee 1984).333The Trapezium emissivity profile was chosen because it appears to provide a good fit to the then 9.7 absorption band observed in dark clouds as well as emission by hot circumstellar dust around many oxygen-rich stars. Draine & Lee (1984) had already recognized that some stars with circumstellar emission do show a narrower 9.7 emission feature, e.g., the circumstellar 9.7 emission feature of Cephei (Roche & Aitken 1984), a red supergiant, peaks at 9.69 and has a width of 2.35. In contrast, the peak wavelength and FWHM of the 9.7 silicate extinction feature calculated from those experimentally-measured optical constants vary with the silicate composition (e.g., pyroxene vs. olivine) and the iron content (e.g., see Jäger et al. 1994, Dorschner et al. 1995).444It is well recognized that the peak wavelength of the 9.7 extinction profile of silicate dust depends on the level of SiO4 polymerization, e.g., it shifts from 9 for pure SiO2 to 9.7 for MgSiO3 to 10.25 for Mg2.4SiO4.4 (Jäger et al. 2003, Henning 2010).
Various efforts have been made to observationally determine the 9.7 interstellar extinction feature. However, the results were somewhat contradictory. Kemper et al. (2004) analyzed the 8–13 spectrum of the Galactic center source Sgr A∗ obtained with the Short Wavelength Spectrometer (SWS) on board the Infrared Space Observatory (ISO). The 9.7 silicate absorption profile of Sgr A∗, derived by subtracting a fourth-order polynomial continuum from the observed spectrum, peaks at 9.8 and has a FWHM of 1.73, much narrower than that of “astronomical silicates”. They suggested that the narrow profile could be caused by the contamination of the silicate emission intrinsic to the Sgr A∗ region. Chiar & Tielens (2006) obtained the 2.38–40 ISO/SWS spectra of the diffuse ISM along the lines of sight toward four heavily extinguished WC-type Wolf-Rayet stars. They found that the 9.7 silicate absorption features of those four sources all peak at 9.8, but their widths vary from 2.35 for WR 98a to 2.7 for WR 104.
McClure (2009) derived the 5–20 extinction curves for 28 G0–M4 III stars lying behind the Taurus, Chameleon I, Serpens, Barnard 59, Barnard 68 and IC 5146 molecular clouds. This was achieved by comparing the spectrum of each object obtained with the Infrared Spectrograph (IRS) on board the Spitzer Space Telescope with the stellar photospheric model spectrum of Castelli et al. (1997). She found that the 9.7 silicate extinction feature appears to be broadened in more heavily extinguished regions: on average, in regions with ,555McClure (2009) assumed which corresponds to . it peaks at 9.63 and has a FWHM of 2.15; in contrast, in regions with , it peaks at 9.82 and has a FWHM of 2.72. Olofsson & Olofsson (2011) derived the mid-IR extinction curve for a highly obscured M giant (# 947) behind the dark globule B 335 (, mag), using the 7–14 Spitzer/IRS spectrum complemented by the 5–16 spectrum obtained with the ISOCAM/CVF instrument on board ISO. They found that the 9.7 silicate extinction feature peaks at 9.2 and has a FWHM of 3.80. Also based on the Spitzer/IRS data, van Breemen et al. (2011) investigated the silicate absorption spectra of three sightlines toward diffuse clouds and four sightlines toward the Serpens, Taurus and Ophiuchi molecular clouds. They found that the 9.7 silicate absorption bands in the diffuse sightlines show a strikingly similar band shape and all closely resemble that of Sgr A∗ (Kemper et al. 2004), while the 9.7 features in the molecular sightlines differ considerably from that of Sgr A∗ by peaking at 9.72 and having a FWHM of 2.4. More recently, Fogerty et al. (2016) analyzed the Spitzer/IRS spectra of the 9.7 silicate optical depths of the diffuse ISM along the lines of sight toward Cyg OB2 No. 12, a heavily extinguished luminous B5 hypergiant with , and toward Ophiuchi, a lightly extinguished bright O9.5 star with . They found appreciable differences between the spectral profile of the 9.7 silicate absorption of Cyg OB2 No. 12 and that of Ophiuchi: while the former peaks at 9.74 and has a FWHM of 2.28, the latter peaks at 9.64 and has a FWHM of 2.34. Moreover, the contrast between the feature and the absorption continuum of the former exceeds that of the latter by 30%.
In this work, we shall make use of the Spitzer/IRS spectra of early-type O and B stars to derive the 9.7 interstellar silicate extinction feature. Differing from previous works, we will utilize the “pair” method, i.e., we will compare the Spitzer/IRS spectra of two stars of similar spectral types, with one star being obscured by interstellar dust while the other star unaffected by dust. In §2 we present the sample selection and in §3 we describe the extinction determination method. The results are presented and discussed in §4 and summarized in §5.
2 The Sample
Typically, red giants are used to trace the interstellar extinction in the IR (e.g., see Indebetouw et al. 2005, Flaherty et al. 2007, Gao et al. 2009, Zasowski et al. 2009, Majewski et al. 2011, Wang et al. 2013, Yuan et al. 2013, Davenport et al. 2014, Xue et al. 2016). This is because red giants are so bright that they are still “visible” in the IR even if they are severely obscured in the UV/optical. However, red giants are not suitable for studying the 9.7 interstellar silicate extinction feature since the gas-phase molecular absorption bands (e.g., the Si–O stretches of the SiO gas which extend from 8 to 11) intrinsic to red giants could contaminate the derivation of the interstellar silicate feature (e.g., see van Breemen et al. 2011). In contrast, early-type stars are usually free of circumstellar dust and are bright in the IR. Also, their stellar photospheric emission in the IR can be closely characterized by the Rayleigh-Jeans law. Therefore, the determination of the stellar emission in the IR of early-type stars is relatively straightforward and accurate. In this work, we shall choose early-type (O and B) stars as the tracers of the interstellar silicate extinction profiles.
To date, 17,000 low-resolution spectra have been obtained by Spitzer/IRS. These spectra were merged from four slits: SL2 (5.21–7.56), SL1 (7.57–14.28), LL2 (14.29–20.66), and LL1 (20.67–38.00). Chen et al. (2016) cross-identified the types of these objects in the SIMBAD database, supplemented with the photometric results from the 2MASS and WISE all-sky surveys. This cross-identification resulted in a database of 71 O stars, 271 B stars and 374 A stars. We take the following approach to select our sample:
-
•
We first exclude those showing silicate and/or polycyclic aromatic hydrocarbon (PAH) emission features. Although early-type stars are generally free of circumstellar dust, some B- and A-type stars could host a protoplanetary or debris disk which could emit at the 9.7 silicate feature (and even crystalline silicate features at 11.3, 18, 23, 28, 33, 40 and 60; see Henning & Meeus 2011) and/or the 3.3, 6.2, 7.7, 8.6, and 11.3 PAH features (see Seok & Li 2017). This procedure leads to the rejection of 38 stars which show amorphous and/or crystalline silicate features and seven stars showing PAH features.
-
•
We require the signal-to-noise ratio (S/N) of the Spitzer/IRS spectrum to exceed 30. Because of this requirement, we are left with 48 O stars, 214 B stars and 316 A stars.
-
•
To avoid saturation, for a star to be selected, we require it to be fainter than 5 mag in the 2MASS band, which is taken as the reference band for measuring the color excess. Because of this, Cyg OB2 No. 12 (an O star with a nominal 2MASS -band magnitude of 2.70) and Ophiuchi (a B star with a nominal magnitude of 2.62), which were used to trace the interstellar silicate extinction in Fogerty et al. (2016), are not included in our sample since they are much brighter than the saturation limit of 5 in .
-
•
To make sure that the line of sight is obscured sufficiently so that the 9.7 silicate extinction is appreciable, we require the color index to exceed 0.4, corresponding to a line-of-sight extinction of , which is comparable to three times of the photometric error.
While the peak extinction of the 9.7 silicate feature is comparable to , the extinction of the blue and red wings of the 9.7 silicate feature drops by a factor of 2 (e.g., see Xue et al. 2016). With , the entire 9.7 silicate extinction profile should be measurable.
The above selection process leads to the selection of some A stars. However, it turns out that those stars have systematically small color excess and weak silicate absorption. We therefore decide to drop all those A stars. Also, the free-free emission of supergiants, arising from stellar winds of hot plasma, may potentially deform the slope of the stellar emission in the IR and thus affect the derivation of the interstellar extinction curve.666Barlow & Cohen (1977) reported the detection of IR excess at wavelengths longward of 10 in O supergiants and attributed it to free-free emission. Also, to account for the free-free emission from the stellar wind of the B5 hypergiant Cyg OB2 No. 12, Fogerty et al. (2016) added an component in the IR spectrum. In the wavelength range of Spitzer/IRS, the ionized wind reveals itself through the 7.5 Pfund and 12.4 Humphries emission lines of hydrogen. Therefore, we exclude these stars which exhibit the 7.5 Pf and 12.4 Hu emission lines. As a result, the final sample consists of five stars (i.e., one O star and four B stars). Their locations in the Galaxy, spectral types, brightness in the 2MASS and WISE bands are listed in Table 1. Also tabulated in Table 1 is , the uncertainty of the 2MASS color index, which is at most 0.03mag for all the sightlines. The Spitzer/IRS spectra of the selected stars are taken from the Cornell Atlas of Spitzer/IRS Sources (CASSIS; Lebouteiller et al. 2011). The CASSIS atlas provides Spitzer/IRS spectra reduced using a dedicated spectral extraction pipeline which performs optimal extraction for point-like sources and a regular extraction for partially extended sources. A comparison with the spectra reduced from the Spitzer/IRS pipeline shows that the CASSIS spectra are better calibrated (e.g., the negative flux which frequently shows up in the Spitzer/IRS pipeline spectra essentially never shows up in the CASSIS spectra).
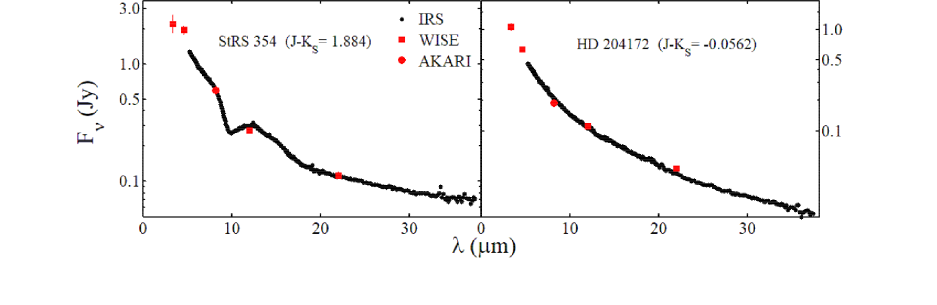
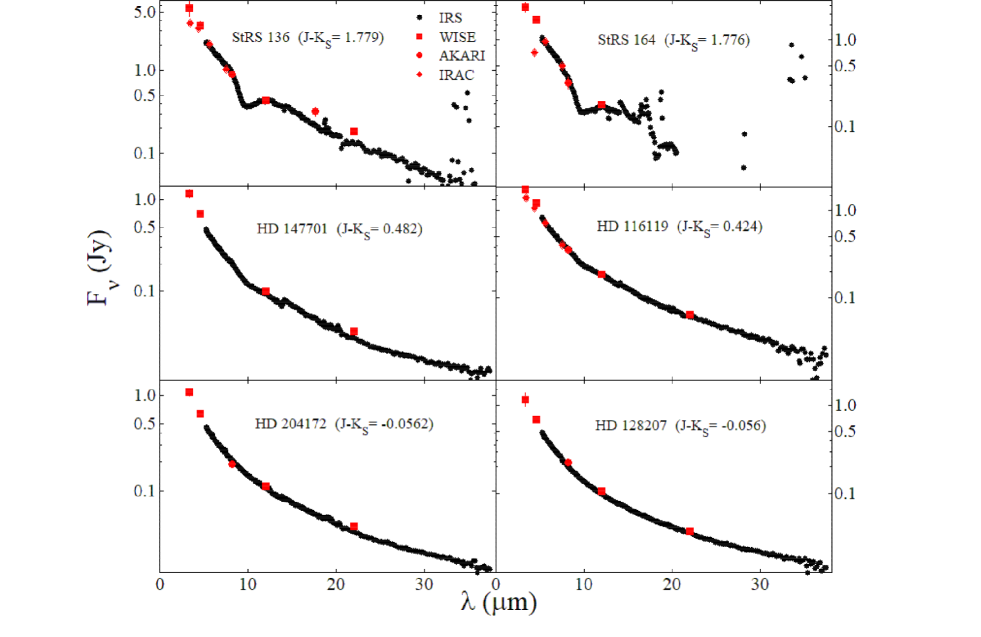
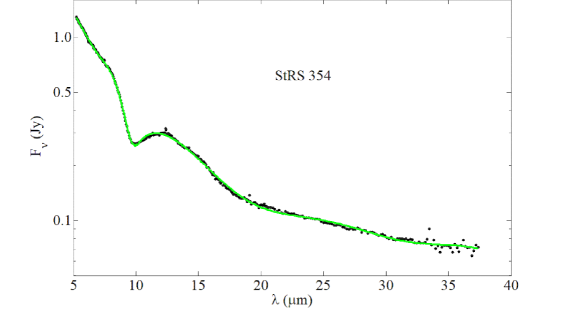
Since the flux calibration of the CASSIS spectra largely affects the reliability of the derived silicate extinction feature, we also use the IR photometric data from WISE, Spitzer/IRAC and AKARI to check the credibility of the CASSIS spectra. For each of our five target stars, we search for the photometric data in the four WISE bands at 3.35, 4.60, 11.56 and 22.08 for W1, W2, W3 and W4, respectively; the four Spitzer/IRAC bands at 3.55, 4.49, 5.73 and 7.87 for IRAC1, IRAC2, IRAC3, and IRAC4, respectively; and the two AKARI bands at 8.23 and 17.61 for S9W and L18W, respectively. The photometric data of the selected sources are listed in Table 2. As shown in Figures 1, 2, the photometry and spectroscopy of of our five target stars as well as two reference stars (see §3) are highly consistent. This also indirectly manifests that there is no light variation for these sources since the photometry and spectroscopy were not performed at the same epoch. The only exception is the W4-band photometry of StRS 164 which only yields an upper limit. Also, the Spitzer/IRS flux of StRS 164 is negative at . This implies that the measurement at may not be reliable for StRS 164. In Table 2, we label the W4-band flux of StRS 164 with “:”, which means “uncertain”. Nevertheless, all the sources show high consistency between photometry and spectroscopy at (i.e., the wavelength range of the Spitzer/IRS SL1 and SL2). As a result, the determination of the 9.7 silicate extinction profile is apparently more reliable than the 18 profile. In this work, we shall focus on the extinction at .
3 Method
The interstellar UV/optical extinction curve is often determined by comparing the spectrum of a reddened star with that of an un-reddened star of the same spectral type. We take a similar approach for the 9.7 silicate extinction.
The apparent stellar spectrum is the intrinsic spectrum dimmed by the interstellar extinction and the geometrical distance :
| (1) |
where is stellar radius. If the reference star has the same intrinsic spectrum as the target star, then the intrinsic flux ratio of the star at and can be substituted by that of the reference star, i.e., , where “ref” refers to the reference star. By comparing the observed spectrum of the source star with the apparent spectrum of the reference star, we obtain , the color excess between and the band, as
| (2) | |||
where and are respectively the apparent -band magnitudes of the source star and the reference star. Since we are considering the color excess instead of the extinction , we do not need to know the distance to the source star (or the reference star) as it gets cancelled out in eq. 2.
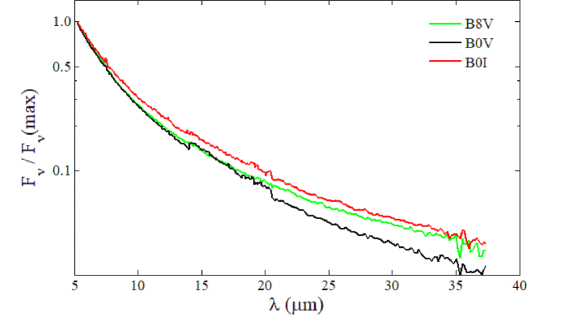
For each source star, we need to find a reference star which is not subject to any interstellar extinction but has the same intrinsic spectrum in the Spitzer/IRS wavelength range. In principle, an unreddened star of the same spectral type and the same luminosity class would be the best choice. For this purpose, we first attempt to select unreddened O and B stars by requiring the observed color index to be smaller than 0, i.e., bluer than an A0 star.777By definition, for A0 stars . However, this turns out to be impractical as it is difficult to find a reference star of the same spectral type and the same luminosity class for every source star. Specifically, all the source stars selected in this work are supergiants except HD 147701 which is classified as a giant, while most of the stars with are dwarfs. Therefore, it is desirable to somewhat relax the criteria: perhaps a reference star could be selected based on its spectral type or luminosity class alone? To this end, we explore which plays a more important role, the luminosity class or the spectral type, in affecting the slope of the stellar continuum in the IR, by comparing the stellar emission spectral energy distribution in the wavelength range of Spitzer/IRS for stars of the same luminosity class or of the same spectral type. As illustrated in Figure 3, the spectral slope of a B0V star in the wavelength range of 5–38 closely resembles that of a B8V star. In contrast, the spectral slope of a B0V star considerably differs from that of a B0I star. This demonstrates that the luminosity class affects the IR slope of the stellar emission more significantly than the spectral type.888This actually can be understood in terms of the Rayleigh-Jeans approximation, i.e., the stellar spectral type or effective temperature () has little effect on the IR slope of the stellar emission: provided , where is the Planck constant, is the speed of light, and is the Boltzman constant. Therefore, we choose HD 204172, a supergiant with and (see Table 1), as the reference star for the four supergiants (i.e., one O supergiant and three B supergiants) among our five source stars,999Koornneef (1983) measured the intrinsic color of B0I stars to be . This suggests that HD 204172 may suffer a reddening of . Consequently, this may bring up a reddening of in the Spitzer/IRS wavelength range, which is negligible. where is the slope of the 5–38 stellar emission, where is the stellar flux at frequency . HD 147701, a B5III star, is the only target star in our sample which is not classified as a supergiant. We could not find any reference star with the same luminosity class as HD 147701.101010We note that the classification of HD 147701 as a giant may be questionable since B5 stars are usually dwarfs or supergiants. Therefore, we take HD 128207, a B8V star with 111111This color index agrees rather well with that of Koornneef (1983) who measured for B8V stars. to be the reference star for HD 147701. Finally, we note that the integrated CO (1–0) line intensities along the lines of sight to HD 204172 (0.03) and HD 128207 (0.04) are rather small, as measured by Planck (see Planck Collaboration XIII 2014 and Table 1). This confirms that these reference stars experience no or negligible extinction.
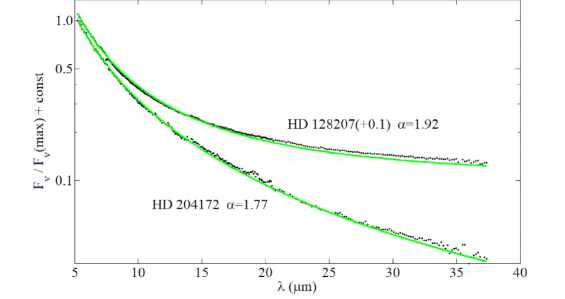
There are some small-amplitude spikes in the Spitzer/IRS spectra of both reference and source stars due to noise, although some may be ionic or atomic lines. These small spikes cause appreciable fluctuations in the color excess because the color excess comes from the division of the two spectra where the error propagation amplifies the uncertainty. Since we are mostly interested in the silicate feature, we smooth the observed spectra in the following way: (i) for the reference stars, the spectra are fitted with a power law (see Figure 4); (ii) for the source stars, the spectra are fitted with a polynomial function (e.g., see Figure 5). In this way, we may lose the information of some dust species (e.g., ices), but the profile of the silicate extinction will be better determined.
4 Results and Discussion
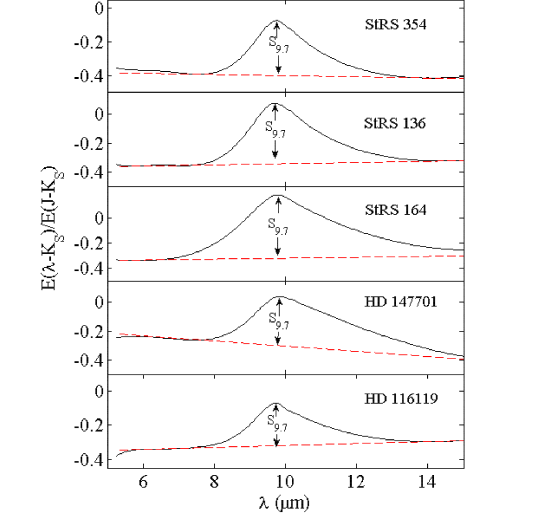
By comparing the Spitzer/IRS spectra of our five source stars with that of reference stars, we calculate the color excess . We further normalize by to cancel out the extinction quantity. In Figure 6 we show the color excess ratios for our five sources. Most noticeably, the 9.7 silicate extinction feature is pronounced in all five sources.
4.1 The 9.7 Silicate Extinction Profile
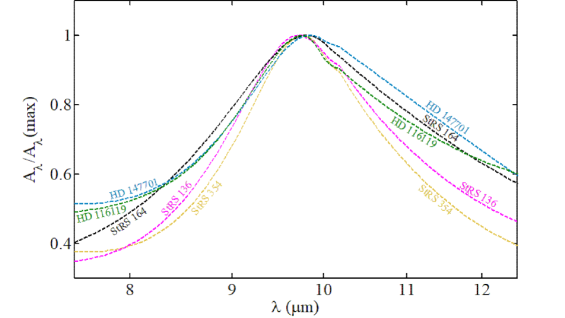
In Figure 7 we compare the extinction profiles of our five sources which are all normalized to their peak extinction at 9.7. It is apparent that the 9.7 silicate profiles exhibit appreciable variations in band width, with that of HD 147701 and StRS 164 being considerably wider than that of StRS 136 and StRS 354.
To be more quantitative, we determine the peak wavelength () and FWHM () of the 9.7 silicate extinction feature for each source by fitting the color excess curve with a Gaussian function peaking around 9.7 combined with a linear function representing the continuum extinction underlying the silicate feature (see Figure 6).
We tabulate in Table 3 the fitted and parameters, and strengths () of the 9.7 silicate extinction profiles feature derived from Figure 6.
It is apparent that the FWHM of the 9.7 extinction feature varies among our five sources. It appears that they fall into two groups: for StRS 136, StRS 354 and HD 116119,121212The red wing of the 9.7 feature of HD 116119 is rather flat (see Figure 6) and the continuum extinction underneath the 9.7 feature could have been overestimated and thus the derived band width could have been somewhat underestimated (see Figure 7). and for StRS 164 and HD 147701. This is consistent with the earlier findings of Roche & Aitken (1984, 1985) who found that, with , the silicate extinction profiles along the lines of sight to diffuse clouds and to the Galactic center are narrow, resembling the circumstellar silicate emission profile of the supergiant Cep, while the silicate extinction profiles of dense molecular clouds, with , are significantly broader, similar to the Trapezium emission profile. However, different results have also been reported in the literature. Rieke & Lebofsky (1985) derived for the 9.7 silicate extinction profile of the Galactic center sightlines toward three stars within 100′′ (5 pc) of the Galactic center,131313Rieke & Lebofsky (1985) computed the interstellar extinction law between 8 and 13 by assuming the 8–13 interstellar opacity profile to resemble the average of the emission spectra of Cep (Russell et al. 1975) and the Trapezium (Forrest et al. 1975) and adopting , where is the optical depth of the 9.7 silicate absorption. which is much broader than that of Roche & Aitken (1985), obtained for several mid-IR sources within 2 pc of the centre of the Galaxy. While Pegourie & Papoular (1985) determined for dense clouds, which is much narrower than that of Roche & Aitken (1984). See Figure 3 of Draine (1989) for a detailed comparison.
For our five sources, there does not seem to be any relation between and the interstellar environment. Both highly reddened lines of sight for which (i.e., StRS 136, StRS 354) and a moderately obscured line of sight with (i.e., HD 116119) exhibit a narrow 9.7 silicate extinction profile. Similarly, a broad 9.7 profile is also seen in both highly extinguished star (i.e., StRS 164) and moderately reddened star (i.e., HD 147701). McClure (2009) found that the 9.7 silicate extinction profile broadens at larger extinction of , based on a comparison of the Spitzer/IRS spectra of obscured G0–M4 stars with their stellar model atmospheric spectra. We note that some of her stars (e.g., M stars) may have intrinsic circumstellar silicate emission. Some of the sightlines considered here may trace dense clouds. The three most reddened sources (StRS 136, StRS 164 and StRS 354) have a color index of which corresponds to . They possibly traverse some dense medium. Indeed, the integrated CO (1-0) line intensities from Planck observations (Planck Collaboration XIII 2014), 425 and 186, respectively, for the StRS 136 and StRS 164 sightlines, are about one order of magnitude higher than that of the other sightlines (see Table 1). As a matter of fact, these two sources have the largest color excess ratio at 9.7, i.e., and 0.181, respectively. On the other hand, the CO line intensity of the StRS 354 sightline is only 18.9, one order of magnitude smaller than that of StRS 136 and StRS 164. With a much smaller color excess ratio, i.e., , it is likely that StRS 354 traces diffuse medium and its large color excess may originate from a pile of diffuse clouds along the sightline. The sightlines toward HD 116119 and HD 147701 unambiguously trace diffuse medium. They exhibit a color index of and , respectively, corresponding to (see Table 1). They also show small integrated CO intensities (6.0 and 13.5 respectively).
Interestingly, the peak wavelengths of the 9.7 extinction feature of our five source stars are rather stable: for all the three sightlines with , and for the two sightlines with . Although it appears that intends to slightly increase with , this cannot be explained in terms of the grain size effect (e.g., for a broadening of , “astronomical silicate” would shift the peak of the 9.7 profile by ; see Shao et al. 2017).
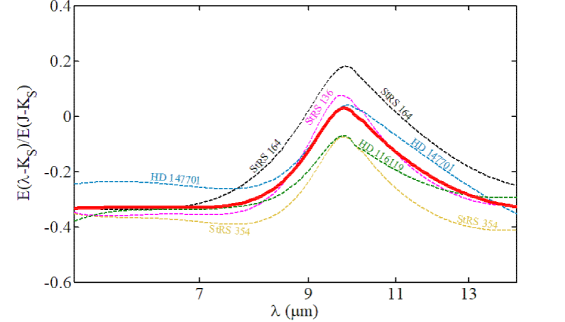
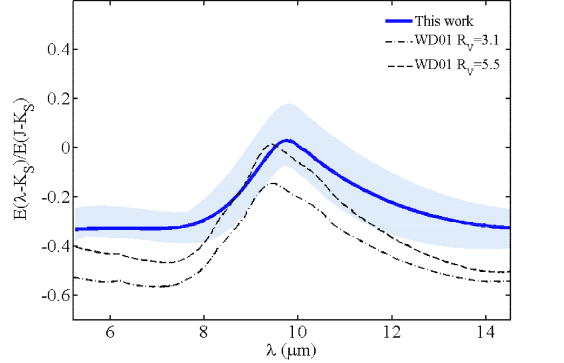
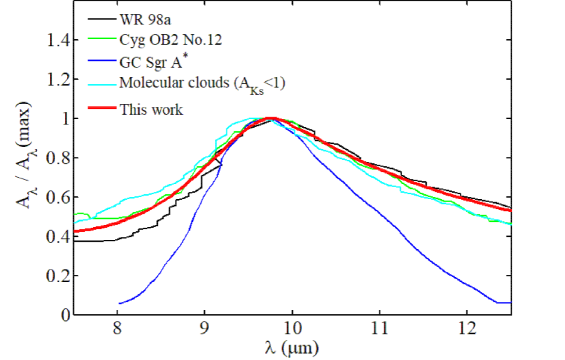
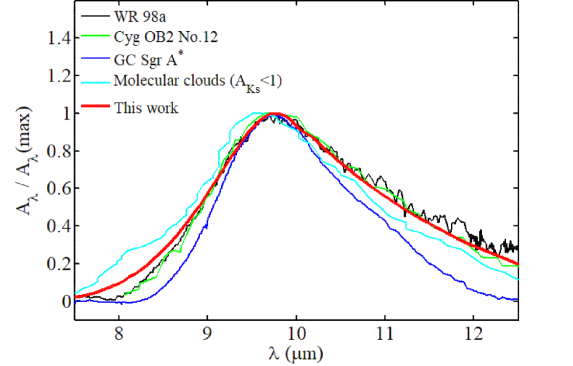
In Figure 8 we compare the 9.7 silicate extinction profiles of all five sources. It is apparent that the dispersion in is rather small. The mean profile, obtained by averaging over all five sources, peaks at and has a width of . In Figure 9 we compare the mean 9.7 extinction profile with that of the WD01 models for and . The 9.7 profiles of the WD01 model (i.e., and for , and and for ) are much broader and peak at a much shorter wavelength than the mean extinction profile derived in this work. This is not unexpected since the dielectric functions of “astronomical silicate” were synthesized based on the Trapezium emission profile which peaks at and has a width of (see Gillett et al. 1975, Draine & Lee 1984). Figure 10 compares the mean extinction profile of the 9.7 feature derived here (normalized to its maximum value) with that of Sgr A∗, a Galactic center source (Kemper et al. 2004), WR 98a, a heavily extinguished Wolf-Rayet star (Chiar & Tielens 2006), Cyg OB2 No. 12, a heavily extinguished hypergiant (Fogerty et al. 2016), and those molecular clouds of McClure (2009) with . Figure 11 is the the same as Figure 10, but with the continuum extinction underlying the 9.7 feature subtracted. It is apparent that the mean silicate profile derived in this work is appreciably broader than that of the GC source Sgr A∗, no matter the underlying continuum extinction is subtracted or not. It is in close agreement with that of WR 98a and Cyg OB2 No. 12, both of which are typical diffuse lines of sight. In contrast, the 9.7 silicate profile of McClure (2009) for molecular clouds with peaks at , although its width () is close to that of WR 98a, Cyg OB2 No. 12, and the one derived here. The discrepancy in the silicate absorption profiles may arise from grain size, shape, and more importantly, composition.
The extinction around the 9.7 silicate feature, expressed as the color excess ratio at , , varies from to 0.2, with a mean ratio of (see Table 5). In comparison, the WD01 model predicts for and for . As shown in Figure 9, the color excess ratio at derived here agrees better with that of the WD model. This is also true for the extinction ratio around the 9.7 feature derived by Xue et al. (2016) from the photometric data of Spitzer/IRAC, Spitzer/MIPS and WISE in the sense that it better matches the WD01 model (see Figure 20 in Xue et al. 2016). We attribute the variations in to grain size effects: for dense regions of , large grains of 0.5 will raise the continuum extinction underlying the 9.7 silicate feature and thus increase and . Indeed, as mentioned earlier, StRS 136 and StRS 164, the two sightlines which exhibit the largest color excess ratios, likely traverse dense clouds as revealed by the high CO (1-0) line intensities. According to the newest catalog of the Galactic molecular clouds (Rice et al. 2016), there are molecular clouds very close to the sightlines toward StRS 136 and StRS 164. In addition, the variations among the fractional contributions of other dust components (e.g., carbon dust) to the continuum extinction underneath the 9.7 silicate feature could also cause the variations of the color excess ratios at : a higher fractional contribution of carbon dust to the continuum extinction could raise .
Finally, we have also explored for our five sources. While it is relatively straightforward to derive , the 9.7 silicate absorption optical depth, from the observed, continuum-subtracted 9.7 extinction profile, it is less straightforward to determine , the visual extinction toward each of the source sightline. For each source star, we first calculate the color from its 2MASS magnitude and its SIMBAD magnitude and then compare it with the intrinsic color from the Allen’s Astrophysical Quantities (Cox 2000) for standard stars of the same spectral and luminosity types. This allows us to estimate the color excess . If is known, then one can derive from and : . We determine from the color excess based on the 2MASS data and adopt (Xue et al. 2017): . See Table 4 for the color and color excess data derived for our five source stars. In Table 3 we tabulate , , and for each source. It is apparent that, with an average ratio of , they are in close agreement with that of the solar neighborhood diffuse ISM for which (Roche & Aitken 1984), but substantially exceeding that of the Galactic center (, Roche & Aitken 1985) and the dust torus around active galactic nuclei (AGN; , Lyu et al. 2015). This suggests that the silicate grains in the interstellar clouds toward our five source stars could be considerably smaller than that toward the Galactic center and the AGN dust torus (see Shao et al. 2017).
4.2 Interstellar or Circumstellar?
As described in §2, the target sources are selected by excluding those showing the emission features of circumstellar amorphous silicates, crystalline silicates, and PAHs. However, circumstellar amorphous carbon or graphite could be present without being detected since it is featureless in the IR (e.g., see Rouleau & Martin 1991, Draine 2016).141414Pure crystalline graphite has a weak feature at 11.52 arising from the out-of-plane lattice resonance of graphite (Draine 1984). This feature has not been detected yet, e.g., by ISO/SWS or Spitzer/IRS. It may be observable with the MIRI spectrograph on James Webb Space Telescope (see Draine 2016). Also, circumstellar silicate could be present but its emission is hidden by the interstellar silicate extinction. To examine whether our sources could be surrounded by circumstellar dust, we follow van der Veen & Habing (1988) who proposed that the ratio of the IRAS 12 flux to the IRAS 25 flux could be used as an effective diagnosis of the presence or absence of circumstellar dust. Unfortunately, none of our five target sources was detected in the IRAS 12, 25, 60 and 100 bands. We therefore, instead, use the fluxes of the WISE W3 and W4 bands since they are closely similar to the IRAS 12 and 25 bands. To this end, the criterion of van der Veen & Habing (1988) for the presence of circumstellar dust becomes W3W4 1.0 (Jarrett et al. 2011; Sjouwerman et al. 2009).151515For example, Cyg OB2 No. 12, a prototypical diffuse sightline and known to be free of circumstellar dust, shows W3W4 0.4. As can be seen in Table 2, all our targets show W3W4 0.3 (except StRS 164 for which the WISE W4 flux may be uncertain), suggesting that our sources are free of circumstellar dust.
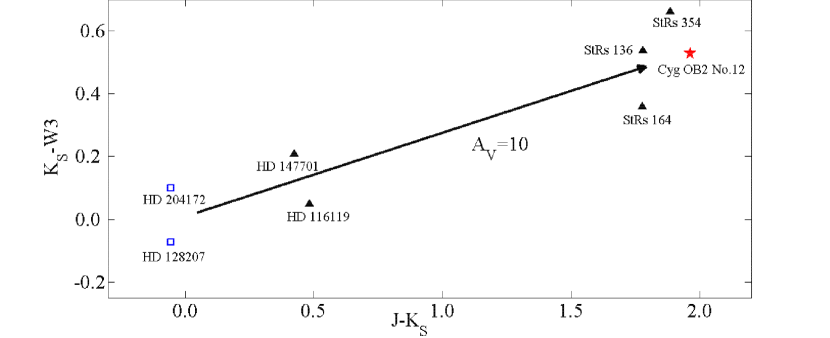
Xue et al. (2016) found that those stars with circumstellar silicate emission appear to display apparent color excess at in the vs. diagram (see Figure 19 in Xue et al. 2016). We show in Figure 12 the distribution of our five target stars in the vs. diagram, together with the average extinction tendency derived by Xue et al. (2016). It is noteworthy that all our stars follow the average extinction law reasonably well, indicating that our sources are free of circumstellar dust.
4.3 Analytical Representation of the Extinction
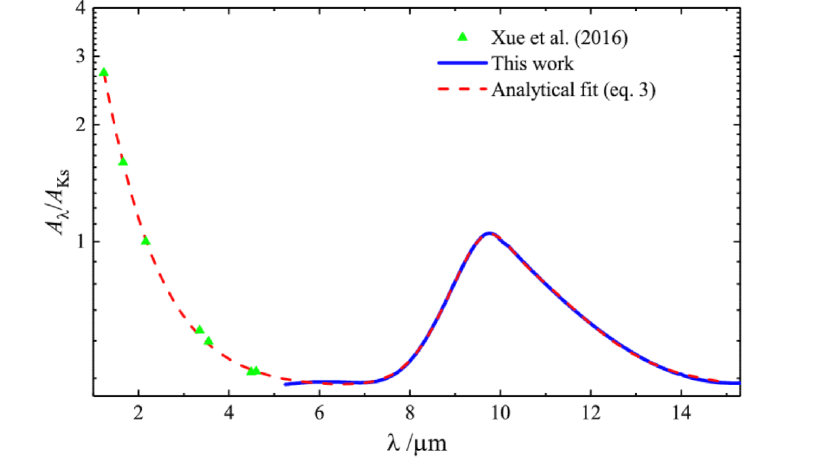
We fit the extinction in the near-IR measured by Xue et al. (2016) and the extinction around the 9.7 silicate band derived here with the following formula:
| (3) | |||||
where ; , ; , ; , , , , ; , , and . In Figure 13 we show the observationally determined IR extinction and the analytically fitted extinction. We should note that eq. (3) is valid for and should not be extrapolated to longer wavelengths since given by eq. (3) does not seem to decline more rapidly than which is required by the Kramers-Kronig relation (see Draine 2004).
5 Summary
We have selected one O-type and four B-type stars to trace the interstellar silicate extinction. For each star, we have determined the silicate extinction profile around 9.7 by comparing its Spitzer/IRS spectrum with that of unreddened reference star. Our principal results are as follows:
-
1.
The silicate extinction features of all our five sources peak around 9.69–9.87, appreciably longer than that of “astronomical silicates”.
-
2.
The width of the 9.7 silicate extinction feature appears to bifurcate into two groups, a narrow one with a FWHM of (for three stars) and a broad one with (for two stars). The width does not show any environmental dependence.
-
3.
With and , the mean 9.7 extinction profile, obtained by averaging over our five stars, closely resembles that of the diffuse interstellar medium along the lines of sight toward Cyg OB2 No. 12 for which and and WR 98a for which and .
-
4.
The mean ratio of the visual extinction to the 9.7 silicate absorption optical depth is , in close agreement with that of the solar neighborhood diffuse ISM but substantially exceeding that of the Galactic center and the dust torus around AGNs.
-
5.
The color excess ratio at the peak wavelength of the 9.7 silicate feature, , is somewhat higher for the lines of sight with a higher CO (1-0) line intensity. We interpret this in terms of grain size effects: in dense regions, the presence of large grains would raise the continuum extinction underlying the 9.7 feature and thus increase .
-
6.
An analytical formula is presented to parameterize the interstellar IR extinction.
Acknowledgements
We thank B.T. Draine, S. Gao and the anonymous referee for their very helpful comments and suggestions. This work is supported by NSFC through Projects 11373015, 11533002, U1631104, and 973 Program 2014CB845702. This work made use of the data taken mainly by Spitzer/IRS, WISE and 2MASS.
References
- [Barlow & Cohen (1977)] Barlow, M. J., & Cohen, M. 1977, ApJ, 213, 737
- [Bohren & Huffman (1983)] Bohren, C.F., & Huffman, D. R. 1983, Absorption and Scattering of Light by Small Particles, Wiley, New York
- [Cardelli et al.(1989)] Cardelli, J. A., Clayton, G. C., & Mathis, J. S. 1989, ApJ, 345, 245 (CCM)
- [Castelli et al.(1997)] Castelli, F., Gratton, R. G., & Kurucz, R. L. 1997, A&A, 318, 841
- [Chen et al.(2016)] Chen, R., Luo, A., Liu, J. M., & Jiang, B.W. 2016, AJ, 151, 146
- [Chiar & Tielens (2006)] Chiar, J. E., & Tielens, A. G. G. M. 2006, ApJ, 637, 774
- [Cox 2000] Cox, A. N. 2000, ed., Allen s Astrophysical Quantities, Springer, New York
- [Davenport et al.(2014)] Davenport, J. R. A., Ivezi, ., Becker, A. C., et al. 2014, MNRAS, 440, 3430
- [Dorschner et al.(1995)] Dorschner, J., Begemann, B., Henning, Th., Jaeger, C., & Mutschke, H. 1995, A&A, 300, 503
- [Draine (1984)] Draine, B. T. 1984, ApJL, 277, L71
- [Draine (1989)] Draine, B. T. 1989, in Infrared Spectroscopy in Astronomy, ed. B. H. Kaldeich (ESA Special Publication, Vol. 290; Noordwijk: ESA), 93
- [Draine (2003)] Draine, B. T. 2003, ARA&A, 41, 241
- [Draine (2004)] Draine, B. T. 2004, in The Cold Universe, ed. A. W. Blain et al. (Berlin: Springer), 213
- [Draine (2016)] Draine, B. T. 2016, ApJ, 831, 109
- [Draine & Lee (1984)] Draine, B.T., & Lee, H.M. 1984, ApJ, 318, 485
- [Flaherty et al.(2007)] Flaherty, K. M., Pipher, J. L., Megeath, S. T., et al. 2007, ApJ, 663, 1069
- [Fogerty et al.(2016)] Fogerty, S., Forrest, W., Watson, D. M., Sargent, B. A., & Koch, I. 2016, ApJ, 183, 71
- [Forrest et al.(1975)] Forrest, W. J., Gillett, F. C., & Stein, W. A. 1975, ApJ, 195, 423
- [Gao et al.(2009)] Gao, J., Jiang, B. W., & Li, A. 2009, ApJ, 707, 89
- [Gillett et al.(1975)] Gillett, F. C., Forrest, W. J., Merrill, K. M., Soifer, B. T., & Capps, R. W. 1975, ApJ, 200, 609
- [Henning (2010)] Henning, Th., 2010, ARA&A, 48, 21
- [Henning & Meeus (2011)] Henning, Th., & Meeus, G. 2011, in Physical Processes in Circumstellar Disks around Young Stars, ed. P. J. V. Garcia (Chicago, IL: Univ. Chicago Press), 114
- [Indebetouw et al.(2005)] Indebetouw, R., Mathis, J. S., Babler, B. L., et al. 2005, ApJ, 619, 931
- [Jäger et al.(1994)] Jäeger, C., Mutschke, H., Begemann, B., Dorschner, J., & Henning, Th. 1994, A&A, 292, 641
- [Jäger et al.(2003)] Jäger, C., Dorschner, J., Mutschke, H., Posch, T., & Henning, Th. 2003, A&A, 408, 193
- [Jarrett et al.(2011)] Jarrett, T. H., Cohen, M., Masci, F., et al. 2011, ApJ, 735, 112
- [Kemper et al.(2004)] Kemper, F., Vriend, W. J., & Tielens, A. G. G. M. 2004, ApJ, 609, 826
- [Koornneef (1983)] Koornneef, J., 1983, A&A, 128, 84
- [Lebouteiller et al.(2011)] Lebouteiller, V., Barry, D. J., Spoon, H. W. W., et al. 2011, ApJS, 196, 8
- [Li & Draine (2001)] Li, A., & Draine, B. T. 2001, ApJ, 550, L213
- [Li et al.(2015)] Li, A., Wang, S., Gao, J., & Jiang, B.W. 2015, in Lessons from the Local Group, ed. Freeman, K.C., Elmegreen, B.G., Block, D.L. & Woolway, M. (Springer: New York), 85 (arXiv: 1507.06604)
- [Li et al.(2008)] Li, M. P., Shi, Q. J., & Li, A. 2008, MNRAS, 391, L49
- [Majewski et al.(2011)] Majewski, S. R., Zasowski, G., Nidever, & D. L. 2011, ApJ, 739, 25
- [Martin & Whittet (1990)] Martin, P. G., & Whittet, D. C. B. 1990, ApJ, 357, 113
- [McClure (2009)] McClure, M. 2009, ApJ, 693, L81
- [Olofsson & Olofsson (2011)] Olofsson, S. & Olofsson, G. 2011, A&A, 534, 127
- [Pegourie & Papoular(1985)] Pegourie, B., & Papoular, R. 1985, A&A, 142, 451
- [Poteet et al.(2015)] Poteet, C.A., Whittet, D.C.B., & Draine, B.T. 2015, ApJ, 801, 110
- [Planck Collaboration XIII(2014)] Planck Collaboration XIII. 2014, A&A, 571, A13
- [Rice et al.(2016)] Rice, T.S., Goodman, A.A., Bergin, E.A., Beaumont, C., & Dame, T.M. 2016, ApJ, 822, 52
- [Rieke & Lebofsky (1985)] Rieke, G. H., & Lebofsky, M. J. 1985, ApJ, 288, 618
- [Roche & Aitken.(1984)] Roche, P. F., & Aitken, D.K. 1984, MNRAS, 208, 481
- [Roche & Aitken.(1985)] Roche, P. F., & Aitken, D.K. 1985, MNRAS, 215, 425
- [Rouleau & Martin (1991)] Rouleau, F., & Martin, P. G. 1991, ApJ, 377, 526
- [Russell et al.(1975)] Russell, R. W., Soifer, B. T., & Forrest, W. J. 1975, ApJL, 198, 41
- [Seok & Li (2017)] Seok, J. Y., & Li, A. 2017, ApJ, 835, 291
- [Shao et al.(2017)] Shao, Z. Z., Jiang, B. W., & Li, A. 2017, ApJ, 840, 27
- [Sjouwerman et al.(2009)] Sjouwerman, L. O., Capen, S. M., & Claussen, M. J. 2009, ApJ, 705, 1554
- [van Breemen et al.(2011)] van Breemen, J. M., Min, M., Chiar, J.E., et al. 2011 A&A 526, A152
- [van der Veen & Habing (1988)] van der Veen, W. E. C. J., & Habing, H. J. 1988, A&A, 194, 125
- [Wang et al.(2013)] Wang, S., Gao, J., Jiang, B. W., Li, A., & Chen, Y. 2013, ApJ, 773, 30
- [Wang & Jiang (2014)] Wang, S., & Jiang, B. W. 2014, ApJ, 788, L12
- [Weingartner & Draine (2001)] Weingartner, J. C., & Draine, B. T. 2001, ApJ, 548, 296 (WD01)
- [Whittet (2003)] Whittet, D. C. B. 2003, Dust in the Galactic Environment (2nd ed; Bristol: Institute of Physics Publishing)
- [Xue et al.(2016)] Xue, M. Y., Jiang, B. W., Gao, J., et al. 2016, ApJS, 224, 18
- [Yuan et al.(2013)] Yuan, H. B., Liu, X. W., & Xiang, M. S. 2013, MNRAS, 430, 2188
- [Zasowski et al.(2009)] Zasowski, G., Majewski, S. R., Indebetouw, R., et al. 2009, ApJ, 707, 510
| Object | Type | S/N | Note | |||||
|---|---|---|---|---|---|---|---|---|
| (degrees) | (degrees) | (mag) | (mag) | (K km) | ||||
| StRS 354 | O7 | 076.97 | 57 | 1.88 | 0.03 | 18.95 | target | |
| StRS 136 | B8I | 000.04 | 74 | 1.78 | 0.03 | 425.26 | target | |
| StRS 164 | B8I | 014.21 | 69 | 1.78 | 0.03 | 185.70 | target | |
| HD 116119 | B8Ia | 306.62 | +00.63 | 59 | 0.42 | 0.02 | 40.85 | target |
| HD 147701 | B5III(?) | 352.25 | +16.85 | 43 | 0.48 | 0.03 | 13.50 | target |
| HD 204172 | B0I | 83.39 | 9.96 | 47 | 0.06 | 0.03 | 0.03 | reference |
| HD 128207 | B8V | 323.84 | +18.35 | 76 | 0.06 | 0.03 | 0.04 | reference |
| Object | J | H | W1 | IRAC1 | IRAC2 | W2 | IRAC3 | IRAC4 | AKARI9 | W3 | AKARI18 | W4 | ||
| 1.235 | 1.662 | 2.159 | 3.353 | 3.507 | 4.437 | 4.603 | 5.628 | 7.589 | 8.228 | 11.561 | 17.609 | 22.088 | Note | |
| (mag) | (mag) | (mag) | (mag) | (mag) | (mag) | (mag) | (mag) | (mag) | (mag) | (mag) | (mag) | (mag) | ||
| StRS 354 | 7.620 | 6.369 | 5.736 | 5.352 | 4.847 | 4.745 | 5.073 | 4.669 | target | |||||
| StRS 136 | 6.880 | 5.725 | 5.101 | 4.338 | 4.685 | 4.736 | 4.227 | 4.383 | 4.363 | 4.318 | 4.562 | 3.824 | 4.129 | target |
| StRS 164 | 7.662 | 6.499 | 5.886 | 5.262 | 5.992 | 4.993 | 5.212 | 5.245 | 5.198 | 5.527 | 6.670: | target | ||
| HD 116119 | 6.121 | 5.876 | 5.697 | 5.599 | 5.728 | 5.548 | 5.351 | 5.518 | 5.478 | 5.307 | 5.488 | 5.276 | target | |
| HD 147701 | 6.668 | 6.378 | 6.186 | 6.046 | 5.956 | 6.137 | 5.886 | target | ||||||
| HD 204172 | 6.085 | 6.080 | 6.141 | 6.140 | 6.056 | 6.001 | 6.041 | 5.736 | reference | |||||
| HD 128207 | 5.959 | 6.052 | 6.015 | 6.048 | 5.992 | 5.807 | 6.087 | 5.882 | reference |
‘:’ The photometric data is somewhat uncertain.
| Object | Reference | ||||||
| (m) | (m) | (mag) | |||||
| StRS 354 | 9.75 | 1.78 | 0.33 | 12.2 | 0.58 | 21.0 | |
| StRS 136 | 9.69 | 2.11 | 0.42 | 11.9 | 0.71 | 16.8 | |
| StRS 164 | 9.81 | 2.99 | 0.50 | 11.4 | 0.82 | 14.0 | |
| HD 147701 | 9.87 | 3.07 | 0.35 | 3.01 | 0.17 | 17.7 | |
| HD 116119 | 9.75 | 1.90 | 0.25 | 2.38 | 0.11 | 21.6 | |
| Average | 9.75 | 2.20 | 0.36 | 18.2 | |||
| WD01 | 9.51 | 3.01 | 14.5 | ||||
| WD01 | 9.45 | 3.55 | 14.2 | ||||
| WR 98a | 9.77 | 2.35 | 12.4 | 0.78 | 15.9 | Chiar & Tielens 2006 | |
| Cyg OB2 No. 12 | 9.74 | 2.28 | 10.2 | 0.59 | 17.3 | Fogerty et al. 2016 | |
| GC Sgr A∗ | 9.77 | 1.73 | Kemper et al. 2004 |
| Object | Type | a | b | c | |||
|---|---|---|---|---|---|---|---|
| (mag) | (mag) | (mag) | (mag) | (mag) | (mag) | ||
| StRS 354 | O7 | 1.884 | |||||
| StRS 136 | B8I | 1.779 | 10.829 | ||||
| StRS 164 | B8I | 1.776 | 0.07 | 10.344 | |||
| HD 147701 | B5III | 0.482 | 2.701 | ||||
| HD 116119 | B8I | 0.424 |
a: Data taken from 2MASS
b: Data taken from SIMBAD
c: Data taken from Cox(2000)
*: Intrinsic color index of O9I
due to the lack of data for O7I-type stars
**: Intrinsic color index of B5V
due to the lack of data for B5III-type stars
| H | W1 | W2 | W3 | W4 | ||
| StRS 354 | 0.358 | |||||
| StRS 136 | 0.373 | 0.076 | ||||
| StRS 164 | 0.368 | 0.649: | 0.181 | |||
| HD 147701 | 0.288 | 0.040 | ||||
| HD 116119 | 0.500 | |||||
| Average | 0.377 | 0.031 | ||||
| RMS | 0.077 | 0.094 | 0.060 | 0.054 | 0.144 | 0.107 |
| WD01 | 0.392 | |||||
| WD01 | 0.331 | |||||
| Xue et al. (2016) | 0.348 |