Joint and predictions for collisions at the LHC within DREENA-C framework
Abstract
In this paper, we presented our recently developed DREENA-C framework, which is a fully optimized computational suppression procedure based on our state-of-the-art dynamical energy loss formalism in constant temperature finite size QCD medium. With this framework, we for the first time, generated joint and predictions within our dynamical energy loss formalism. The predictions are generated for both light and heavy flavor probes, and different centrality regions in collisions at the LHC, and compared with the available experimental data. Despite the fact that DREENA-C does not contain medium evolution (to which is largely sensitive) and the fact that other approaches faced difficulties in explaining data, we find that DREENA-C leads to qualitatively good agreement with this data, though quantitatively, the predictions are visibly above the experimental data. Intuitive explanation behind such results is presented, supporting the validity of our model, and it is expected that introduction of evolution in the ongoing improvement of DREENA framework, will lead to better joint agreement with and data, and allow better understanding of the underlying QCD medium.
pacs:
12.38.Mh; 24.85.+p; 25.75.-qI Introduction
Quark-gluon plasma (QGP) is a new state of matter Collins ; Baym consisting of interacting quarks, antiquarks and gluons. Such new state of matter is created in ultra-relativistic heavy ion collisions at Relativistic Heavy Ion Collider (RHIC) and Large Hadron Collider (LHC). Rare high momentum probes, which are created in such collisions and which transverse QGP, are excellent probes of this extreme form of matter QGP1 ; QGP2 ; QGP3 . Different observables (such as angular averaged nuclear modification factor and angular anisotropy ), together with probes with different masses, probe this medium in a different manner. Therefore, comparing comprehensive set of joint predictions for different probes and observables, with available experimental data at different experiments, collision systems and collision energies, allows investigating properties of QCD medium created in these collisions Bjorken ; DG_PRL ; Kharzeev , i.e. QGP tomography.
With this goal in mind, we developed state-of-the-art dynamical energy loss formalism MD_PRC ; DH_PRL , which includes different important effects. Namely, i) contrary to the widely used approximation of static scattering centers, this formalism takes into account that QGP consists of dynamical (that is moving) partons and that created medium has finite size. ii) The calculations are based on the finite temperature field theory Kapusta ; Le_Bellac , and generalized HTL approach. iii) The formalism takes into account both radiative MD_PRC and collisional MD_Coll energy losses, is applicable to both light and heavy flavor, and has been generalized to the case of finite magnetic MD_MagnMass mass and running coupling MD_PLB . This formalism was further integrated into numerical procedure MD_PLB , which includes initial distribution of leading partons Vitev0912 , energy loss with path-length Dainese ; WHDG and multi-gluon GLV_suppress fluctuations, and fragmentation functions DSS ; BCFY ; KLP , to generate the final medium modified distribution of high pt hadrons.
However, due to the complexity of this model, the model does not take into account the medium evolution, which is a necessary ingredient for QGP tomography. Therefore, our future major task is redeveloping the dynamical energy loss model, and the corresponding numerical procedure, so that it accounts for evolving QGP medium. Equally important, the framework has to be able to efficiently generate predictions to be compared with a wide range of available (or upcoming) experimental data. Within this, all ingredients stated above have to be kept (with no additional simplifications used in the numerical procedure), as all of these ingredients were shown to be important for reliable theoretical predictions of jet suppression BD_JPG .
As a first step towards this major goal, we here developed a numerical framework DREENA-C (Dynamical Radiative and Elastic ENergy loss Approach), where ”C” denotes constant temperature QCD medium. This framework is in its essence equivalent to the numerical procedure presented in MD_PLB , with the difference that the code is now optimized to use minimal computer resources and produce predictions within more than two orders of magnitude shorter time compared to MD_PLB . Such step is necessary, as all further improvements of the framework, necessarily need significantly more computer time and resources, so without this step, further improvements would not be realistically possible. That is, DREENA-C framework, addresses the goal of efficiently generating predictions for diverse observables, while the goal of introducing the medium evolution will be a subject of our future work.
With DREENA-C framework, we will in this paper, for the first time, present joint and theoretical predictions within our dynamcial energy loss formalism. These predictions will be generated for all available light and heavy observables in collisions at the LHC, and for various centrality regions. Motivation for generating these predictions is the following: i) The theoretical models up-to-now were not able to jointly explain these data, which is known as v2 puzzle v2Puzzle . That is, the models lead to underprediction of , unless new phenomena (e.g. magnetic monopoles) are introduced CUJET3 . ii) Having this puzzle in mind, comparison of our theoretical predictions with comprehensive set of experimental and data, allows testing to what extent state-of-the-art energy loss model, but with no QGP evolution included, is able to jointly explain these data. iii) The predictions will establish an important baseline for testing how future introduction of the medium evolution will improve the formalism.
II Methods
DREENA-C framework is fully optimized numerical procedure, which contains all ingredients presented in detail in MD_PLB . We below briefly outline the main steps in this procedure.
The quenched spectra of light and heavy flavor observables are calculated according to the generic pQCD convolution:
| (1) | |||||
Subscripts ”” and ”” correspond, respectively, to ”initial” and ”final”, and denotes initial light or heavy flavor jet. denotes the initial momentum spectrum, which are computed according to Vitev0912 , is the energy loss probability, computed within the dynamical energy loss formalism MD_PRC ; DH_PRL , with multi-gluon GLV_suppress , path-length fluctuations WHDG and running coupling MD_PLB . is the fragmentation function of light and heavy flavor parton to hadron , where for light flavor, D and B mesons we use, DSS DSS , BCFY BCFY and KLP KLP fragmentation functions, respectively.
As noted above, we model the medium by assuming a constant average temperature of QGP. We concentrate on TeV collisions at the LHC, though we note that these predictions will be applicable for TeV collisions as well, since the predictions for these two collision energies almost overlap MD_5TeV . The temperatures for different centralities in TeV collisions are calculated according to DDB_PLB . As a starting point in this calculation we use the effective temperature () of 304 MeV for 0-40 centrality TeV Pb+Pb collisions at the LHC ALICE_T experiments (as extracted by ALICE); e.g. leading to 335 MeV temperature for 0-10% central TeV collisions (for more details see MD_5TeV ). Path-length distributions are calculated following the procedure described in Dainese , with an additional hard sphere restriction in the Woods-Saxon nuclear density distribution to regulate the path lengths in the peripheral collisions.
In numerical calculations, we consider a QGP with GeV and . The temperature dependent Debye mass is obtained from Peshier , while for the light quarks, we assume that their mass is dominated by the thermal mass , and the gluon mass is DG_TM . The charm (bottom) mass is GeV ( GeV). Finite magnetic mass effect is also included in our framework MD_MagnMass , as various non-perturbative calculations Maezawa ; Nakamura ; Hart ; Bak have shown that magnetic mass is different from zero in QCD matter created at the LHC and RHIC. Magnetic to electric mass ratio is extracted from these calculations to be , so presented uncertainty in the predictions, will come from this range of screening masses ratio. Note that we use no fitting parameters in comparison with the data, i.e. all the parameters correspond to standard literature values.
III Results and discussion

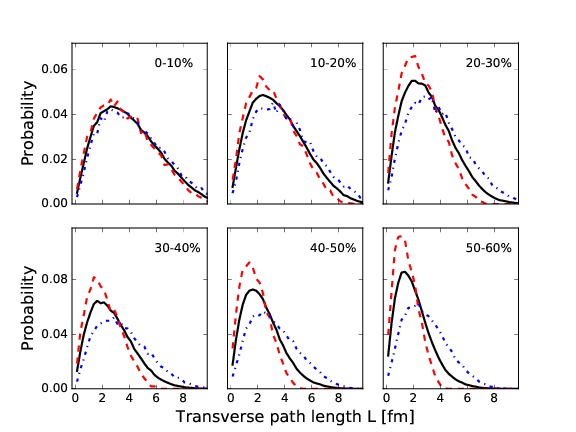
In this section, we will generate joint and predictions for charged hadrons, D and B mesons in collisions at the LHC. In Figure 1 we first show probability distributions for hard parton path lengths in Pb+Pb collisions for different centralities, obtained by the procedure specified in the previous section. For most central collisions, we observe that in-plane and out-of-plane distributions almost overlap with the total (average) path-length distributions, as expected. As the centrality increases, in-plane and out-of-plane distributions start to significantly separate (in different directions) from average path-length distributions. Having in mind that
| (2) |
this leads the expectation of being small in most central collisions and increasing with increasing centrality.

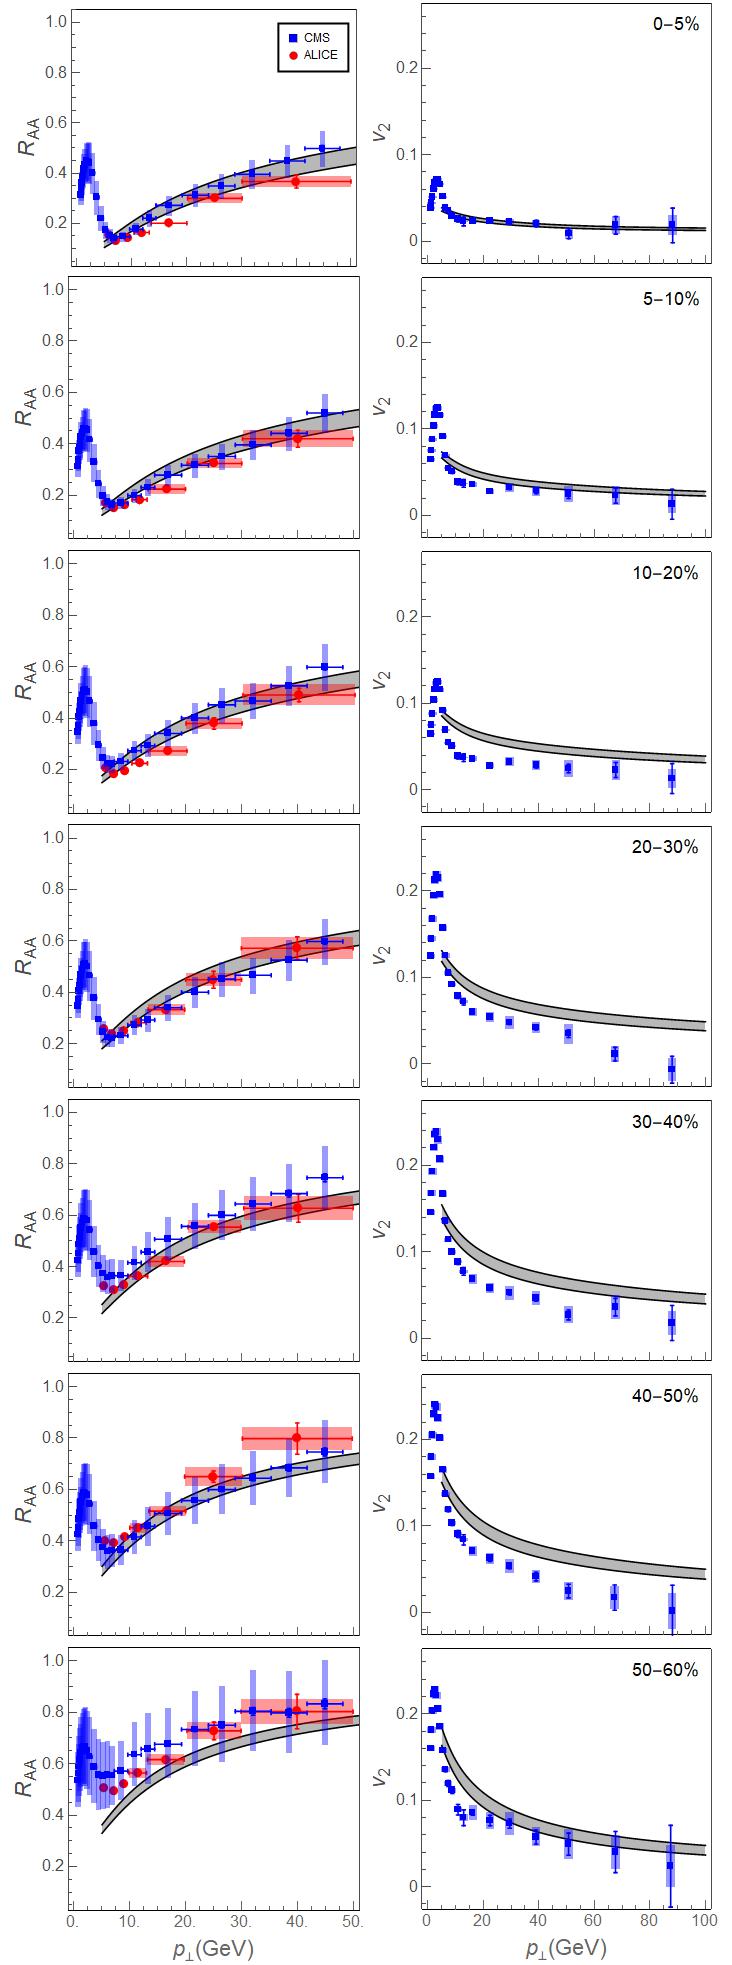
Based on path-length distributions from Figure 1, we can now calculate average , as well as in-plane and out-of-plane s ( and ), and consequently for both light and heavy flavor probes and different centralities. We start by generating predictions for charged hadrons, where data for both and are available. Comparison of our joint predictions with experimental data is shown in Figure 2, where left and right panels correspond, respectively, to and . We see good agreement with data, which is expected based on our previous studies MD_PRL ; MD_PLB ; DDB_PLB ; MD_5TeV ; DBZ ; MD_PLB16 . Regarding , we surprisingly see that our model actually leads to qualitatively good agreement with the data. Even more surprisingly, we see that our predictions are visibly above the data. This is in contrast with other energy loss models which consistently lead to underprediction of , where, to resolve this, new phenomena (e.g. magnetic monopoles) were introduced CUJET3 .

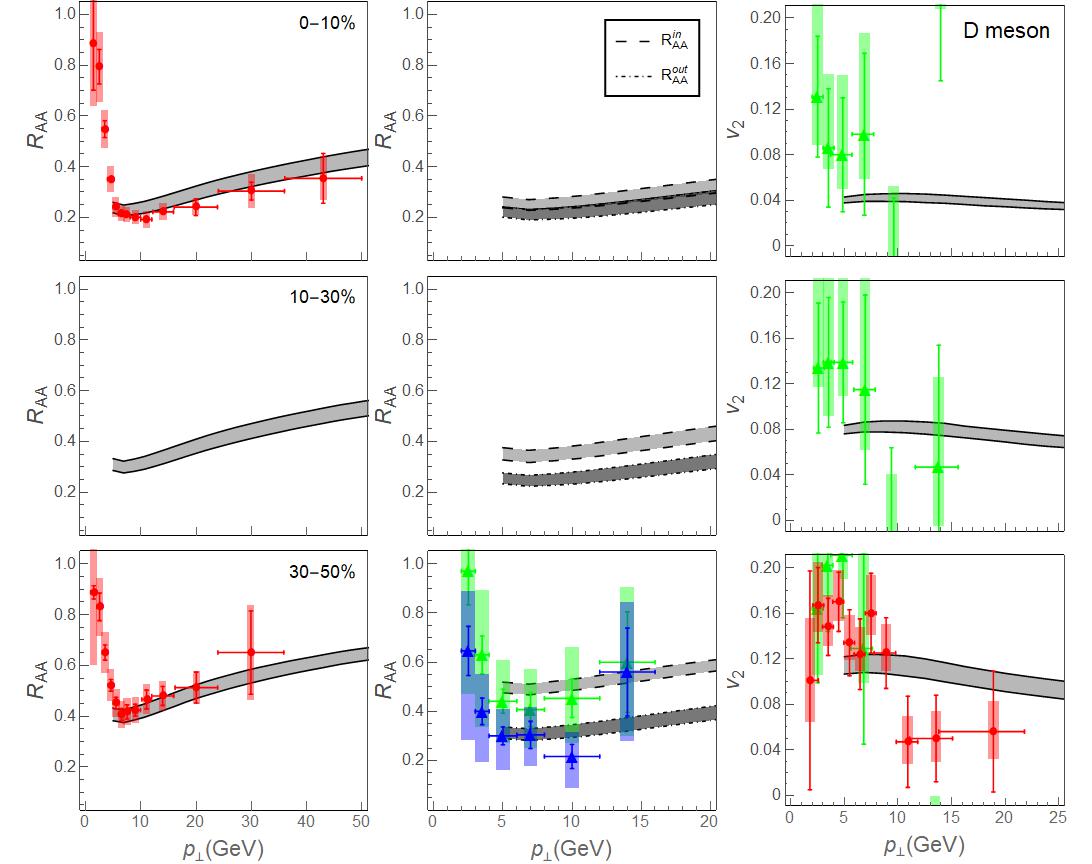
In Figure 3, we provide predictions for D meson average (left panel), in-plane and out-of-plane (middle panel) as well as (right panel) for three different centrality regions. Predictions are compared with available experimental data, where data for both TeV and TeV are shown (since the data for TeV are still scarce, and the data for these two collision energies overlap with eachother MD_5TeV ). For average, in-plane and out-of-plane , we observe good agreement with the data (where available). Agreement with data is also qualitatively good (with predictions again above the experimental data), though we note that the error bars are large.

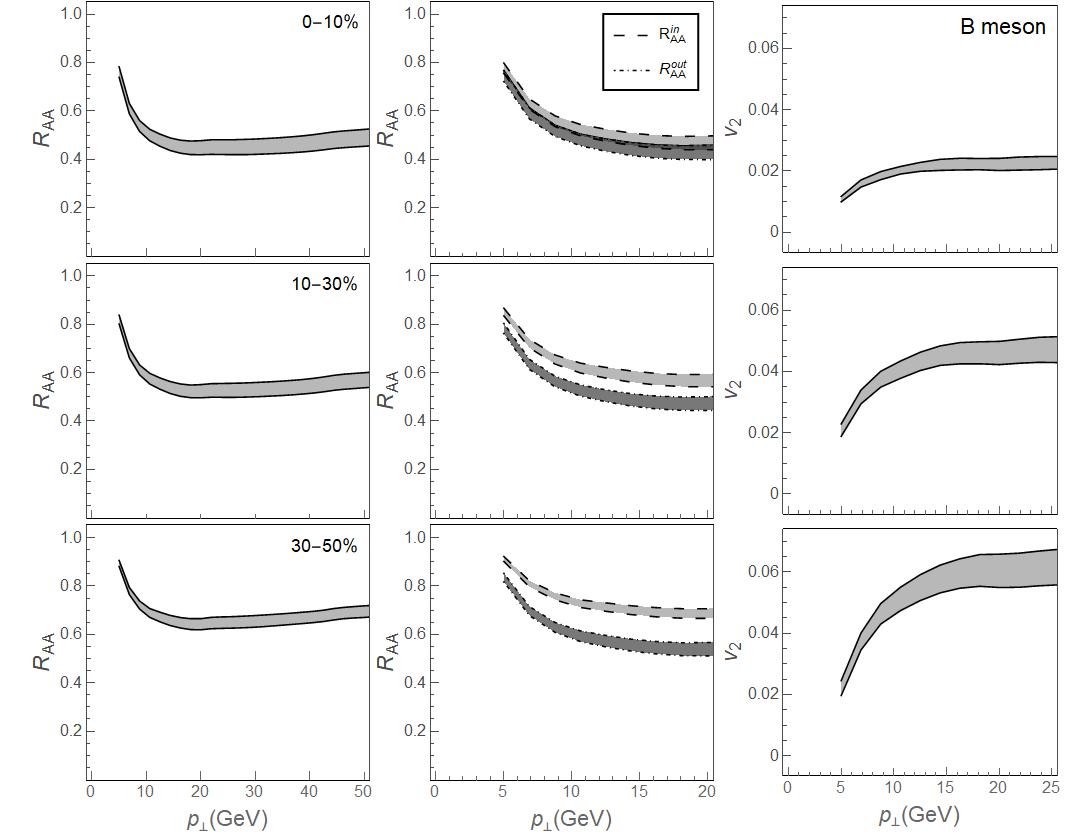
Figure 4 shows equivalent predictions as Figure 3, only for B mesons. While B meson experimental data are yet to become available, we predict which is significantly different from zero for all centrality regions. This does not necessarily mean that heavy B meson flows, as flow is inherently connected with low , and here we show predictions for high . On the other hand, high is connected with the difference in the energy loss (i.e. suppression) for particles going in different (e.g. in-plane and out-of-plane) directions. From the middle panels, we see significant difference between in-plane and out-of-plane , which is a consequence of the difference in the path-lengths shown in Fig. 1. This difference then leads to our predictions of non zero for high B mesons.
Overall, while we see that our predicted s agree well with all measured (light and heavy flavor) data, our predictions are consistently above the experimental data. This observation then leads to the following two questions: i) What is the reason behind the observed overestimation of within DREENA-C framework, and can expanding medium lead to a better agreement with the experimental data? ii) Do we expect that B meson predictions will still be non-zero, once the expanding medium is introduced?
To intuitively approach these questions, note that, within our dynamical energy loss formalism, and , where ( is fractional energy loss, is the average temperature of the medium, while is the average path-length traversed by the jet). To be more precise, note that both dependencies are close to linear, though still significantly different from 1 MD_5TeV ). However, for the purpose of this estimate, let us assume that both and are equal to 1, leading to
| (3) |
where is a proportionality factor.
Another, commonly used estimate GLV_suppress is that
| (4) |
where is the steepness of the initial momentum distribution function.
In DREENA-C approach, T is constant, and the same in in-plane and out-of-plane directions, while and , leading to
| (6) | |||||
and
| (7) | |||||
If the medium evolves, the average temperature along in-plane will be larger than along out-of-plane direction, leading to and . By repeating the above procedure in this case, it is straightforward to obtain
| (8) |
and
| (9) | |||||
Therefore, from the above estimates, we see that should not be very sensitive to the medium evolution, while will be quite sensitive to this evolution, as previously noted elsewhere Molnar ; Thorsten . Moreover, from Eqs. (7) and (9), we see that introduction of temperature evolution is expected to lower compared to constant case. Consequently, accurate energy loss models applied to non-evolving medium should lead to higher than expected, and introduction of evolution in such models would lower the compared to non-evolving case. Based on this, and the fact that previous theoretical approaches were not able to reach high enough without introducing new phenomena CUJET3 , we argue that the dynamical energy loss formalism has the right features needed to accurately describe jet-medium interactions in QGP.
Regarding the second question mentioned above, for B meson to have , it is straightforward to see that one needs . Having in mind that is quite large for larger centralities (see Fig. 1), would also have to be about the same magnitude. We do not expect this to happen, based on our preliminary estimates of the temperature changes in in-plane and out-of-plane in Bjorken expansion scheme. That is, our expectations is that B meson will be smaller than presented here, but still significantly larger than zero, at least for large centrality regions. However, this still remains to be tested in the future with the introduction of full evolution model within our framework.
IV Conclusion
In this paper, we introduced our recently developed DREENA-C framework, which is computational suppression procedure based on our dynamical energy loss formalism in constant finite size QCD medium. The framework is conceptually equivalent to the numerical procedure developed in MD_PLB , and consequently lead to the same numerical results. However, from practical perspective, DREENA-C is computationally fully optimized and more than two orders of magnitude faster than its predecessor.
We here used DREENA-C framework to, for the first time, generate joint and predictions for both light and heavy flavor probes and different centrality regions in collisions at the LHC, and compare them with the available experimental data. Having in mind that DREENA-C does not contain medium evolution, and that is largely sensitive to the QGP evolution, we did not expect that our model would lead to good agreement with the data. However, contrary to these expectations, and to the fact that other approaches faced difficulties in jointly explaining and data, we actually find that DREENA-C leads to good agreement with data and qualitatively good agreement with data (though quantitatively, the predictions overestimate the data). Intuitive explanation behind such results is presented, supporting the validity of our model, with an expectation that introduction of evolution in the DREENA framework will improve the agreement with data. These results therefore further confirm that our dynamical energy loss formalism is a suitable basis for the QGP tomography, which is the main goal for our future research.
Acknowledgments: This work is supported by the European Research Council, grant ERC-2016-COG: 725741, and by and by the Ministry of Science and Technological Development of the Republic of Serbia, under project numbers ON171004 and ON173052.
References
- (1) J. C. Collins and M. J. Perry, Phys. Rev. Lett. 34, 1353 (1975).
- (2) G. Baym and S. A. Chin, Phys. Lett. B 62, 241 (1976).
- (3) M. Gyulassy and L. McLerran, Nucl. Phys. A 750, 30 (2005).
- (4) E. V. Shuryak, Nucl. Phys. A 750, 64 (2005).
- (5) B. Jacak and P. Steinberg, Phys. Today 63, 39 (2010).
- (6) J. D. Bjorken: FERMILAB-PUB-82-059-THY (1982) 287, 292
- (7) M. Djordjevic, M. Gyulassy and S. Wicks, Phys. Rev. Lett. 94, 112301 (2005).
- (8) Yu. L. Dokshitzer and D. Kharzeev, Phys. Lett. B 519, 199 (2001).
- (9) M. Djordjevic, Phys. Rev. C 80, 064909 (2009).
- (10) M. Djordjevic and U. Heinz, Phys. Rev. Lett. 101, 022302 (2008).
- (11) J. I. Kapusta, Finite-Temperature Field Theory (Cambridge University Press, 1989).
- (12) M. Le Bellac, Thermal Field Theory (Cambridge University Press, 1996).
- (13) M. Djordjevic, Phys. Rev. C 74, 064907 (2006).
- (14) M. Djordjevic and M. Djordjevic, Phys. Lett. B 734, 286 (2014).
- (15) B. Blagojevic and M. Djordjevic, J. Phys. G 42, 075105 (2015).
- (16) Z. B. Kang, I. Vitev and H. Xing, Phys. Lett. B 718, 482 (2012), R. Sharma, I. Vitev and B.W. Zhang, Phys. Rev. C 80, 054902 (2009)
- (17) A. Dainese, Eur. Phys. J. C 33, 495 (2004).
- (18) S. Wicks, W. Horowitz, M. Djordjevic and M. Gyulassy, Nucl. Phys. A 784, 426 (2007).
- (19) M. Gyulassy, P. Levai and I. Vitev, Phys. Lett. B 538, 282 (2002).
- (20) D. de Florian, R. Sassot and M. Stratmann, Phys. Rev. D 75, 114010 (2007).
- (21) M. Cacciari, P. Nason, JHEP 0309, 006 (2003), E. Braaten, K.-M. Cheung, S. Fleming and T. C. Yuan, Phys. Rev. D 51, 4819 (1995)
- (22) V. G. Kartvelishvili, A.K. Likhoded, V.A. Petrov, Phys. Lett. B 78, 615 (1978).
- (23) J. Noronha-Hostler, B. Betz, J. Noronha and M. Gyulassy, Phys. Rev. Lett. 116, no. 25, 252301 (2016)
- (24) J. Xu, J. Liao, and M. Gyulassy, Chinese Physics Letters 32 092501 (2015); S. Shi, J. Liao and M. Gyulassy, arXiv:1804.01915 [hep-ph].
- (25) J. D. Bjorken, Physical review D 27, 140 (1983)
- (26) M. Djordjevic, M. Djordjevic and B. Blagojevic, Phys. Lett. B 737, 298 (2014).
- (27) M. Wilde (for the ALICE Collaboration) Nucl. Phys. A 904-905 573c (2013)
- (28) M. Djordjevic and M. Djordjevic, Phys. Rev. C 92, 024918 (2015).
- (29) A. Peshier, hep-ph/0601119 (2006).
- (30) M. Djordjevic and M. Gyulassy, Phys. Rev. C 68, 034914 (2003).
- (31) M. Djordjevic, Phys. Lett. B 709, 229 (2012).
- (32) Yu. Maezawa et al. [WHOT-QCD Collaboration], Phys. Rev. D 81 091501 (2010);
- (33) A. Nakamura, T. Saito and S. Sakai, Phys. Rev. D 69, 014506 (2004).
- (34) A. Hart, M. Laine and O. Philipsen, Nucl. Phys. B 586, 443 (2000).
- (35) D. Bak, A. Karch, L. G. Yaffe, JHEP 0708, 049 (2007).
- (36) M. Djordjevic, Phys. Rev. Lett. 734, 286 (2014).
- (37) M. Djordjevic, B. Blagojevic and L. Zivkovic, Phys. Rev. C , (2016).
- (38) M. Djordjevic, Phys. Lett. B , (2016).
- (39) S. Acharya et al. [ALICE Collaboration], arXiv:1802.09145 [nucl-ex].
- (40) V. Khachatryan et al. [CMS Collaboration], JHEP 1704, 039 (2017).
- (41) A. M. Sirunyan et al. [CMS Collaboration], Phys. Lett. B 776, 195 (2018)
- (42) S. Jaelani [ALICE Collaboration], Int. J. Mod. Phys. Conf. Ser. 46, 1860018 (2018)
- (43) B. B. Abelev et al. [ALICE Collaboration], Phys. Rev. C 90, no. 3, 034904 (2014)
- (44) S. Acharya et al. [ALICE Collaboration], Phys. Rev. Lett. 120, no. 10, 102301 (2018)
- (45) D. Molnar and D. Sun, Nucl. Phys. A 932, 140 (2014); Nucl. Phys. A 910-911, 486 (2013).
- (46) T. Renk, Phys. Rev. C 85, 044903 (2012).