PASA \jyear2024
Discovery of two bright quasars with SkyMapper, Pan-STARRS1 and WISE
Abstract
We present a search for bright quasars using imaging data from SkyMapper Southern Survey, Pan-STARRS1 and the Wide-field Infrared Survey Explorer (WISE). We select two sets of candidates using WISE with optical bands from SkyMapper and alternatively from Pan-STARRS1, limited to a magnitude of . We follow up several candidates with spectroscopy and find that the four candidates common to both lists are quasars, while others turned out to be cool stars. Two of the four quasars, SMSS J013539.27-212628.4 at and SMSS J093032.58-221207.7 at , are new discoveries and ranked among the dozen brightest known QSOs in the -band.
doi:
10.1017/pas.2024.xxxkeywords:
galaxies: active - galaxies:high-redshift - quasars: general1 INTRODUCTION
Quasars were first discovered by Schmidt (1963) and are the most optically luminous variety of active galactic nuclei (AGN). Their central engines are powered by massive accretion of matter onto supermassive black holes (SMBHs). At high redshift, quasars provide a powerful tool to study the formation and growth history of SMBHs (e.g. Mortlock et al., 2011; Wu et al., 2015), probe the progress of cosmic reionisation (e.g. Fan et al., 2006a, b), and constrain the metal enrichment and dust production in the early epoch of the universe (e.g. Jiang et al., 2016). Bright quasars at high redshift are particularly attractive finds; they are powered by the most massive black holes; they are potentially one of the major contributors to reionisation; and they are the brightest beacons, highlighting the chemical evolution of the universe most effectively (Ryan-Weber et al., 2009), so that it can be observed with good signal-to-noise.
Bright quasars at redshifts of are exceedingly rare objects as less than a dozen of them are known with a magnitude of . They are generally faint as the brightest known object has , and they are optically prominent only in the - and -band as intergalactic Hydrogen absorption removes most of their short-wavelength emission. Finding them requires large surveys and so it is no surprise that the first quasars were found in the large-area Sloan Digital Sky Survey (SDSS, Fan et al., 1999, 2001; Schneider et al., 2010). Quasars at are routinely discovered in varieties of wide-field surveys, including the Canada-France High-z Quasar Survey (CFHQS, Willott et al., 2007), the UKIRT Infrared Deep Sky Survey (UKIDSS, Venemans et al., 2007; Yang et al., 2017), the Panoramic Survey Telescope and Rapid Response System (Pan-STARRS, Bañados et al, 2016), the Dark Energy Survey (DES, Reed et al., 2015), and the Dark Energy Camera Legacy Survey (DECaLS, Wang et al., 2017). Nevertheless, bright quasars are difficult to find because of their intrinsic rareness and severe contamination by cool stars with broadly similar colours.
The colour-colour diagram is a widely used method to select quasars (Zheng et al., 2000; Fan et al., 2001; Chiu et al., 2005). Recently, large-area infrared surveys made it possible to select quasar candidates with less contamination from cool stars. McGreer et al. (2013) observed 92 quasar candidates selected by combining the SDSS imaging with addition -band imaging. Seventy-three out of 92 candidates, i.e. 80%, were indeed confirmed to be quasars. Unfortunately, this method is limited to a narrow redshift range (McGreer et al., 2013). Wang et al. (2016) identified 72 new quasars by combining SDSS data with photometry from the Wide-field Infrared Survey Explorer (WISE, Wright et al., 2010).
The SDSS only covers a large portion of the Northern sky, although the Pan-STARRS1 survey (PS1, Kaiser et al., 2002, 2010; Chambers, 2011) has extended coverage of 1.5 hemispheres to a declination of South, but a digital atlas of the full Southern hemisphere has been missing. The SkyMapper Southern Survey aims at plugging that gap, and is a full hemispheric imaging survey carried out by the SkyMapper telescope at Siding Spring Observatory in New South Wales, Australia. The first data release (DR1, Wolf et al., 2018)111http://skymapper.anu.edu.au covers an area of over 20,200 of Southern sky and 285 million objects in the six SkyMapper passbands . This first release includes only data from the SkyMapper Shallow Survey and has -limiting AB magnitudes of in all passbands.
This paper presents our first step in searching for bright high-redshift QSOs in the southern sky and reports the discovery of two new bright quasars at . Throughout the paper, WISE magnitudes are used in the Vega system as is customary, while all optical magnitudes are in the AB system (Oke & Gunn, 1983).
2 QUASAR SELECTION
At , most quasars are very faint in -band, because Lyman limit systems (LLSs), which are optically thick to the continuum radiation from the quasar (Fan et al., 1999), are redshifted into the band. Also, Lyman series absorption systems begin to dominate in the -band and Ly emission moves to the -band, leading to a red colour (Wang et al., 2016). Thus, in previous studies the diagram has often been used to select quasar candidates (Fan et al., 1999; Richards et al., 2002; McGreer et al., 2013).
SkyMapper’s first data release includes only Shallow Survey data and is thus only complete to mag in the -bands. Prior to our work, only ten quasars were known with . While we searched for QSOs with , we realised that the -band in SkyMapper is not quite deep enough to search for very red colours with sufficiently high significance, and as a result we get too many candidates that are expected to be faint cool stars. Hence, we draw on Pan-STARRS1 for deeper - and -band photometry.
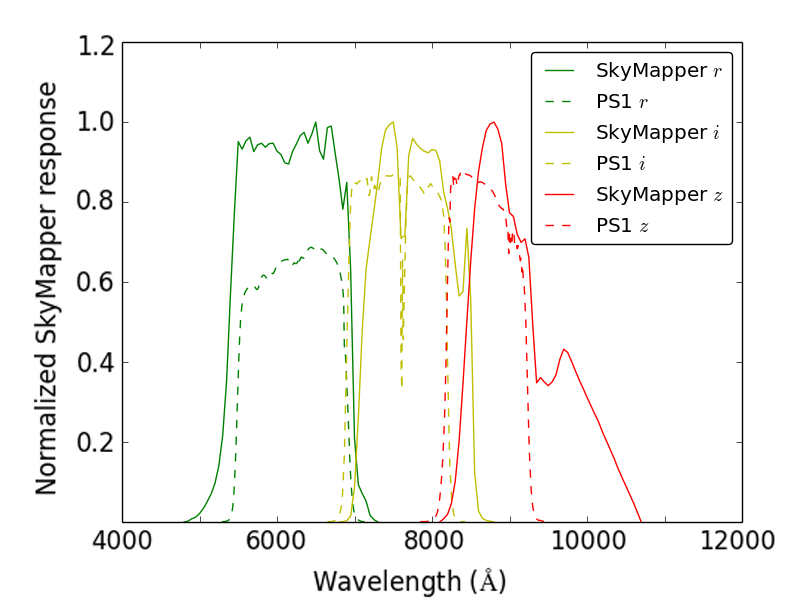
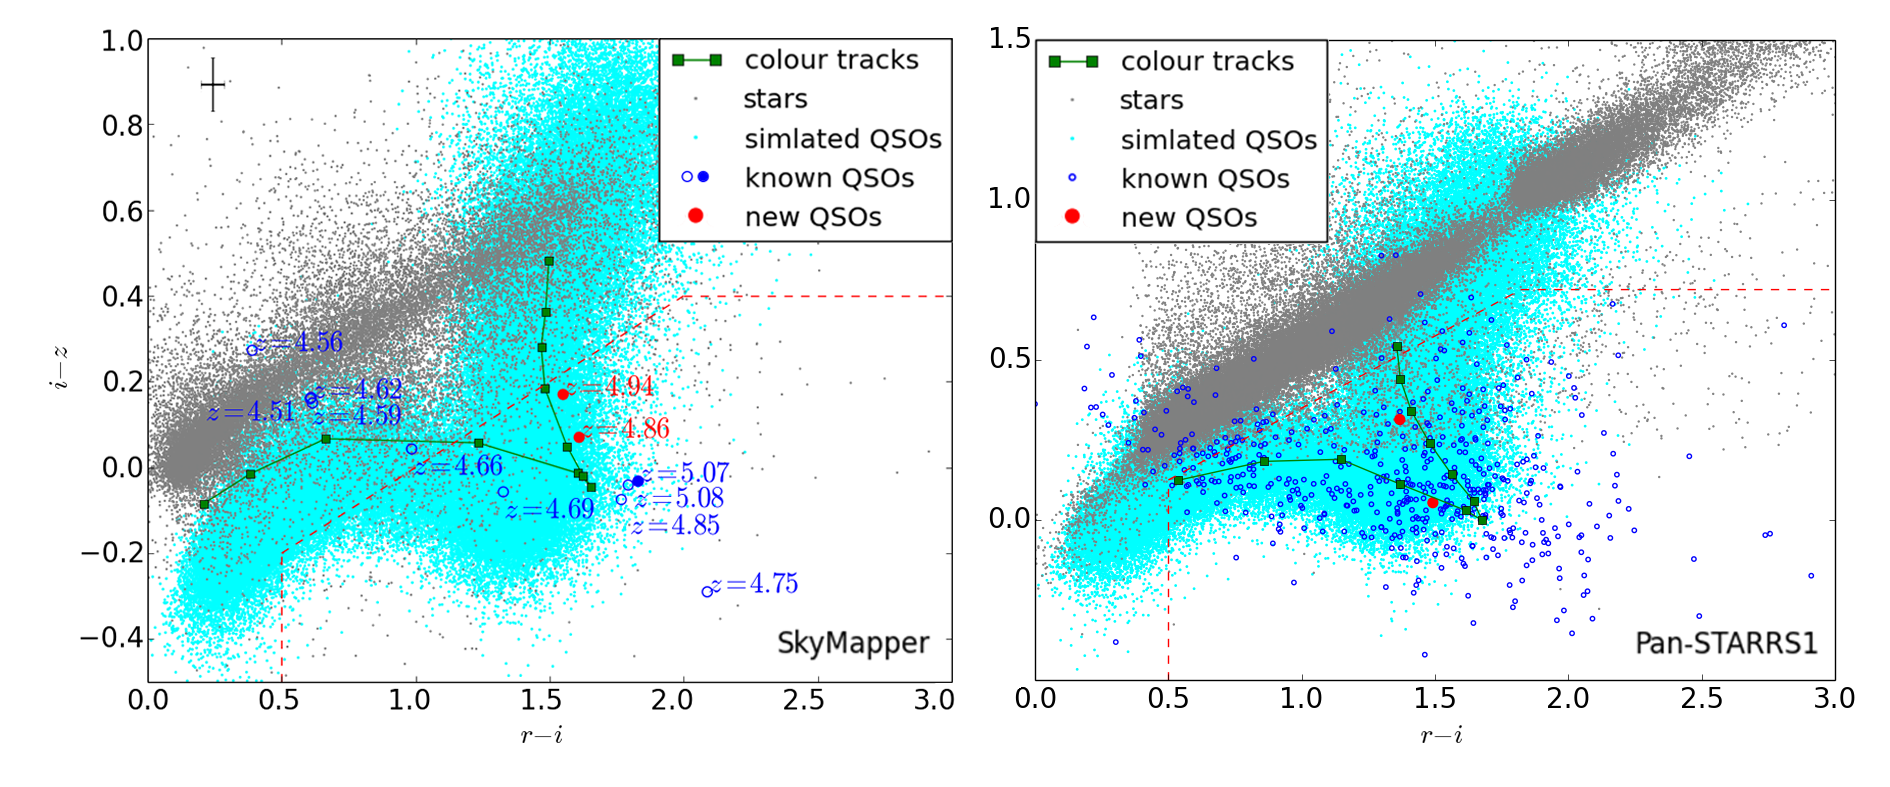
The -passbands in SkyMapper and Pan-STARRS1 are similar in wavelength coverage (see Fig. 1): the -bands are nearly identical, but the - and -bands of SkyMapper reach longer wavelengths than the Pan-STARRS1 cousins; Pan-STARRS1 instead uses an extra -band filter to cover the longest wavelengths in the CCD sensitivity range. The passband differences affect the colours of very cool stars, and in Fig. 2 we show the diagram for both SkyMapper and Pan-STARRS1. Due to the shallow data of the SkyMapper DR1, the photometric errors on the -band drive the colour a little higher than is the case in the PS1 DR1. This shortage will be overcome later in 2018, when the SkyMapper DR2 is released with expected limits beyond 20 mag in all filter bands.
We note the different placement of the stellar locus in the colour-colour diagrams of the two surveys, and adjust selection cuts accordingly to avoid too much stellar contamination. We select candidates in the overlapping part of the sky surveyed by Pan-STARRS1 and SkyMapper twice, once using the SkyMapper /-filters and once using PS1 filters; we find that the two lists have only a modest number of candidates in common. One possible reason could be that Pan-STARRS1 does not observe its filters simultaneously, while SkyMapper does (within a 5-minute window in the Shallow Survey). We speculate that while SkyMapper DR1 has the noisier photometry, Pan-STARRS1 colours might be affected by variability when e.g. M star flares affect the photometry of just one band at the time of observation. However, a detailed analysis of such issues is beyond the scope of this paper.
Infrared photometry has long been considered useful for rejecting cool-star contaminants among high-z quasar candidates (Pentericci et al., 2003; McGreer et al., 2013). However, for a large-area search we would need nearly all-sky -band data such as that provided by the 2 Micron All-Sky Survey (2MASS, Skrutskie et al., 2006). Because of the relative shallowness of the 2MASS -band data, we cannot directly duplicate the method reported by McGreer et al. (2013).
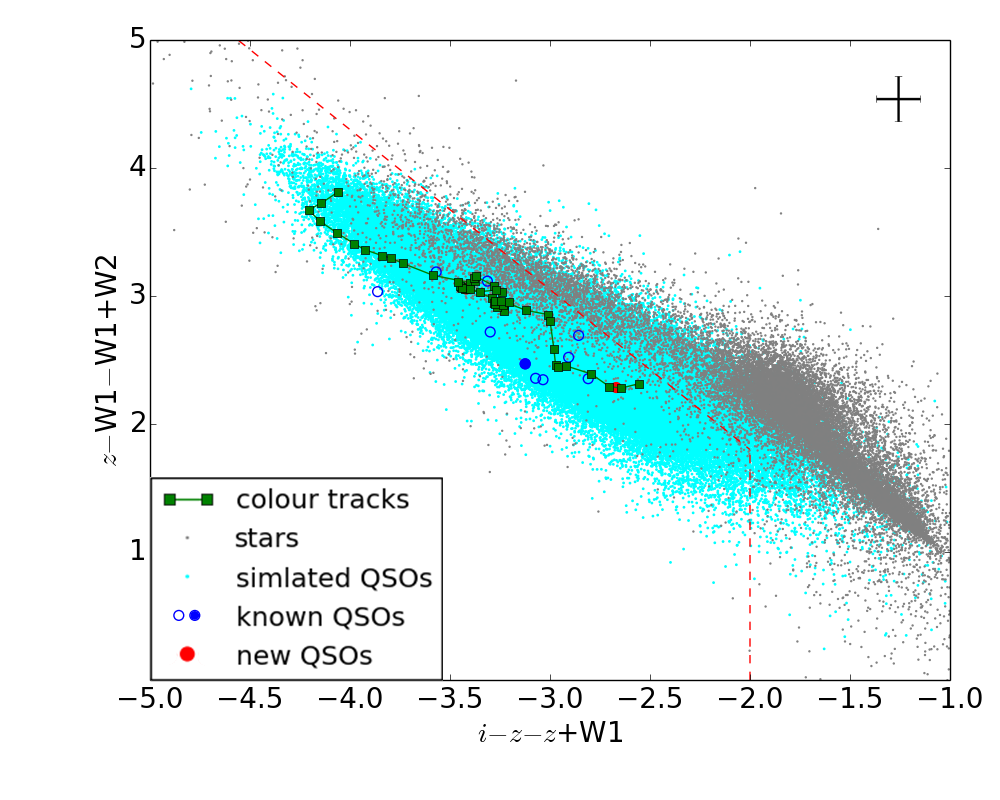
However, we do include mid-infrared (MIR) WISE222We used the WISE ALLWISE catalogue (Cutri et al., 2013). photometry in the selection, but explore an alternative approach to the use of the W1/W1W2 diagram used by Wang et al. (2016) in order to be more complete in the redshift range . Thus, we adopt a new selection to cover a wider redshift range. We combine two colours to measure the curvature in the spectral energy distribution (SED). A star has typically a bump-shaped SED, and hence its colour is redder and its W1 colour is bluer than that of a quasar. As a result a star has a much redder W1 value than a quasar (see Fig. 3). This MIR selection does not discriminate low from high redshifts, but is just intended to separate stars from quasars.
We start by retrieving candidates for the two versions of -filters using the TAP queries shown in the Appendix. In both versions of the query, the criteria are composed of three sections. The first section selects required columns and joins the SkyMapper master table with PS1 and WISE tables using the pre-calculated cross-match in the SkyMapper database. The second part requires that SkyMapper must not detect the object in -bands; reject clearly extended sources (); require galactic latitude ; require an isolated source, where the nearest neighbour in SkyMapper is at least 10 arcsec away; various reliability flags indicate that measurements are clean; and that the source has reliable Pan-STARRS1 magnitudes. The third section contains the colour criteria, which differ between the two survey versions. Notably, a follow-up point-source confirmation for the Pan-STARRS1 version is done by checking iPSFMag-iKronMag<0.05 after being cross-matched with the Pan-STARRS1 StackObject database (Farrow et al., 2014). We listed this part in square brackets, because it has to be separately retrieved via Pan-STARRS1 Casjob333http://mastweb.stsci.edu/ps1casjobs/ instead of in the TAP query.
The SkyMapper query returns 53 candidates. We eyeballed image cutouts of these 53 candidates and removed 3 candidates with suspicious features, while the remaining 50 objects form the SkyMapper quasar candidate list. The Pan-STARRS1 query returns 41 candidates and makes up the Pan-STARRS1 list. For our spectroscopic follow-up we concentrated on the overlap section of the two lists, which contained only four candidates simultaneously selected by the both surveys, two of which are already known QSOs. Afterwards, we followed up some of the remaining candidates from the two lists.
3 SPECTROSCOPIC OBSERVATIONS
For the spectroscopic follow-up observations we used the ANU 2.3m-telescope at Siding Spring Observatory in Australia with the Wide Field Spectrograph (WiFeS, Dopita et al., 2007, 2010) for part of the nights on December 21 to 23, 2017, January 12 to 13, 2018 and April 11 to 13, 2018. For each candidate we obtained one 1800-second exposure with the R3000 grating, which gives a resolution of R=3000 at wavelengths between 5300 Å and 9800 Å. The WiFeS data were reduced using a Python-based pipeline, PyWiFeS (Childress et al., 2014). The flux calibrations of all spectra were conducted from the standard stars observed on the same night.
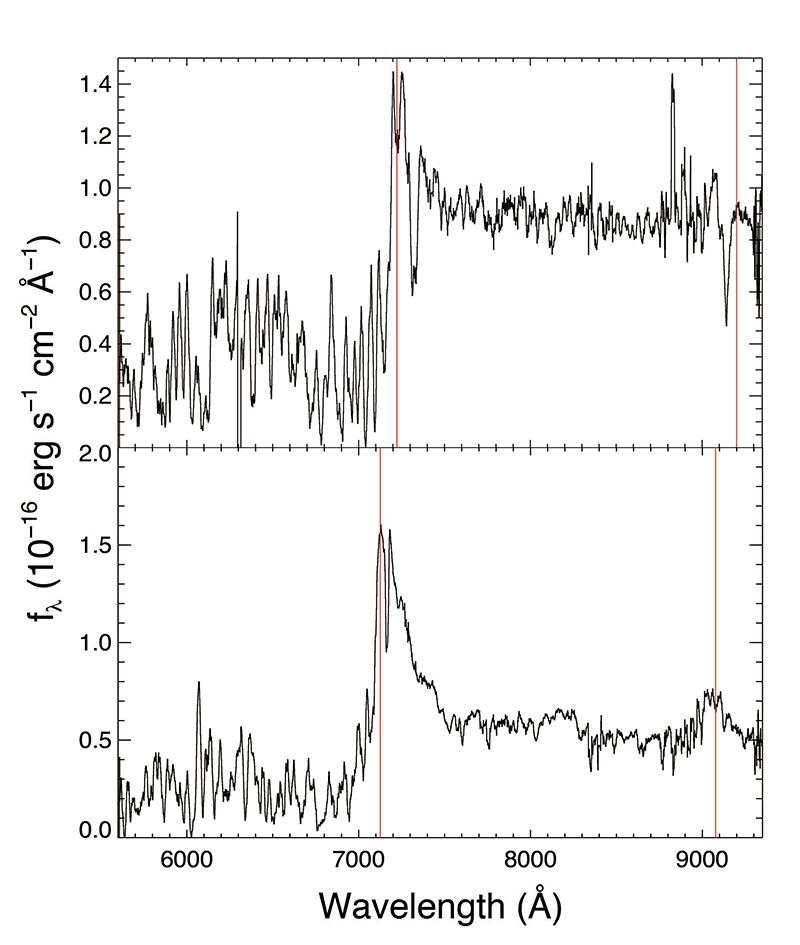
We observed 15 candidates from the two lists and classified 14 of the objects. Two of them are newly identified as bright quasars at and , while one of them was accidentally observed by us and had been identified as a high-z quasar previously (J002526-014532). The remaining objects turn out to be cool stars. As a result all four candidates from the common candidate list are quasars at , and two of these are newly identified in this work, while Wang et al. (2016) already reported J002526-014532 and J211105-015604. The properties of all of our observed candidates are listed in Table 1, including the stars we verified. We do not claim that there are no more quasars to be found in the single-survey candidate lists, but we had no opportunity to follow these up. The spectra of the two newly identified quasars are shown in Fig. 4.
| Object | W1W2 | ||||||
|---|---|---|---|---|---|---|---|
| J013539.27-212628.4 | 4.94 | ||||||
| J093032.58-221207.7 | 4.86 | ||||||
| J002526.82-014532.7 | 5.07 | ||||||
| J084734.65-044343.5 | star | ||||||
| J091437.47-162248.1 | star | ||||||
| J093207.25-003728.3 | star | ||||||
| J095217.30-003712.5 | star | ||||||
| J110023.13-204211.3 | star | ||||||
| J114146.56-261634.7 | star | ||||||
| J135224.06-252815.7 | star | ||||||
| J150144.61-115936.6 | star | ||||||
| J210326.83-261132.5 | star | ||||||
| J093429.75-052420.7 | star | ||||||
| J112908.13-300227.2 | star |
4 DISCUSSION AND OUTLOOK
This paper presents the first step in searching for high-redshift quasars with the SkyMapper Southern Survey. We first aimed for purity rather than completeness, and select candidate lists with relatively low contamination by cool stars. We thus employ the help of the deeper Pan-STARRS1 -bands; however, the SkyMapper DR2 planned for August 2018 will provide deep photometry in all bands across the Southern declination range, although full coverage of the sky at full depth will only be achieved when the observations are completed in 2020.
We use a rather strict criterion of , even though a few quasars are known to have in Pan-STARRS1 (e.g. Storrie-Lombardi et al., 2001; Pâris et al., 2017). All known quasars are fainter than , and loosening the -band limit rapidly increases the contamination by stars. Both of our newly discovered quasars are fainter than . We also chose to use the WISE measurements of w1mag instead of w1mpro because contamination increases with w1mpro, and we selected the candidates to be isolated point sources.
Our two newly discovered quasars, SMSS J013539.27-212628.4 and SMSS J093032.58-221207.7, are bright, with mag in the SkyMapper -band; they are now two of the dozen brightest known quasars.
We note that one of our newly discovered quasars, SMSS J093032-221208, is outside of the selection box proposed by Wang et al. (2016), which misses a fraction of quasars that are blue in W1W2 colour. Here, our MIR colour criteria that are sensitive to SED curvature are helpful as they include a wide redshift range, while the high-z selection is achieved by the optical broadband criteria. However, the star and quasar distributions are more blended than the previous criteria in McGreer et al. (2013) and Wang et al. (2016). Thus, we adopted a strict selection box in the optical colours (Fig. 2) and a lenient one in the z-MIR colour (Fig. 3).
The current selection boxes are aimed at high purity and use very strict optical cuts. Loosening the optical criteria will increase star contamination faster than it increases completeness of the quasar population. This process will, however, become realistic now that proper motions for faint objects are available from Data Release 2 of Gaia (Gaia Collaboration et al., 2016, 2018). After finishing this work, Gaia DR2 became available and delivered proper motion data for virtualy all celestial objects to the depth of the candidates considered here. We found that all stars we identified had -significant proper motions, in excess of 1 milli-arcsec per year, while the true quasars at and have no significant proper motion. Gaia will not provide a route to a contamination-free selection of quasars, but will certainly reduce the contamination by a factor of .
Acknowledgements.
This research was conducted by the Australian Research Council Centre of Excellence for All-sky Astrophysics (CAASTRO), through project number CE110001020. ZL acknowledges financial support for a pre-PhD project at the ANU node of CAASTRO. ZL also thanks Yunyin Huang at Sun Yat-Sen University and Zhenzi He at Peking University for support on network access for TAP queries from China. The national facility capability for SkyMapper has been funded through ARC LIEF grant LE130100104 from the Australian Research Council, awarded to the University of Sydney, the Australian National University, Swinburne University of Technology, the University of Queensland, the University of Western Australia, the University of Melbourne, Curtin University of Technology, Monash University and the Australian Astronomical Observatory. SkyMapper is owned and operated by The Australian National University’s Research School of Astronomy and Astrophysics. The survey data were processed and provided by the SkyMapper Team at ANU. The SkyMapper node of the All-Sky Virtual Observatory (ASVO) is hosted at the National Computational Infrastructure (NCI). Development and support the SkyMapper node of the ASVO has been funded in part by Astronomy Australia Limited (AAL) and the Australian Government through the Commonwealth’s Education Investment Fund (EIF) and National Collaborative Research Infrastructure Strategy (NCRIS), particularly the National eResearch Collaboration Tools and Resources (NeCTAR) and the Australian National Data Service Projects (ANDS). This work uses data products from the Wide-field Infrared Survey Explorer, which is a joint project of the University of California, Los Angeles, and the Jet Propulsion Laboratory/California Institute of Technology, funded by the National Aeronautics and Space Administration. AllWISE makes use of data from WISE, which is a joint project of the University of California, Los Angeles, and the Jet Propulsion Laboratory/California Institute of Technology, and NEOWISE, which is a project of the Jet Propulsion Laboratory/California Institute of Technology. WISE and NEOWISE are funded by the National Aeronautics and Space Administration. This work has made use of data from the European Space Agency (ESA) mission Gaia (https://www.cosmos.esa.int/gaia), processed by the Gaia Data Processing and Analysis Consortium (DPAC, https://www.cosmos.esa.int/web/gaia/dpac/consortium). Funding for the DPAC has been provided by national institutions, in particular the institutions participating in the Gaia Multilateral Agreement.Appendix A Queries for candidate lists
We selected candidates from the SkyMapper online database with the following ADQL Queries; the common section of both versions is:
SELECT m.*, w1mag, w1sigm, w2mag,
  w2sigm, cc_flags, var_flg, ngrp,
  best_use_cntr, allwise.ph_qual, gmeanpsfmag,
  gmeanpsfmagerr, rmeanpsfmag, rmeanpsfmagerr,
  imeanpsfmag, imeanpsfmagerr, zmeanpsfmag,
  zmeanpsfmagerr from dr1.master m
join ext.allwise on (allwise_cntr=cntr)
join ext.ps1_dr1 on (ps1_dr1_id=objid)

WHERE u_psf is null and v_psf is null
and g_psf is null and r_psf is null
and i_psf between 16 and 18.2
and z_psf-z_petro<0.35
and abs(i_psf-imeanpsfmag)<0.4
and abs(m.glat)>20 and m.prox>10
and allwise_dist<2 and nb=1 and flags<4
and nimaflags=0 and nch_max=1
and ebmv_sfd<0.1 and ext_flg = 0
and gmeanpsfmagerr>0 and rmeanpsfmagerr>0
and imeanpsfmagerr>0 and zmeanpsfmagerr>0
Query addition for the SkyMapper version:
AND ((gmeanpsfmag<0 or gmeanpsfmag>21.0))
and (rmeanpsfmag-i_psf>0.50)
and i_psf-z_psf
  <0.40*(rmeanpsfmag-i_psf)-0.40
and (i_psf-z_psf<0.40)
and (z_psf-w1mag-w1mag+w2mag)
  <-1.25*(i_psf-z_psf-z_psf+w1mag)-0.70
and (i_psf-z_psf-z_psf+w1mag)<-2.00
Query addition for the Pan-STARRS1 version:
AND ((gmeanpsfmag<0 or gmeanpsfmag>21.0))
and (rmeanpsfmag-imeanpsfmag>0.50)
and (imeanpsfmag-zmeanpsfmag<
 0.45*(rmeanpsfmag-imeanpsfmag)-0.10)
and (imeanpsfmag-zmeanpsfmag<0.72)
[and iPSFMag-iKronMag<0.05]
References
- Bañados et al (2016) Bañados, E., Venemans, B. P., Decarli, R., et al. 2016, ApJS, 227, 11
- Chambers (2011) Chambers, K. C. 2011, BAAS, 43, 217
- Childress et al. (2014) Childress, M. J., Vogt, F. P. A., Nielsen, J., & Sharp, R. G. 2014, Ap&SS, 349, 617
- Chiu et al. (2005) Chiu, K., Zheng, W., Schneider, D. P., et al. 2005, AJ, 130, 13
- Croom et al. (2004) Croom, S. M., Smith, R. J., Boyle, B. J., et al. 2004, MNRAS, 349, 1397
- Cutri et al. (2013) Cutri, R. M., Wright, E. L., Conrow, T., et al. 2013, wise.rept, 1
- Dawson et al. (2013) Dawson, K. S., Schlegel, D. J., Ahn, C. P., et al. 2013, AJ, 145, 10
- Dopita et al. (2007) Dopita, M., Hart, J., McGregor, P., et al. 2007, Ap&SS, 310, 255
- Dopita et al. (2010) Dopita, M., Rhee, J., Farage, C., et al. 2010, Ap&SS, 327, 245
- Fan et al. (1999) Fan, X., Strauss, M. A., Schneider, D. P., et al. 1999, AJ, 118, 1
- Fan et al. (2001) Fan, X., Strauss, M. A., Richards, G. T., et al. 2001, AJ, 121, 31
- Fan et al. (2006a) Fan, X., Carilli, C. L., & Keating, B. 2006a, ARA&A, 44, 415
- Fan et al. (2006b) Fan, X., Strauss, M. A., Richards, G. T., et al. 2006b, AJ, 131, 1203
- Farrow et al. (2014) Farrow, D. J., Cole, S., Metcalfe, N., et al. 2014, MNRAS, 437, 748
- Gaia Collaboration et al. (2016) Gaia Collaboration, Prusti, T., de Bruijne, J. H. J., et al. 2016, A&A, 595, A1
- Gaia Collaboration et al. (2018) Gaia Collaboration, Brown, A. G. A., Vallenari, A., et al. 2018, arXiv:1804.09365
- Jiang et al. (2016) Jiang, L., McGreer, I. D., Fan, X., et al. 2016, ApJ, 833, 222
- Kaiser et al. (2002) Kaiser, N., Aussel, H., Burke, B. E., et al. 2002, Proc. SPIE, 4836, 154
- Kaiser et al. (2010) Kaiser, N., Burgett, W., Chambers, K., et al. 2010, Proc. SPIE, 7733, 77330E
- Lawrence et al. (2007) Lawrence, A., Warren, S. J., Almaini, O., et al. 2007, MNRAS, 379, 1599
- McGreer et al. (2013) McGreer, I. D., Jiang, L., Fan, X., et al. 2013, ApJ, 768, 105
- Morganson et al. (2014) Morganson, E., Burgett, W. S., Chambers, K. C. et al. 2014 ApJ, 784, 92
- Mortlock et al. (2011) Mortlock, D. J., Warren, S. J., Venemans, B. P. 2011, Nature, 474, 616
- Oke & Gunn (1983) Oke, J. B. & Gunn, J. E. 1983, ApJ, 266, 713
- Pâris et al. (2017) Pâris, I., Petitjean, P., Ross, N. P., et al. 2017, A&A, 597, 79
- Pentericci et al. (2003) Pentericci, L., Rix, H.-W., Prada, F., et al. 2003, A&A, 410, 75
- Reed et al. (2015) Reed, S. L., McMahon, R. G., Banerji, M., et al. 2015, MNRAS, 454, 3952
- Richards et al. (2002) Richards, G. T., Fan, X., Newberg, H. J., et al. 2002, AJ, 123, 2945
- Ryan-Weber et al. (2009) Ryan-Weber, E. V., Pettini, M., Madau, P., et al. 2009, MNRAS, 395, 1476
- Schmidt (1963) Schmidt, M. 1963, Nature, 197, 1040
- Schneider et al. (2010) Schneider, D. P., Richards, G. T., Hall, P. B., et al. 2010, AJ, 139, 2360
- Skrutskie et al. (2006) Skrutskie, M. F., Cutri, R. M., Stiening, R., Weinberg, M. D., et al. 2006, AJ, 131, 1163
- Storrie-Lombardi et al. (2001) Storrie-Lombardi, L. J., Irwin, M. J., McMahon, R. G. et al. 2001, MNRAS, 322, 933
- Vanden Berk et al. (2001) Vanden Berk, D. E., Richards, G. T., Bauer, A., et al. 2001, AJ, 122, 549
- Venemans et al. (2007) Venemans, B. P., McMahon, R. G., Warren, S. J., et al. 2007, MNRAS, 376, L76
- Wang et al. (2016) Wang, F., Wu, X.-B., Fan, X., et al. 2016, ApJ, 819, 24
- Wang et al. (2017) Wang, F., Fan, X., Yang, J., et al. 2017, ApJ, 839, 27
- Willott et al. (2007) Willott, C. J., Delorme, P., Omont, A., et al. 2007, ApJ, 134, 2435
- Wolf et al. (2018) Wolf, C., Onken, C. A., Luvaul, L. C., et al. 2018, PASA, 35, 10 (doi: 10.4225/41/593620ad5b574)
- Wright et al. (2010) Wright, E. L., Eisenhardt, P. R. M., Mainzer, A. K., et al. 2010, AJ, 140, 1868
- Wu et al. (2015) Wu, X.-B., Wang, F., Fan, X., et al. 2015, Nature, 518, 512
- Yang et al. (2017) Yang, J., Fan, X., Wu, X.-B., et al. 2017, AJ, 153, 184
- Zheng et al. (2000) Zheng, W., Tsvetanov, Z. I., Schneider, D. P., et al. 2000, AJ, 120, 1607