On the Gaia DR2 distances for Galactic Luminous Blue Variables
Abstract
We examine parallaxes and distances for Galactic luminous blue variables (LBVs) in the Gaia second data release (DR2). The sample includes 11 LBVs and 14 LBV candidates. For about half of the sample, DR2 distances are either similar to commonly adopted literature values, or the DR2 values have large uncertainties. For the rest, reliable DR2 distances differ significantly from values in the literature, and in most cases the Gaia DR2 distance is smaller. Two key results are that the S Doradus instability strip may not be as clearly defined as previously thought, and that there exists a population of LBVs at relatively low luminosities. LBVs seem to occupy a wide swath from the end of the main sequence at the blue edge to 8000 K at the red side, with a spread in luminosity reaching as low as log(/)4.5. The lower-luminosity group corresponds to effective single-star initial masses of 10-25 , and includes objects that have been considered as confirmed LBVs. We discuss implications for LBVs including (1) their instability and origin in binary evolution, (2) connections to some supernova (SN) impostors such as the class of SN 2008S-like objects, and (3) LBVs that may be progenitors of SNe with dense circumstellar material across a wide initial mass range. Although some of the Gaia DR2 distances for LBVs have large uncertainty, this represents the most direct and consistent set of Galactic LBV distance estimates available in the literature.
keywords:
binaries: general — stars: evolution — stars: massive — stars: winds, outflows1 INTRODUCTION
Luminous blue variables (LBVs) are the brightest blue irregular variable stars in any large star-forming galaxy. They can achieve the highest mass-loss rates of any known types of stars, and they exhibit a wide diversity of irregular and eruptive variability (Conti, 1984; Humphreys & Davidson, 1994; van Genderen, 2001; Clark et al., 2005a; Smith et al., 2004; Smith & Owocki, 2006; Smith et al., 2011; Smith, 2014; Van Dyk & Matheson, 2012). Yet despite decades of study, the physical mechanism that causes their variability remains unknown. An important corollary is that there are stars that occupy the same parts of the Hertzsprung-Russell (HR) diagram that are not (currently) susceptible to the same instability. The degree to which a star in this region of the HR diagram is unstable may depend on its initial mass, its age, its history of mass loss (and hence, its metallicity), and past binary interaction.
For any class of stars, distances and true bolometric luminosities are important for understanding their physical nature. This is particularly true for LBVs, since their defining instability, mass loss, and evolutionary state are thought to be a consequence of their high luminosity (Conti, 1984; Humphreys & Davidson, 1994; Lamers & Fitzpatrick, 1988; Ulmer & Fitzpatrick, 1998; Owocki et al., 2004). Precise distances are critical for inferring whether a star is in close proximity to the classical Eddington limit based on its position on the HR diagram compared to stellar evolution model tracks. Many LBVs seem to skirt the observed upper luminosity boundary on the HR diagram, the Humphreys-Davidson (HD) limit, oscillating between their hot quiescent states and cooler eruptive states when they cross that observational limit (Humphreys & Davidson, 1994). Based on distances, luminosities, and temperatures estimated for a few LBVs in the Milky Way and nearby galaxies, Wolf (1989) proposed that LBVs in their hot states reside along the S Doradus instability strip on the HR Diagram. This zone in the HR Diagram is thought to be an important clue to their instability, perhaps related to the Eddington limit modified by opacity (Lamers & Fitzpatrick, 1988; Ulmer & Fitzpatrick, 1998) and rotation (Groh et al., 2009b; Langer et al., 1999).
Extragalactic LBVs in the Large or Small Magellanic Clouds (LMC/SMC) and in the nearby spirals M31/M33 have reliable distance estimates, and hence, fairly reliable estimates of their bolometric luminosity if detailed quantitative analysis has been used to estimate their bolometric corrections. In distant environments, however, we may be missing faint LBVs, if they exist, either due to selection effects (low amplitude variability, for example) or because they have not received as much observational attention as the most luminous stars. Noticing that a star is actually an LBV is often the result of detailed analysis and long-term monitoring; a typical S Doradus cycle of an LBV may last a decade. Moreover, difficulties associated with contaminating light from neighboring stars become more problematic for extragalactic LBVs.
Distances to LBVs cannot be determined solely by detailed spectroscopic analysis of an individual star, because the relationship between the spectrum and absolute luminosity is ambiguous (Najarro et al., 1997; Hiller et al., 1998; Groh et al., 2009a). The problem is that the emission-line spectra of LBVs can be dominated by wind emission, which depends on density and ionization of the outflow, not the absolute luminosity of the star or its surface gravity. Stars with dense winds can have very similar spectra across a wide range of luminosity. For instance, Groh et al. (2013) have shown that spectral models of an evolved 20-25 star that is moving blueward after experiencing high mass loss in the RSG phase can have a spectrum that closely resembles a vastly more luminous classical LBV like AG Car. As such, other types of evolved stars at lower mass that have effective temperatures similar to LBVs and dense winds or disks like a B[e] star, post-AGB star, or various types of interacting binaries can have similar emission-line spectra that may masquerade as LBVs. These can be mistaken for more luminous LBVs if assumed to be at a distance that is too far, and vice versa. We will see below that this is indeed the case for a few objects that have been considered LBVs or LBV candidates (a candidate, referred to as cLBV here, is a supergiant star that resembles an LBV spectroscopically or has a shell nebula, but has not yet been seen to exhibit the tell-tale variability of either S Doradus cycles or a giant eruption). In addition to the luminosity, other stellar parameters derived from spectroscopic analysis also depend on the assumed distance . The stellar radius depends on (relevant for e.g. binary interaction), and mass-loss rates scale as . This influences our interpretation of the mass-loss history, fate, circumstellar material properties in interacting supernovae (SNe), etc. Other properties like the effective temperature and the terminal wind speed have a negligible dependence on the distance (see Groh et al. 2009a).
Of course, star clusters have been a useful tool for estimating distances and ages for many classes of stars. A significant impediment to determining LBV distances by this method, however, is that many LBVs are not associated with clusters, counter to expectations for the origin of LBVs in single-star evolution (e.g., Lamers & Nugis 2002). Smith & Tombleson (2015) showed that LBVs are isolated from clusters of O-type stars in general, whereas the few that are in clusters seem to be too young (or overluminous) for their environment. Aghakhanloo et al. (2017) showed that a passive cluster dispersal model can reproduce the observed statistical spatial distribution of O-type stars on the sky, but cannot explain LBVs if they are the descendants of those O-type stars as expected in single-star evolutionary models. This may indicate instead that LBVs are massive blue stragglers and that their apparent isolation arises either because they received a kick when their companion star exploded, or because they have been rejuvenated by mass accretion or mergers in binary evolution (Kenyon & Gallagher, 1985; Gallagher, 1989; Smith & Tombleson, 2015; Smith, 2016; Aghakhanloo et al., 2017). This might make their surrounding stellar populations look much older than we would naively expect from an LBV’s position on the HR Diagram. If LBVs really are the product of binary interaction, this has important implications for the origin of their instability. Stars that have arrived at the same point on the HR diagram through different evolutionary trajectories (single star, mass donor, mass gainer, merger) might help explain why some stars in this part of the HR diagram suffer from eruptive instability and some do not. Indeed, Justham et al. (2014) have discussed the hypothesis that LBVs result from stellar mergers for theoretical reasons unrelated to their environments — in particular, that they might be viable SN progenitors.
These inferences about age and environments of LBVs were based on stars in the LMC, where the distance is reliable. Such environmental comparisons are harder in the Milky Way because of distance ambiguities and extinction. For this reason, Smith & Tombleson (2015) did not undertake a quantitative assessment of LBV isolation for Milky Way LBVs (although they did note anecdotal evidence that Galactic LBVs do appear remarkably isolated as well). A Milky Way star seen near other O-type stars on the sky might be at a different distance but seen nearby in projection, or alternatively, a lack of O stars in the vicinity might be a selection effect (LBVs are very bright at visual wavelengths, but hotter and visually fainter main-sequence O-type stars might be dim and possibly undetected because of extinction in the Galactic plane). These complications make it difficult to know if the statistical environments of LBVs in the LMC also apply in the Milky Way, where the metallicity sensitivity of the LBV instability might differ. Similarly, the lack of reliable distances for Milky Way LBVs has hampered our understanding of their true physical parameters, especially their bolometric luminosities. Since most LBVs are not associated with young clusters of O-type stars, many of them have very uncertain distances in the literature (see Section 2.2), and similarly, highly uncertain ages and initial masses.
Of the dozen or so LBVs in the Milky Way (Clark et al., 2005a), only a few are seen to be associated with massive young clusters or associations. One is Car, arguably the most massive and luminous star in the Milky Way. The others are FMM 362 and the Pistol Star, both apparently associated with the Quintuplet Cluster in the Galactic Center and visually obscured (and therefore not relevant to the statistical assessments of LBV isolation, since we do not have a meaningful sample of visually obscured LBVs in the field). The other is W243 in the massive young cluster Westerlund 1 (Wd1). (Wra 751 is seen amid a cluster too, but not a massive young cluster.) Here we compile the distances for unobscured Galactic LBVs that have measured parallax values included in the Gaia second data release (DR2), and we comment on the revised HR diagram for LBVs.
| Baseline Distance | Original Studies | ||||
| Name | (kpc) | Ref.111N12: Naze et al. (2012); G12: Gvaramadze et al. (2012); K16: Kniazev et al. (2016); S7: Smith (2007). | (kpc) | Ref. | Technique |
| HR Car | 5.20 | N12 | 5.40.4 | Hutsemekers & van Drom (1991) | Kinematics |
| 51 | van Genderen et al. (1991) | Reddening-Distance Relationship | |||
| AG Car | 6.00 | N12 | 5 | Humphreys et al. (1989) | Reddening-Distance Relationship |
| 6.46.9 | Humphreys et al. (1989) | Kinematics | |||
| 61 | Hoekzema et al. (1992) | Reddening-Distance Relationship | |||
| Wra 751 | 6.00 | N12 | 6 | Pasquali et al. (2006) | Kinematics (private communication) |
| 5 | Hu et al. (1990) | Reddening-Distance Relationship | |||
| 45 | van Genderen et al. (1992) | Reddening-Distance Relationship | |||
| Wd1 W243 | 5.00 | N12 | 5 | Clark et al. (2005b) | Cluster Membership - YHG Luminosity |
| 2 | Clark et al. (2005b) | Cluster Membership - WR Stars | |||
| 5 | Crowther et al. (2006b) | Cluster Membership - WR Stars | |||
| 3.550.17 | Brandner et al. (2008) | Cluster Membership - MS Fitting | |||
| HD 160529 | 2.50 | N12 | 2.5 | Sterken et al. (1991) | Comparison with R110 |
| HD 168607 | 2.20 | N12 | DM11.86 | Humphreys (1978) | Cluster Membership - MS fitting |
| 2.20.2 | Chini et al. (1980) | Cluster Membership - MS Fitting | |||
| P Cyg | 1.70 | N12 | 1.70.1 | Najarro et al. (1997) | Spectral Modeling |
| MWC 930 | 3.50 | N12 | 34 | Miroshnichenko et al. (2005) | Associated with the Norma Spiral Arm |
| Kinematics, Extinction arguments | |||||
| G24.73+0.69 | 5.20 | N12 | 5.2 | Clark et al. (2003) | Reddening-Distance Relationship |
| WS 1 | 11.0 | G12 | 11 | Gvaramadze et al. (2012) | Assume Luminosity |
| MN48 | 5.00 | K16 | 35 | Kniazev et al. (2016) | Assume association with spiral arm |
| Luminosity, Kinematics arguments | |||||
| (HD80077) | 3.00 | N12 | 2.80.4 | Steemers & van Genderen (1986) | Cluster Membership - MS Fitting |
| 3.2 | Moffat & Fitzgerald (1977) | Cluster Membership - MS Fitting | |||
| (SBW1) | 7.00 | S7 | 7 | Smith et al. (2007) | Luminosity Class, Kinematics Arguments |
| (Hen 3-519) | 8.00 | N12 | 6 (8) | Davidson et al. (1993) | Reddening-Distance Relationship |
| (Sher 25) | 6.30 | N12 | 6.30.6 | Pandey et al. (2000) | Cluster Membership - MS fitting |
| 6.10.6 | de Pree et al. (1999) | Kinematics | |||
| (Sco) | 2.00 | N12 | 2.00.2 | Baume et al. (1999) | Cluster Membership - MS fitting |
| (HD 326823) | 2.00 | N12 | 2 | McGregor et al. (1988) | Location in direction of galactic center |
| 1.98 | Kozok (1985) | Luminosity Class, Color-Luminosity Relation | |||
| (WRAY 17-96) | 4.50 | N12 | 4.9 | Egan et al. (2002) | Reddening-Distance Relationship |
| (HD 316285) | 1.90 | N12 | 2 | Hiller et al. (1998) | Assumed, Reddening Arguments |
| 3.4 | van der Veen et al. (1994) | Assumed, Reddening Arguments | |||
| (HD 168625) | 2.20 | N12 | DM11.86 | Humphreys (1978) | Cluster Membership - MS fitting |
| 2.20.2 | Chini et al. (1980) | Cluster Membership - MS Fitting | |||
| (AS 314) | 8.00 | N12 | 10 | Miroshnichenko et al. (2000) | Assume Luminosity |
| (MWC 314) | 3.00 | N12 | 3.00.2 | Miroshnichenko et al. (1998) | Kinematics |
| (W51 LS1) | 6.00 | N12 | 8.5 2.5 | Schneps et al. (1981) | maser proper motion - membership |
| 6.11.3 | Imai et al. (2002) | maser proper motion - membership | |||
| 5.5 | Russeil (2003) | kinematics | |||
| 5.8 | Barbosa et al. (2008) | Radio Luminosity/Lyman Continuum Photons | |||
| 2.00.3 | Figuerêdo et al. (2008) | spectroscopic parallax | |||
| 5.1 | Xu et al. (2009) | trigonometric parallax + maser proper motion | |||
| 5.41 | Sato et al. (2010) | trigonometric parallax + maser proper motion | |||
| (G79.29+0.46) | 2.00 | N12 | 15, assume 2 | Higgs et al. (1994) | Reddening-Distance, Kinematics |
| 14, assume 2 | Voors et al. (2000) | Reddening-Distance, Kinematics | |||
| (CYG OB2 12) | 1.70 | N12 | 1.70.2 | Torres-Dodgen et al. (1991) | Cluster Membership - MS fitting |
| DM=11.40.1 | Massey & Thompson (1991) | Cluster Membership - MS Fitting | |||
| Name | Gaia DR2 id | (mas) | (mas) | RUWE | (mas) | (kpc) | (kpc) | 222The following are from the Gaia DR2 catalog: is the parallax, is the expected uncertainty in the parallax, is the number of visibility periods, RUWE is the re-normalized goodness of fit (), is the excess astrometric noise, is the significance of the excess astrometric noise. The following are from the Bailer-Jones catalog: is the length scale of field stars in the direction of the LBV or candidate, is the most likely Bailer-Jones distance, and give the highest 68% density interval (HDI). | |||
| HR Car | 5255045082580350080 | 0.171 | 0.033 | 18 | 1.04 | 0.000 | 0.0 | 1.66 | 4.89 | 4.20 | 5.82 |
| AG Car | 5338220285385672064 | 0.153 | 0.029 | 17 | 0.88 | 0.000 | 0.0 | 1.60 | 5.32 | 4.59 | 6.29 |
| Wra 751 | 5337309477433273728 | 0.169 | 0.044 | 19 | 1.02 | 0.149 | 8.3 | 1.57 | 4.82 | 3.97 | 6.06 |
| Wd1 W243 | 5940105830990286208 | 0.979 | 0.165 | 11 | 1.11 | 0.582 | 120.1 | 1.38 | 1.03 | 0.86 | 1.27 |
| HD 160529 | 4053887521876855808 | 0.438 | 0.057 | 10 | 0.94 | 0.000 | 0.0 | 2.15 | 2.18 | 1.92 | 2.50 |
| HD 168607 | 4097791502146559872 | 0.644 | 0.060 | 10 | 1.02 | 0.000 | 0.0 | 1.52 | 1.50 | 1.37 | 1.65 |
| P Cyg | 2061242908036996352 | 0.736 | 0.180 | 17 | 1.05 | 1.085 | 437.5 | 1.16 | 1.37 | 1.06 | 1.93 |
| MWC 930 | 4159973866869462784 | -0.162 | 0.094 | 11 | 0.74 | 0.217 | 10.0 | 1.36 | 7.81 | 5.78 | 10.64 |
| G24.73+0.69 | 4255908794692238848 | -0.329 | 0.223 | 10 | 1.03 | 1.302 | 233.6 | 1.44 | 5.44 | 3.58 | 8.25 |
| WS 1 | 4661784273646151680 | -0.051 | 0.031 | 18 | 1.25 | 0.222 | 8.0 | 0.48 | 8.68 | 7.50 | 10.10 |
| MN48 | 5940216130049700480 | 0.323 | 0.135 | 12 | 1.02 | 0.469 | 77.9 | 1.38 | 2.82 | 2.00 | 4.40 |
| (HD80077) | 5325673208399774720 | 0.392 | 0.031 | 15 | 0.94 | 0.000 | 0.0 | 1.20 | 2.37 | 2.21 | 2.57 |
| (SBW1) | 5254478417451126016 | 0.128 | 0.030 | 17 | 0.87 | 0.000 | 0.0 | 1.58 | 6.01 | 5.10 | 7.26 |
| (Hen 3-519) | 5338229115839425664 | 0.042 | 0.030 | 17 | 1.03 | 0.000 | 0.0 | 1.61 | 9.57 | 7.72 | 12.17 |
| (Sher 25) | 5337418397799185536 | 0.072 | 0.033 | 19 | 0.91 | 0.000 | 0.0 | 1.59 | 7.88 | 6.39 | 10.03 |
| ( Sco) | 5964986649547042944 | 0.713 | 0.242 | 12 | 0.94 | 0.947 | 297.5 | 1.36 | 1.51 | 1.01 | 2.74 |
| (HD 326823) | 5965495757804852992 | 0.743 | 0.053 | 11 | 1.05 | 0.000 | 0.0 | 1.41 | 1.30 | 1.22 | 1.40 |
| (WRAY 17-96) | 4056941758956836224 | 0.827 | 0.181 | 10 | 0.85 | 0.467 | 54.4 | 2.34 | 1.26 | 0.97 | 1.78 |
| (HD 316285) | 4057682692354437888 | 0.169 | 0.092 | 10 | 0.94 | 0.000 | 0.0 | 2.28 | 4.90 | 3.35 | 7.90 |
| (HD 168625) | 4097796621733266432 | 0.621 | 0.064 | 9 | 1.02 | 0.000 | 0.0 | 1.52 | 1.55 | 1.41 | 1.73 |
| (AS 314) | 4103870014799982464 | 0.624 | 0.052 | 11 | 0.96 | 0.000 | 0.0 | 1.75 | 1.54 | 1.42 | 1.68 |
| (MWC 314) | 4319930096909297664 | 0.191 | 0.042 | 13 | 0.91 | 0.000 | 0.0 | 1.34 | 4.36 | 3.67 | 5.33 |
| (W51 LS1) | 4319942771347742976 | 0.508 | 0.116 | 14 | 1.08 | 0.741 | 133.4 | 1.32 | 1.91 | 1.53 | 2.54 |
| (G79.29+0.46) | 2067716793824240256 | 0.180 | 0.139 | 15 | 1.06 | 0.648 | 150.3 | 0.79 | 3.09 | 2.29 | 4.36 |
| (CYG OB2 12) | 2067782734461462912 | 1.175 | 0.128 | 16 | 1.52 | 0.588 | 122.4 | 0.80 | 0.84 | 0.75 | 0.95 |
| Name | RA(deg) | DEC(deg) | (kpc) | (kpc) | (kpc) | (kpc) 333 is the most likely distance to the LBV or LBV candidate. and give the highest 68% density interval (HDI). Details of the Gaia DR2 observations are in Table 2. is the nominal distance typically adopted in the literature (see text section 3). |
|---|---|---|---|---|---|---|
| HR Car | 155.72429 | -59.62454 | 4.37 | 3.50 | 5.72 | 5.20 |
| AG Car | 164.04820 | -60.45355 | 4.65 | 3.73 | 6.08 | 6.00 |
| Wra 751 | 167.16688 | -60.71436 | 3.81 | 2.49 | 6.26 | 6.00 |
| Wd1 W243 | 251.78126 | -45.87477 | 1.78 | 0.83 | 4.16 | 4.50 |
| HD 160529 | 265.49594 | -33.50381 | 2.10 | 1.80 | 2.51 | 2.50 |
| HD 168607 | 275.31203 | -16.37550 | 1.46 | 1.31 | 1.65 | 2.20 |
| P Cyg | 304.44665 | 38.03290 | 2.17 | 0.98 | 4.25 | 1.70 |
| MWC 930 | 276.60514 | -7.22165 | 4.46 | 2.89 | 6.93 | 3.50 |
| G24.73+0.69 | 278.48031 | -6.97742 | 3.04 | 1.52 | 5.47 | 5.20 |
| WS 1 | 73.23917 | -66.68708 | 2.47 | 1.83 | 3.38 | 11.00 |
| MN48 | 252.40708 | -45.59980 | 2.74 | 1.44 | 5.18 | 5.00 |
| (HD80077) | 138.97824 | -49.97347 | 2.26 | 2.01 | 2.59 | 3.00 |
| (SBW1) | 160.08071 | -59.81940 | 5.11 | 4.03 | 6.78 | 7.00 |
| (Hen 3-519) | 163.49819 | -60.44564 | 7.12 | 5.45 | 9.65 | 8.00 |
| (Sher 25) | 168.78180 | -61.25488 | 6.28 | 4.82 | 8.52 | 6.30 |
| ( Sco) | 253.49886 | -42.36204 | 2.52 | 1.12 | 4.97 | 2.00 |
| (HD 326823) | 256.72461 | -42.61104 | 1.27 | 1.17 | 1.40 | 2.00 |
| (WRAY 17-96) | 265.39765 | -30.11078 | 3.02 | 1.16 | 7.16 | 4.50 |
| (HD 316285) | 267.05848 | -28.01478 | 4.56 | 3.05 | 7.63 | 1.90 |
| (HD 168625) | 275.33145 | -16.37392 | 1.51 | 1.34 | 1.73 | 2.20 |
| (AS 314) | 279.85874 | -13.84646 | 1.50 | 1.36 | 1.68 | 8.00 |
| (MWC 314) | 290.39156 | 14.88245 | 3.93 | 3.15 | 5.11 | 3.00 |
| (W51 LS1) | 290.94849 | 14.61083 | 2.50 | 1.19 | 4.87 | 6.00 |
| (G79.29+0.46) | 307.92617 | 40.36639 | 1.87 | 1.07 | 3.27 | 2.00 |
| (CYG OB2 12) | 308.17065 | 41.24145 | 1.04 | 0.60 | 2.21 | 1.70 |
2 Distances for LBVs in Gaia DR2
2.1 Sample Selection
We searched the Gaia DR2 (Gaia Collaboration, 2016, 2018) database (Brown et al., 2018)444http://gea.esac.esa.int/archive/ for all known Galactic LBVs and LBV candidates. As a convenient reference, we take the source list of Galactic LBVs and LBV candidates from the compilations by Clark et al. (2005a) and Smith & Tombleson (2015). To the list of Clark et al. (2005a) we added SBW1 (candidate LBV), MWC 930, MN48, and WS1 (confirmed LBVs). SBW1 was not listed in the compilation of LBVs and candidates by Clark et al. 2005a because it was discovered later in 2007 (Smith et al., 2007). It has a ring nebula similar to that of SN 1987A, and should be considered an LBV candidate for the same reason that Sher 25 and HD 168625 have been included in past lists of cLBVs. MWC 930 was not included in the list by Clark et al. (2005a) because its LBV-like variability was discovered afterward in 2014 (Miroshnichenko et al., 2014). Our total sample of Galactic LBVs and cLBVs consists of 25 objects.
Of the LBV sources we checked, 4 confirmed LBVs ( Car, GCIRS34W, FMM 362, and AFGL 2298) and 10 cLBVs (GCIRS 16NW, 16C, 16SW, 33SE, 16NE, the Pistol Star, WR102ka, LBV 1806-20, G25.520+0.216, and G26.47+0.02) did not have parallax values in Gaia DR2. LBVs or LBV candidate stars in the vicinity of the Galactic Center are not listed in Gaia DR2 because they are visually obscured, including the Pistol Star, GCIRS 16NW, 16C, 16SW, 33SE, 16NE, 34W, etc. We note that FMM 362 has an almost coincident Gaia source where the DR2 parallax indicates a distance of only 1.6 kpc. This consumed our attention for some time, but detailed examination of images shows that this 18th magnitude Gaia source is offset from FMM 362 by about 225 and is likely to be a foreground K or M-type star. FMM 362 itself is highly obscured. Some objects with IR-detected shells are also not found for similar reasons, including IRAS 18576+0341 (AFGL 2248), G25.520+0.216, and G26.47+0.02. MN44 (Gvaramadze et al., 2015) is a recent addition to the class of LBVs. However, in Gaia DR2 it has a negative parallax and an extreme astrometric noise parameter. Since there is no previous distance measurements (only example luminosities were given for assumed distances from 2 to 20 kpc), Gaia DR2 does not improve the situation and we do not discuss MN44 further here; we await DR3 for useful information on this source.
Also not included in Gaia DR2 is the very massive star Carinae. Its parallax is not available, but in this case the absence is presumably due to complications associated with its circumstellar Homunculus nebula. Fortunately, Car already has a reliable distance of 2.3 kpc based on the expansion parallax of this nebula (Smith, 2006).
2.2 Previous Literature Distances for LBVs
Galactic distances are notoriously difficult to measure. This is especially true for LBVs because (a) their luminosity cannot be uniquely determined from stellar features, (b) they often undergo significant mass loss resulting in non-negligible circumstellar absorption, and (c) they sometimes exhibit peculiar velocities. As such, the previous literature estimates of the distances to the LBVs and cLBVs considered in this study arise from incredibly varied methods.
For simplicity, we adopt the compilation of LBV+cLBV distances presented in the sample/review papers of Naze et al. (2012) and van Genderen (2001) as our “baseline” literature distances for each star. Due to their presentation in a unified location, this distances have been widely used when assessing the luminosity of the population of Galactic LBVs. It is these distances, supplemented by measurements from Gvaramadze et al. (2012); Kniazev et al. (2016); Smith (2007) for WS1, MN48, and SBW1, respectively, that are presented as in the second column of Table 1 and the final column of Table 3. However, in attempting to present the “best” distance value for each star, these compilations have sometimes averaged together measurements from multiple literature studies, and in all cases the full allowable distance range, formal errors (if given), and measurement method from original works have been obscured. Therefore in Table 1 we additionally compile this information for publications whose measurements were utilized to compile our baseline distances. While not an exhaustive list of every published distance estimate, these values illustrate the typical range of distance measurements previously available for most galactic LBVs.
Table 1 serves as a reminder of just how unreliable and heterogeneous previous distance and luminosity estimates have been for Galactic LBVs. Once a distance was estimated in the literature, subsequent authors often engaged in more detailed study of the spectrum or variability of an LBV. In doing so, it was common to adopt a representative or average distance for the sake of discussion. These adopted values often propagated to subsequent papers as a ”standard” value, but often without emphasizing or retaining the uncertainty in the original distance measurement (indeed, such bookkeeping becomes cumbersome for a caveat-loaded discussion, and many HR diagrams of LBVs in the literature have no error bars on the luminosity). Nevertheless, the considerable uncertainty in distances has a profound impact on shaping our views of LBVs and their evolutionary scenarios. Even when uncertainties in luminosity or distance were given, the quoted error bars might not include the true uncertainty. For example, a distance estimate based on radial velocity and Galactic kinematics, or based on interstellar extinction, might yield a value with an error bar — but without acknowledging that the method may not be valid for LBVs. As noted above, Galactic rotation might not work as a distance estimate if LBVs have peculiar velocities because the have received a kick, for example, and the interstellar extinction method might not work if LBVs have their own circumstellar extinction, or if their local region has interstellar dust grains with anomalous reddening properties because they have been processed by strong UV radiation. This serves to underscore the value of the new Gaia DR2 distances. Even though some of the objects have quite large DR2 error bars, they are most often comparable to or smaller than previous estimates. Moreover, they represent a single consistent method for all objects, and a direct (i.e., geometric) method that does not rely on sometimes dubious assumptions.
The most commonly utilized methods in literature distance estimates were cluster association plus main sequence fitting (7 objects), kinematics plus inferences from the Galactic rotation curve (7 objects), and extinction measurements coupled with distance-reddening relations (7 objects). Other methods occasionally invoked include comparison to other LBVs/assumption of a luminosity on the S Dor instability strip (e.g. Gvaramadze et al., 2012; Miroshnichenko et al., 2000), spectroscopic modeling (Najarro et al., 1997), maser proper motions (Imai et al., 2002; Schneps et al., 1981; Xu et al., 2009), and spectroscopic parallax.
A majority of LBVs and LBV candidates considered have distances quoted in the literature whose full ranges span 3 kpc. In particular, 12 of the 25 stars have only either approximate distances reported (no associated errors) or upper/lower limits to their distances quoted. The most precise literature measurements available come from cluster association and main sequence fitting, with typical quoted errors of 0.3 kpc. Even these, however, suffer from the sometimes questionable assumption of membership.
Four stars in our sample have previous literature distance measurements that warrant specific discussion or mention:
-
•
Wd1 W243: The distance to Wd1 W243 has been derived based on its presumed association with the cluster Westerlund 1. While the baseline distance to Wd1 given in Naze et al. (2012); Ritchie et al. (2009) is 5.0 kpc, a range of distance estimates to Wd1 exist. Clark et al. (2005a) initially quote a distance of 2 kpc and 5.5 kpc based largely on the luminosity of yellow hypergiants and the lack of identified Wolf Rayet (WR) stars in their data. Crowther et al. (2006b) subsequently quote a distance of 5 kpc based on modeling of WR stars, although they note an observed dispersion of in the distance modulus for Wd1, and caution that WR stars do not represent ideal distance calibrators. Most recently, Brandner et al. (2008) fit main-sequence and pre-main sequence evolutionary tracks to near-infrared data, finding both a more precise, and significantly lower, distance of 3.550.17 kpc. (In a separate paper, we discuss the revised cluster distance to Wd1 based on Gaia DR2; Aghakhanloo et al. 2019.)
-
•
W51 LS1: Similarly, the distance to cLBV W51 LS1 has been tied to the—surprisingly fraught—distance to the W51 complex (see Clark et al. 2009 and Figuerêdo et al. 2008 for recent summaries). Early maser proper motion measurements gave relatively large distances of 6.11.3 kpc and 8.52.5 kpc (Imai et al., 2002; Schneps et al., 1981). These were broadly consistent with kinematic measurement of 5.5 kpc (Russeil, 2003), leading Clark et al. (2009) and Naze et al. (2012) to adopt a baseline distance to the cLBV W51 LS1 of 6 kpc. However, using spectroscopic parallax measurements of 4 O-type stars, Figuerêdo et al. (2008) find a much smaller distance of 2.00.3 kpc, a distance they acknowledge is difficult to reconcile with previous measurements. Most recently, updated trigonometric parallax measurements coupled with maser proper motions have given distances slightly lower than our baseline value, but still inconsistent with the spectroscopic parallax values: 5.1 kpc (Xu et al., 2009) and 5.41(Sato et al., 2010).
-
•
HD168607/HD168625: In the literature studies presented here, LBV HD168607 and cLBV HD168625 are both assumed to be members of the same stellar association, Ser OB1, and hence have the same distance.
2.3 New Gaia DR2 Data
Table 2 presents the Gaia DR2 data for the 25 LBVs and candidates (names for LBV candidates are given in parentheses) analyzed in this paper, and Table 3 lists the distances that we infer from Gaia DR2 parallaxes. The last column of Table 3 gives a “baseline” previously adopted distance from the literature (see Section 2.2 for further elaboration on this baseline value as well as a discussion of the methods, spread, and uncertainty in previous literature estimates).
Table 2 includes the Gaia DR2 data and distance estimates from Bailer-Jones et al. (2018). The first two columns present the parallax, , and the theoretical uncertainty in the parallax, . One could simply report , and one could use to calculate an uncertainty for the distance. However, such a calculation would not fully account for all of the calibration issues or extra sources of uncertainty. Furthermore, the uncertainty for many objects in DR2 is quite large. In fact, the uncertainty can be so large that the parallax can be negative. In these circumstances, inferring the distance and uncertainty from is either inaccurate or impossible. A preferred solution for all of these issues is to infer the distance using Bayesian inference (Luri et al., 2018).
The fifth and sixth columns present the excess astrometric noise, , and the excess astrometric noise significance, . See Lindegren, Lammers, Hobbs, O’Mullane, Bastian & Hernández (2012) for a thorough discussion of the astrometric noise. In short, the excess astrometric noise represents variation in the astrometric data beyond the standard astrometric solution. The standard astrometric solution is composed of five parameters: two sky coordinates, two proper motion coordinates, and a parallax. Any unknown calibration issues or extra motions due to binaries, etc., lead to excess astrometric noise. is a measure of the significance of the excess astrometric noise. Even in the ideal situation with no true excess noise, random noise produces excess noise in about half the measurements. In the ideal situation, 98.5% of measurements have a significance of . Column seven of Table 2 shows significant excess noise for several of the LBV and candidate sources. Therefore to properly infer the distribution for the distance, one must include the excess noise.
Columns 1012 of Table 2 give the Bayesian inference for the distances by Bailer-Jones et al. (2018). Unfortunately, these distance estimates do not include the excess noise, (WELL, THEY DO - JUST NOT IN A GOOD WAY!) so we merely report them for comparison. To obtain the Bayesian-inferred distances, we searched the catalogue at http://gaia.ari.uni-heidelberg.de/tap.html which reports geometric distances inferred from Gaia DR2 parallaxes (Bailer-Jones et al., 2018). Column nine gives an estimate for the length scale of field stars in the direction of the LBV or candidate. This length scale is a parameter in the prior of the Bailer-Jones et al. (2018) estimate. is the mode of their posterior, and and give the upper and lower bounds for the highest density 68% confidence interval. Bailer-Jones et al. (2018) used a zero-point offset of mas for their inference. However, subsequent work indicates that the zero-point has significant variation (Lindegren, et al., 2018; Riess et al., 2018; Stassun & Torres, 2018; Zinn, Pinsonneault, Huber & Stello, 2018).
2.4 New Bayesian-inferred distances
The primary goal here is to use Bayesian inference to estimate the distance given by data in Gaia DR2. To infer the distance to any star, the posterior distribution for the distance, , and the zero point, is
| (1) |
and are the parallax and expected uncertainty, respectively, is the excess astrometric noise, and and are the mean and variance of the zero point parallax. is the likelihood of observing parallax given the model parameters. is the distribution of zero points. is the prior of observing given the galactic length scale of stars in the FOV.
The parameter is the expected theoretical uncertainty in the parallax, but it does not represent the full uncertainty. Lindegren, et al. (2018) found that the empirical uncertainty is 1.081 times larger than the expected value. For many objects there is also an excess astrometric noise, . Formally, represents excess noise in the entire astrometric solution, not just the parallax. The excess noise absorbs the residual in the astrometric solution. It is determined by adding in quadrature to the position uncertainty in the denominator of the minimization formula. Minimizing finds a simultaneous solution for the five astrometric parameters and the excess noise. The uncertainties of the astrometric solution are calculated using standard error propogation. Therefore, the uncertainty in the DR2 parallax includes the excess noise. However, the procedure for including the excess noise assumes that the excess noise is gaussian and uncorrelated among the observed positions. If the excess noise is a correlated systematic residual, then the excess noise model in the Gaia pipeline would not capture the true behavior of the residual. For example, when assuming that the excess noise is uncorrelated, the uncertainty in the parallax would go down by , where is the number of observations. On the other hand, a systematic uncertainty may not reduce with added observations.
Without knowing the source of the excess noise, it is difficult to determine whether the excess noise should be modeled as correlated or uncorrelated noise. Aghakhanloo et al. (2019) measured the empirical uncertainty distribution for the star cluster Westerlund 1 in the same way that Lindegren, et al. (2018) measured the empirical uncertainty distribution for all quasars in Gaia DR2. Whereas the empirical uncertainty is 1.081 times larger for the quasars, Aghakhanloo et al. (2019) found that most of the stars have a large astrometric excess noise and the empirical uncertainty for the stars in Westerlund 1 is 1.6 times larger than the DR2 solution. This may suggest that the assumption of uncorrelated excess noise is inconsistent with the data. Instead, the excess noise may not be random noise but a correlated residual.
Since this paper analyzes individual stars, it is impossible to empirically measure the uncertainty for each. Yet, several LBVs have large astrometric excess noise, and it is likely that the excess noise contribution to the parallax uncertainty is underestimated. W243 illustrates this point. W243 is in Westerlund 1, which has a distance of kpc (Aghakhanloo et al., 2019) as determined by a large statistical sample of DR2 parallaxes of cluster members. Yet, the DR2 distance to the individual star W243 is kpc. Using the DR2 uncertainty, kpc, this would be 9 sigma from the statistically inferred distance to Westerlund 1. Even using the statistical uncertainty of kpc from Aghakhanloo et al. (2019), the Gaia DR2 estimate for W243 is still 5 sigma from the statistical cluster estimate. Clearly, the parallax uncertainty in DR2 is underestimated in some cases.
Given the above problems with the astrometric excess noise, and our goal of estimating distances for individual objects, we choose to adopt a conservative uncertainty estimate. In our analysis, we found that making different assumptions nevertheless led to robust results for sources with small or zero , but for sources with significant astrometric noise, the resulting distance could jump by much more than the DR2 uncertainty. Hence, the excess residual that contributes to the parallax should be increased for such sources. In the absence of further information, we adopt the most conservative approach, and add the full excess noise, in quadrature with the theoretical parallax uncertainty, :
| (2) |
While this yielded rather large uncertainty for some sources, we found that this uncertainty encompassed the full variation we had found in derived distances under different assumptions in the analysis. With the larger uncertainty included this way, we achieved consistent results. In many cases, these large uncertainties in the resulting distances for sources with large are still an improvement over estimates in the literature.
Inferred distances are also affected by the adopted zero point offset in the astrometric solution for the parallax. and are the mean and variance for the zero point parallax. In the initial astrometric solution for DR2, Lindegren, et al. (2018) used quasars to quantify the zero point. They found an average of 0.029 mas. In addition, they noted significant variation in the zero point as a function of sky position and other possible parameters such as brightness and color. They did not quantify the variation in zero point; rather they encourage users of Gaia DR2 to model their problem-specific zero point. Riess et al. (2018) use Gaia DR2 parallaxes to calibrate Cepheid distances, and infer a zero point of 0.046 (0.013) mas. Zinn, Pinsonneault, Huber & Stello (2018) compare the distances inferred from astroseismology to infer a zero point of 0.0528 (0.0024) mas. Stassun & Torres (2018) use distances derived from eclipsing binaries to infer a zero point of 0.082 (0.033) mas. These are all estimates for the mean zero point ; Lindegren, et al. (2018) note a spatial variation of the offset of about 0.03 mas in the direction of the LMC. Therefore, we assume that . Unfortunately, determining the zero point specifically for LBVs is difficult. They typically lie in the plane of the Galaxy, where there are no observable quasars, and there are no accurate distance measures for LBVs. Therefore, our best estimate for the zero point is the mean of the above four investigations, mas, and we use the spatial variation from Lindegren, et al. (2018) for . These measures of the zero-point are far from ideal, but they are a good first attempt.
The likelihood and distribution for the zero points are as follows: The likelihood for observing parallax is
| (3) |
Lindegren, et al. (2018) show that the zero point has significant variation as a function of sky location. Therefore, we model the distribution of zero points as
| (4) |
represents the prior for based upon the Galactic distribution of stars and dust extinction. Consider an image populated with Galactic stars. The total number of stars in the image is given by , where FOV is the field of view in square radians, and is the number density of stars. If is constant, then any random star in the image is drawn from a probability distribution of . In the presence of dust extinction, this distribution will be attenuated by , where is an effective optical depth for extinction. For these reasons, Bailer-Jones et al. (2018) use the following prior when calculating the geometric distance to stars in Gaia DR2:
| (5) |
where is the attenuation length and depends upon the Galactic coordinates . This prior has a mode at .
To find the posterior distribution for only the distance, we marginalize eq. (1) over the nuisance parameter, the zero point, . In practice, this marginalization involves a convolution of the likelihood, eq. (3), with the distribution for zero points, eq. (4). The convolution of two Gaussian distributions is analytic and so is the final posterior distribution.
| (6) |
The geometric distances in columns 4-6 of Table 3 are the mode (column 4) and the highest density 68% interval (HDI, columns 5 & 6) for this posterior distribution. The seventh column in Table 2 gives the attenuation scale, , in the prior. These were calculated using the same technique as in Bailer-Jones et al. (2018).555The python code to calculate these distances is available at the following GitHub repository: https://github.com/curiousmiah/Gaia_Distances. The posterior distribution seamlessly handles both accurate and inaccurate parallax measurements. In the limit of an accurate parallax measurement, the width of the posterior will be dominated by the Gaussian and consequently . In the limit of very inaccurate parallax measurements, the mode and uncertainty will be dominated by the prior. Therefore, in the inaccurate cases, the most likely distance will be .
Since LBVs may be atypical in their distance distribution, it is not clear that the Bailer-Jones et al. (2018) prior is the most appropriate prior to use. LBVs tend to be quite bright, so the distance scale, , should probably be larger, and it is not clear that LBVs should trace the general population of stars. The prior mostly affects the result of those with very uncertain parallaxes.
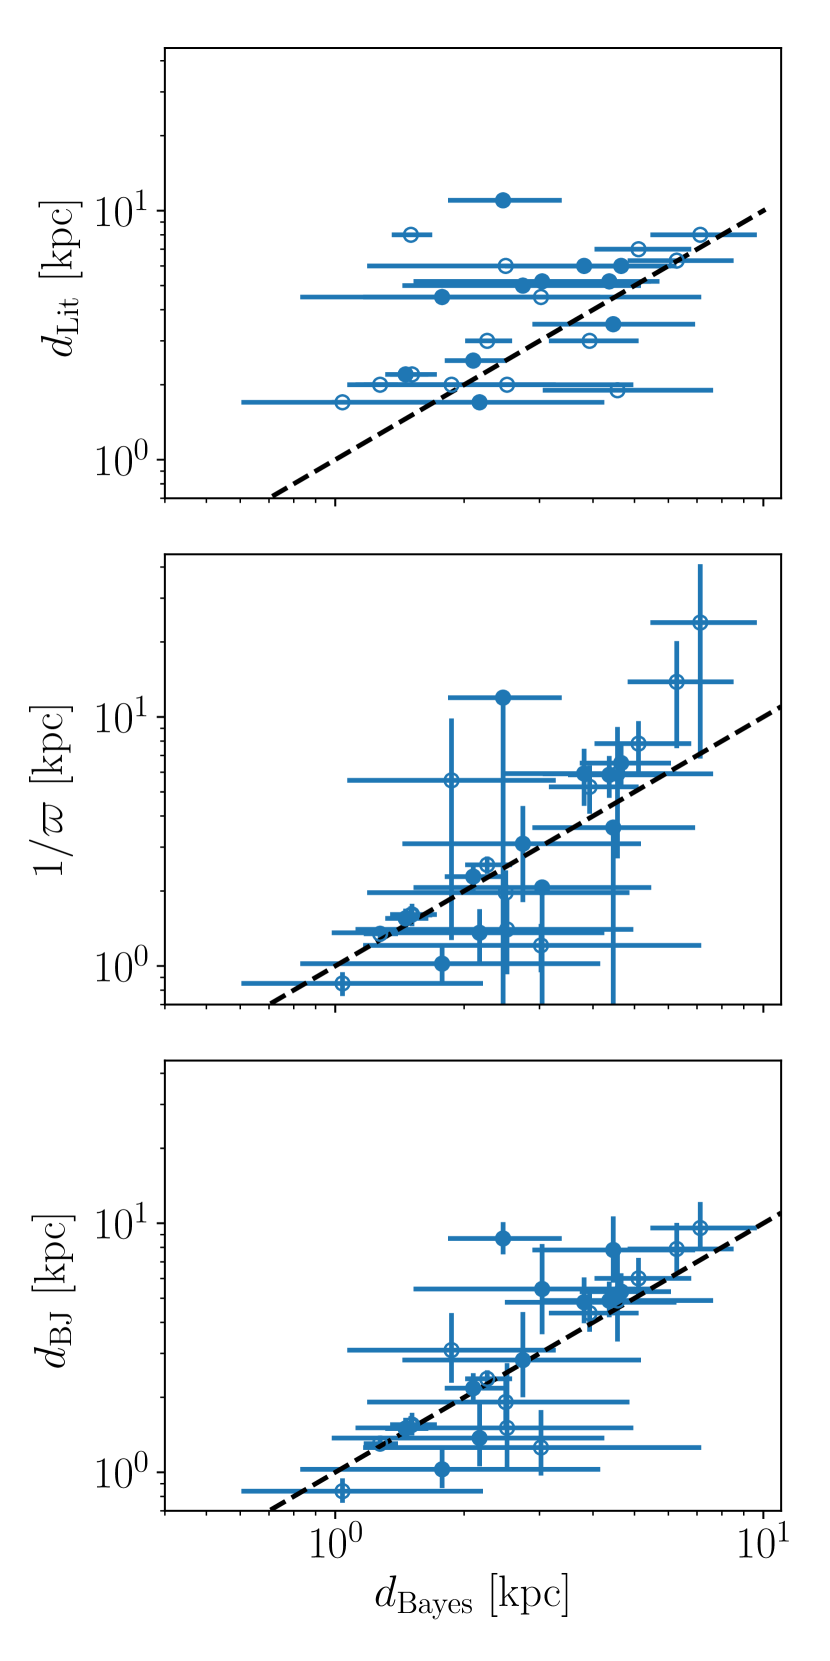
Figure 1 compares all four distance estimates: our Bayesian-inferred distance () is compared to (bottom panel) the Bailer-Jones Bayesian estimate, then (middle panel) the simple calculation (), and (top panel) literature distances (). In all panels, the filled circles represent LBVs and the open circles represent the LBV candidates.
The bottom panel of Figure 1 compares the mode and 68% HDI of eq. (6), with the mode and HDI of Bailer-Jones et al. (2018), . The primary differences are that the posterior distribution for includes a more conservative prescription for the excess astrometric noise, a slightly more negative zero point, and a variation in the zero point. The zero point in the distances is 0.029 mas, and the zero point for is 0.05 (0.03) mas. As a result, the uncertainties for are larger when the excess noise is non-zero. Because the zero point for is slightly more negative, those distances tend to be smaller than .
The middle panel of Figure 1 compares with . Naturally, both methods are roughly consistent; the derivation of uses after all. However, there are some noteworthy differences. At distances larger than 4 kpc, the distances are systematically larger than . This systematic discrepancy is mostly due to the zero-point offset. For some, the prior distribution dominates the posterior for ; for these distance estimates, tends to have much larger mode and uncertainty.
The top panel of Figure 1 compares with the baseline previous literature estimates, , described in Section 2.2. On average, the literature distances are larger than the new inferred distances; the average literature distance is kpc, and the average distance is kpc. For about half of the objects, the two estimates are consistent. For most of the other half, the literature distances significantly overestimate the distance. To be more quantitative, there are 25 LBVs and candidates. 11 of the literature distances are outside of the 68% confidence intervals (CIs). In particular, 2 are below the CIs, and 9 are above. The expectation is that roughly 16% should be below and 16% should be above; 16% of 23 is 4. The Poisson probability of 2 below when the expected value is 4 is 15%, which is roughly consistent. The Poisson probability of 9 above is 1.5%. As a population, there is a tension between the literature distances and the Gaia DR2 distances in that the literature distances tend to be too large. This has a significant impact on the inferred luminosities and masses of LBVs.
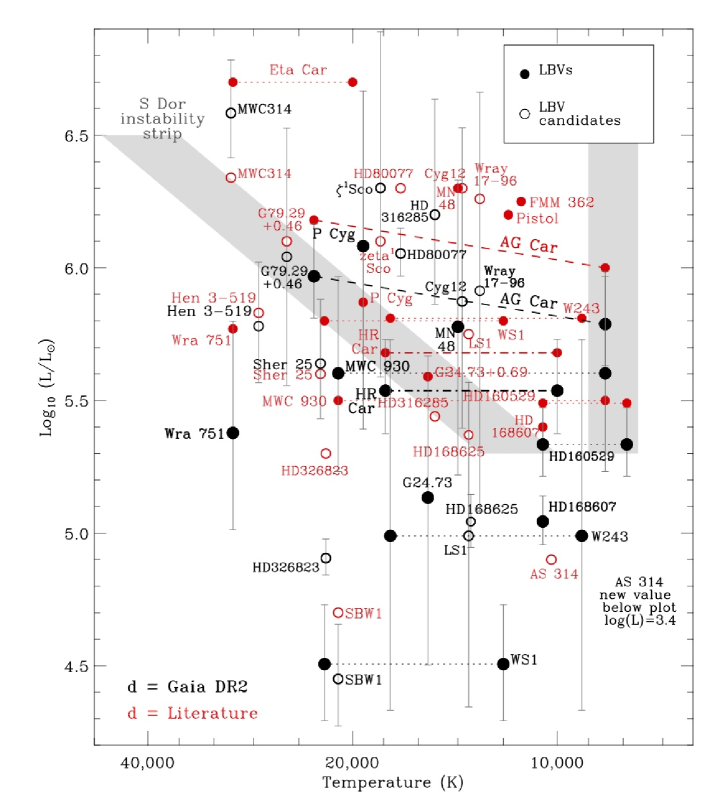
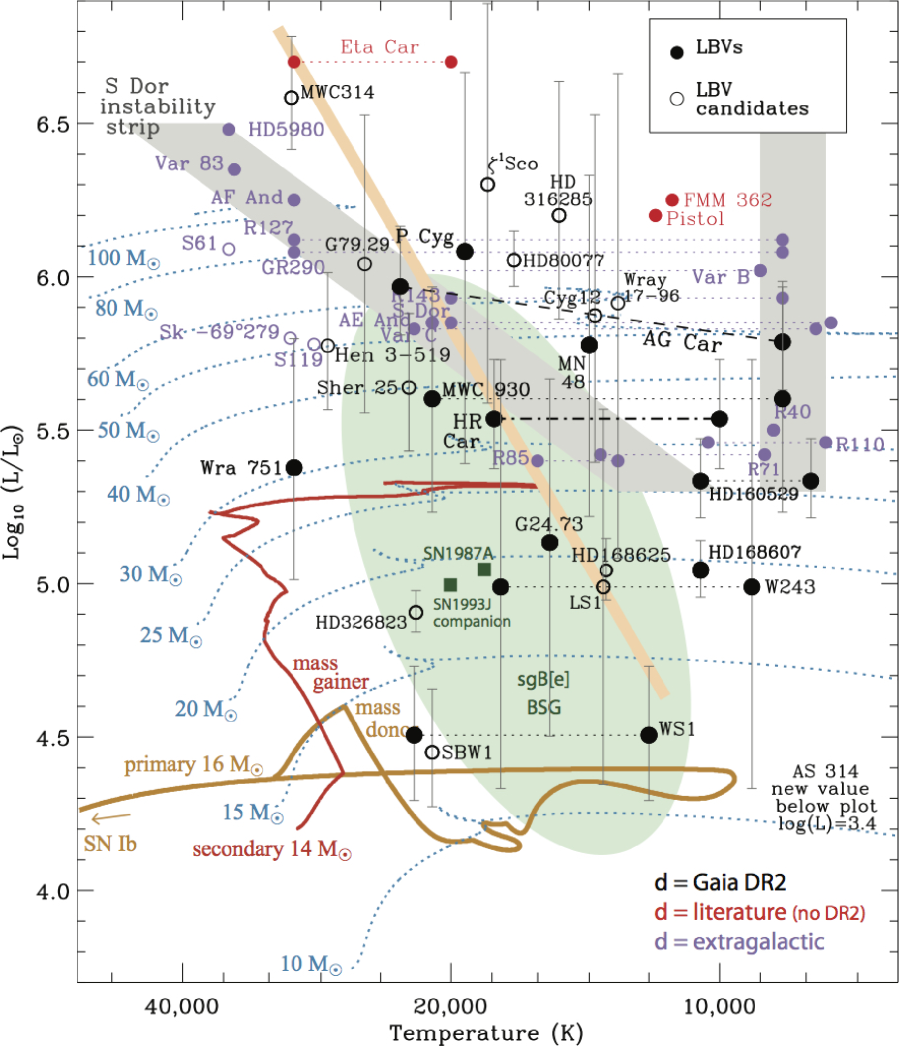
Figure 2 shows a revised HR diagram for LBVs using updated distances from Gaia DR2 from Table 3. To construct this, we adopted previously published values of and compiled from the literature (Smith & Stassun, 2017; Smith & Tombleson, 2015; Clark et al., 2005a; Naze et al., 2012) with their associated previous distances (see Section 3), and we simply scaled the bolometric luminosities appropriate to the new DR2 distances666Recall that determinations of Teff from spectroscopic analysis have negligible dependence on the distance (Section 1).. Figure 3 shows a similar HR diagram with the new DR2 values compared to previous literature estimates. Some LBVs changed little and others changed dramatically. LBV positions based on previous literature values are plotted in red, and those with their scaled by the new Gaia DR2 distances are plotted in black. Figure 4 then shows these same new values, but superposed with additional information for context, including extragalactic LBVs in nearby galaxies, the previously proposed S Doradus instability strip, locations of B supergiants and B[e] supergiants, a few SN progenitors, and representative stellar evolution model tracks. Extragalactic LBVs in the LMC, SMC, M31, and M33 are plotted in light purple for comparison. Representative single-star and binary evolution tracks are included for comparison, as in earlier versions of this figure by Smith & Stassun (2017) and Smith & Tombleson (2015). These model tracks are from Brott et al. (2011) and Langer & Kudritzki (2014).
2.5 The Significance of the Zero-point and the Lower Distances
The Gaia DR2 parallaxes provide the largest collection to date of LBV and LBV candidate distances that are measured in a uniform and direct way. As an ensemble, these distances are significantly lower than previous literature distances. In total, there are 25 LBVs and candidates, 11 have literature distances that are larger than the 68% HDI. The Gaia DR2 distances are closer than previous estimates for two reasons. First, on average, the measured parallaxes are larger. Second, there is a significant negative zero point offset for Gaia DR2. In other words, the true parallax is larger by 0.05 mas. HD168607 is an example for which the Gaia DR2 distance is closer even if one ignores the zero-point offset. The previously reported distance to HD 168607 is 2.2 kpc. Including the zero-point offset, the Gaia DR2 distance is kpc. Without applying the zero-point offset, the Gaia DR2 distance is kpc.
AG Car is an example for which the offset changes the consistency between the Gaia DR2 distance and the previous estimate. The previous distance estimate was 6 kpc. With a zero point offset the Gaia DR2 distance is kpc, and without the zero point, it is kpc. With the offset, there is a mild tension between the Gaia DR2 distance and the previous distance esimate. Without the offset, both distances are consistent.
Collectively, if one omits the offset, then the number of objects with previous distances that are outside the 68% HDI reduces from 11 to 10. The Poisson probability of 8 when 4 is expected is 3%, while for 9 it is 1.3%. Therefore, the tension only slightly depends upon the reliability of the zero-point estimate. It is difficult or impossible to measure the offset for each LBV directly. There are few accurate independent distance estimates for LBVs in the Galaxy, and because they reside in the Galactic plane, there are no bright background quasars to provide the zero-point calibration. Based upon the estimates of four independent groups, the global average offset is consistently measured to be about 0.05 mas. The average offset for 556,869 quasars is 0.029 mas (Lindegren, et al., 2018); the average offset for 50 Cepheid variables is 0.046 (0.013) mas; the average offset of 3500 giants with astroseismology is 0.0528 (0.0024) mas, and the average offset for 89 eclipsing binaries is 0.082 (0.033) mas. The mean of these is and the standard deviation is mas. This represents the global average, but Lindegren, et al. (2018) note a significant spatial variation in the offset. In the direction of the LMC the variation is about 0.03 mas.
3 NOTES ON INDIVIDUAL LBVs
Here we provide notes on each of the 25 LBVs and candidates discussed in this work and the impact of the new Gaia DR2 distances. In this sample of 25 LBVs and candidates, 11 have Gaia DR2 posterior distances for which the 68% HDI is closer than the literature distances. This represents almost half of the LBV and cLBV sample, even though the expectation is that only 4 should have closer distances. The Poisson probability of having 9 closer when 4 are expected is 1.3%. Some of these distance estimates changed by a large factor.
3.1 Confirmed LBVs
HR Carinae: The Gaia DR2 Bayesian-inferred distance (Table 3) is 15% closer than its traditional value. Its luminosity therefore moves down by 28% on the HR Diagram. The Gaia DR1 parallax yielded a smaller distance around 2 kpc as well, although with a large uncertainty, so Smith & Stassun (2017) did not advocate a revision to the traditional distance. The new value is consistent within the uncertainty of DR1, although the distance from DR2 is more precise. Here, the new distance is somewhat lower than and the star somewhat less luminous, but marginally consistent with the traditional value within the uncertainty. Therefore, the Gaia DR2 distance for HR Car does not significantly alter our interpretation of this objects parameters (Groh et al., 2009b).
AG Carinae: As for HR Car, the Gaia DR2 distance derived in Table 3 is slightly closer than the traditional value. Adopting the most likely value in Table 3 (plotted in Figure 4), AG Car is about 20% closer (moving from 6 kpc to 4.7 kpc) and is therefore about 40% less luminous than previously determined from detailed analysis by Groh et al. (2006, 2009a). However,the large uncertainty means that there is only a weak tension between the Gaia DR2 and literature distance. In fact, accounting for the errors in the original kinematics and reddening-distances measurements (Humphreys et al., 1989; Hoekzema et al., 1992), there is overlap with the upper end of the Gaia DR2 68% HDI. This is in contrast to the much closer distance inferred from the Gaia DR1 parallax, which was reported to be about 2 kpc (Smith & Stassun, 2017). That closer distance was evidently an underestimate, although the range of distances indicated by the DR1 uncertainty of 1.3 to 3.7 kpc are marginally consistent with the DR2 68% HDI range found here of 3.7 tp 6.1 kpc. A much closer distance for AG Car would have been surprising and problematic, since it would have moved AG Car – a prototypical classical S Dor variable – to be far below the S Dor instability strip that it helped to define, and far from its near twin R 127 in the LMC. Gaia DR2 values suggest that more modest revision to its traditionally assumed distance is needed. The new DR2 value is consistent with the traditional S Dor strip, although its implied effective initial mass (compared to single-star models) would be around 60-70 instead of 90 .
Wra 751: The Gaia DR2 distance for this LBV in Table 3 moves it from a baseline literature distance of 6 kpc to kpc. While a significant nominal correction, this is just barely consistent with the old value within the uncertainty, and has more overlap with the original distance measurements of van Genderen et al. (1992) who simply quote limits of 45 kpc. With the more reliable uncertainties of the Gaia DR2 distance, this provides a stronger case that Wra 751 is significantly below or hotter than the S Dor instability strip on the HR Diagram. If Wra 751 really is off the S Dor instability strip, then this is interesting because it is now considered a confirmed LBV, due to the development of apparent S Dor variability (Sterken et al., 2008; Clark et al., 2005a). This is also of interest because Wra 751 has been associated with a presumed host cluster (Pasquali et al., 2006). It therefore bucks the trend that LBVs statistically avoid O-star clusters (Smith & Tombleson, 2015). Although Wra 751 is in a cluster, the cluster’s age and turnoff mass do not agree with those of the LBV if it has evolved as a single star. From its position on the HR Diagram, we would expect Wra 751 to have an effective single-star initial mass around 30-40 . As noted by Pasquali et al. (2006), however, the earliest spectral type main sequence star in the host cluster is O8 V, translating to a cluster turnoff mass around 20 . This is consistent with results from LMC LBVs, where it has been noted that in the few cases when LBVs are seen in a cluster, they seem too young and massive for their environment (Smith & Tombleson, 2015). This, in turn, reinforces ideas about the role of binary evolution and rejuvenation that make LBVs massive blue stragglers (Smith & Tombleson, 2015; Smith, 2016; Aghakhanloo et al., 2017). Wra 751 would be an excellent case study for investigating how its proper motion compares to those of the cluster members.
Wd1 W243: This is a special case because it has a host cluster with a Gaia DR2 distance; see Section 3.3 below.
HD 160529: Gaia DR2 indicates that this object’s new distance is kpc, which is smaller than its usually adopted value of 2.5 kpc. Its luminosity moves down by about 30%, although the old value is just outside the 68% confidence interval. This places HD 160529 at the very bottom of the traditional range of luminosities for LBVs.
HD 168607 and HD 168625: Although HD 168625 is a candidate LBV (section 3.2 below), we discuss it here alongside HD 168607. These two are usually considered as a pair since they are only 1 apart on the sky. As described in Section 2.2, HD168607 and HD168625 have both been considered members of the same stellar association Ser OB1. HD168607 has long been considered as a confirmed LBV (Chentsov, 1980) in the group of low-luminosity LBVs (Smith et al., 2004), sometimes thought to arise from post-RSG evolution. HD168625 is a blue supergiant and considered an LBV candidate based on its dusty circumstellar nebula, which is observed to have a triple-ring structure that is very reminiscent of SN 1987A (Smith, 2007). The new Gaia DR2 measurements for each star are both very consistent with one another ( and ; supporting their joint membership in Ser OB1) and significantly lower than the usual literature value of 2.2 kpc. The new Gaia DR2 distances (1.32-1.63 kpc) are consistent (within the uncertainty) with the Gaia DR1 distance of 0.75-1.89 kpc for HD168607 previously reported (Smith & Stassun, 2017). With the new distances, the luminosity of each star drops by a factor of 2 from literature measurements. Importantly, both stars land well below the traditional range of luminosities for LBVs and well below the S Dor instability strip. For both stars, the lower luminosity would imply an effective single-star initial mass of around 20 or below. In the case of HD168625, this lower luminosity is very close to that of the progenitor of SN 1987A, strengthening comparisons between these two objects that were previously based primarily on the triple-ring structure of the nebula around HD 168625 (Smith, 2007).
P Cyg: P Cyg has a large excess noise, mas, and the observed parallax is only mas. Therefore, the range of allowed distances is quite large; the 68% HDI goes from 0.98 to 4.25 kpc. This is consistent with the previous estimate of 1.7 kpc. Unfortunately, we cannot say anything new about the distance and luminosity of this LBV due to the large astrometric noise and large DR2 uncertainty.
MWC 930 (V446 Sct): The distance for this confirmed LBV (Miroshnichenko et al., 2014) has a negative parallax in Gaia DR2. A crude way to deal with the negative parallax is to treat the parallax uncertainty as a lower limit for the distance. Including both the statistical uncertainty and the excess noise, the total uncertainty is mas, and the corresponding lower limit for this LBV is 4.2 kpc. At face value it would seem that the lower limit is farther than previously adopted literature value. However, the more formal statistical Bayesian inference gives a distance of kpc (Table 3). This value is dominated by the adpted prior. This is marginally consistent with the previous literature value of 3.5 kpc.
G24.73+0.69: This LBV with a dusty shell has a negative value for the parallax listed in Gaia DR2, and is similarly dominated by the prior. The statistical uncertainty for G24.73+0.69 is only mas, but the excess noise is quite large, making our formal uncertainty mas. In this case, the lower limit for G24.73+0.69 is 0.8 kpc. Given this large uncertainty, the Bayesian distance in Table 3, kpc, is dominated by the prior. This is lower than the literature value of 5.2 kpc, but consistent within the uncertainty, and so this star is still marginally consistent with being an LBV on the S Dor instability strip. The higher precision expected in future Gaia data releases is needed to say more.
WS 1: WS 1 was classified as a bona-fide LBV by Kniazev et al. (2015) based on observations of significant photometric and spectroscopic variability. The Gaia DR2 distance of 2.48kpc is significantly lower than the baseline literature value of 11 kpc, although this object has a negative parallax and like the previous two, is dominated by the prior. However, the literature luminosity is also highly uncertain because it is not based on a measurement — itwas derived by assuming that the star fell on the S Dor instability strip Gvaramadze et al. (2012), so perhaps a large revision is not so surprising. Gaia data suggests that the star is significantly lower in luminosity, although again DR3 data are needed for a confident result.
MN48: MN48 was classified as a bona fide LBV by Kniazev et al. (2016) who identified spectroscopic and photometric variability typical of LBVs. There is large excess noise in the Gaia DR2 data for this star, and the resulting 68% HDI spans 1.44 to 5.18 kpc. The upper end of this range is marginally consistent with the previous literature value of 5 kpc, although again, the literature value was highly uncertain as well.
3.2 Candidate LBVs
HD 80077: This blue hypergiant was included as an LBV candidate by van Genderen (2001) based mainly on its high luminosity and spectrum. Its new Gaia DR2 distance is significantly closer than the baseline literature value, reducing its nominal luminosity by about 40%, although its luminosity is still above the S Dor strip. The Gaia DR2 distance and the original cluster-fitting distance of Steemers & van Genderen (1986) (2.80.4) agree within their quoted errors.
SBW1: As in the cases of Sher 25 and HD 168625, this blue supergiant is an LBV candidate because of its circumstellar nebula that bears a remarkable resemblance to the ring nebula around SN 1987A. In fact, it has been argued that SBW1 is in some respects the best Galactic analog to the progenitor of SN 1987A, in terms of both its nebula and the properties of the weak-winded central star (Smith et al., 2013, 2017). Based on various considerations, Smith et al. (2017) favored a distance of about 7 (1) kpc for SBW1. The Gaia DR2 parallax indicates a distance of 5.2 kpc (Table 3). This distance is closer, but the range of 4.0-6.8 kpc overlaps with the uncertainty of 7 (1) kpc for the previous distance. This new distance corresponds to a somewhat lower effective single-star initial mass of 13-15 , as compared to 18 for the progenitor of SN 1987A (Arnett, 1989). This confirms the notion that SBW1 is an analog of the progenitor of SN 1987A and its nebula (Smith et al., 2013), although at somewhat lower initial mass. Importantly, the new Gaia DR2 distance and uncertainty confirm that although SBW1 is seen to be projected amid the young Carina Nebula at around 2 kpc, it is in fact a luminous background blue supergiant star and not a member of the Carina nebula population.
Hen 3-519: The large Gaia DR2 distance for Hen 3-519 contradicts the closer distance from Gaia DR1 reported by Smith & Stassun (2017), which was around 2 kpc. The new Gaia DR2 distance is kpc, and is consistent with the traditionally assumed value of around 8 kpc. This indicates that Hen 3-519 is still a very luminous LBV candidate. Its new value barely overlaps with the S Dor instability strip within the uncertainty, although it may be below the S Dor strip (especially for some proposed locations of the S DOr strip, as shown in Figure 4. The reason why the DR1 distance was too close likely has to do with the interpretation of the large uncertainty. The uncertainty in parallax for Hen 3-519 was large to begin with, having a DR1 value of = 0.796 0.575 mas. Adding a correction of 0.3 mas to this uncertainty, as noted by Smith & Stassun (2017), would give a negative parallax. In hindsight, taking the uncertainty as indicating a lower limit to the distance would have been a better choice. Smith & Stassun (2017) adopted the prior distribution for stars in the Milky Way from Astraatmadja & Bailer-Jones (2016), which was intended to account for systematic underestimate of the luminosity, but that prior distribution may have been inappropriate for a distant LBV.
Sher 25: The blue supergiant Sher 25 is of interest because of its ring nebula that resembles the equatorial ring around SN 1987A, and because of its projected proximity to the massive young cluster NGC 3603. The large distance of 6.6 kpc (Table 3) is remarkably consistent with previously assumed values. This is important because Sher 25 was thought to be considerably more luminous than the progenitor of SN 1987A (also shown in Figure 4), with a luminosity that corresponded to about twice the initial mass (40 vs. 18 ). It appears to be below or barely overlapping with the S Dor instability strip. These results are suggestive that Sher 25 is too massive to be considered as a good analog of SN 1987A’s progenitor in terms of initial mass. Importantly, at this luminosity, the ring around Sher 25 has probably not arisen from a fast blue supergiant wind that swept into a previous red supergiant (RSG) wind, since in that scenario the surrounding nebula would probably be more massive and younger. This is in agreement with its chemical abundances, which are inconsistent with the level of enrichment expected if it had passed through a previous RSG phase (Smartt et al., 2002).
Sco: This is a blue hypergiant star that was included as an “ex-dormant” LBV (i.e. an LBV candidate) by van Genderen (2001) because of its hypergiant-like spectrum and microvariability. It was previously assumed to be at a distance of around 2 kpc, placing its luminosity just above the S Dor instability strip. The excess noise for this star is quite large, mas, making the distance uncertainty quite large and dominated by the prior. The old value for the distance and the Gaia DR2 most likely distance are above the S Dor instability strip. However, the new uncertainty overlaps the instability strip.
HD 326823: This blue supergiant was considered as another “ex-dormant” LBV (candidate) by van Genderen (2001), again because of its spectrum and microvariability. More recently, it has been suggested to be a close binary system with a period of 6.1 d (Richardson et al., 2011). Its new Gaia DR2 distance is reduced from the old value by about 37%, reducing its luminosity to less than half its previous value. The error bar on the Gaia DR2 distance (1.18-1.38 kpc) is small enough that this is a significant revision. Its corresponding effective single-star initial mass is reduced from 25 to 17-18 . This is yet another case of an LBV candidate with stellar properties very similar to those of SN 1987A’s progenitor or the putative surviving companion of SN 1993J. This similarity combined with its status as a close binary make this a potentially very interesting target for comparison with the progenitor systems of SN 1987A and SN 1993J.
Wray 17-96 (B61): This classic B[e] supergiant is considered to be an LBV candidate based on its dusty circumstellar shell nebula discovered by IR surveys (Egan et al., 2002). Its previously adopted distance of 4.5 kpc would imply an extreme luminosity for this object above 106 , placing it in the regime of classical high-luminosity LBVs, although it has not exhibited LBV-like variability. Unfortunately, the large excess astrometric noise limits the Gaia DR2 distance between 1.2 and 7.2 kpc.
HDE 316285: This star is sometimes considered an LBV candidate due to is remarkable spectral similarity to Car (Hillier et al., 2001) and its dusty nebula (Clark et al., 2005a; Morris et al., 2008). Although the uncertainty in distance is large, the new Gaia DR2 parallax suggests that HDE 316285 is significantly farther away than previously assumed, moving it from about 1.9 kpc out to about 5 kpc. This raises its luminosity by more than a factor of 6. As such, it is pushed well above the upper luminosity limit for RSGs and into the regime of the classical LBVs, becoming potentially even more luminous than AG Car (although, again, the error bar is large). This larger distance and higher luminosity may help explain why the spectrum of HDE 316285 has such an uncanny resemblance to Car (Hillier et al., 2001). Interestingly, Morris et al. (2008) speculated that HDE 316285 may be coincident with Sgr D near the Galactic center at a distance of around 8 kpc. This is farther than the most likely Gaia DR2 distance, but permitted within the uncertainty, although it is unclear if its line of sight extinction is consistent with a distance this large.
HD 168625: see above (Section 3.1).
AS 314: This star was considered to be an LBV candidate based on its presumed high luminosity at a large 8-10 kpc distance, its hypergiant-like spectrum, and dust excess (Miroshnichenko et al., 2000; van Genderen, 2001; Clark et al., 2005a). The new Gaia DR2 parallax moves its distance from 8 kpc to only about kpc, and with no excess astrometric noise, lowering its luminosity by a factor of 25 to only log(/)=3.5. Its new luminosity is so low that it cannot be plotted in Figure 4 because it is off the bottom of the plot (even its upper error bar is below the bottom of the plot). This is probably a post-AGB object from an intermediate-mass star, and it is most likely not related to LBVs.
MWC 314: This is one of two sample stars with both a relatively small uncertainty on the distance, and where the distance has increased compared to values adopted in the literature. This LBV candidate has moved from about 3 kpc to kpc (Table 3), roughly doubling its luminosity. This moves it about one sigma off the S Dor instability strip and makes it similar to Carinae on the HR diagram (Figure 4). The distance calculated from the parallax makes it seem quite likely that MWC 314 may be one of the most luminous stars in the Milky Way.
W51 LS1: This luminous blue supergiant was added to the list of LBV candidates by Clark et al. (2005a), based on its supergiant spectrum and high luminosity. It has shown no variability or obvious shell nebula, but does have a near-IR excess. As described in Section 2.2, the distance to the W51 complex has a complex history. The new Gaia DR2 parallax indicates a smaller distance for this source than most previous measurements: . The wide HDI is due to the large excess astrometric noise. With such a large excess noise, the posterior distribution is heavily influenced by the prior distribution, and while inconsistent with our baseline literature value 6 kpc, does just barely overlap with recent maser proper motion measurements of Xu et al. (2009); Sato et al. (2010). Intriguingly, our Gaia measurements also show significant overlap with the spectroscopic parallax measurement of Figuerêdo et al. (2008). W51 LS1 revised position lies within the region of normal blue supergiants and B[e] supergiants (green oval) in the HR diagram, but the large uncertainty still encompasses the lower end of the S Dor instability strip (Figure 4).
G79.29+0.46: This is an LBV candidate with a dust shell. The Gaia DR2 distance kpc (Table 3) is consistent with the literature distance of 2 kpc. The distances are consistent, and so G79.29+0.46 is still likely a massive star, and its dust shell is not a planetary nebula.
Cyg OB2 #12: Cygnus OB2 #12 is a B hypergiant that is usually considered as an LBV candidate because of its extremely high luminosity and cool temperature (Clark et al., 2005a; Massey et al., 2001; Humphreys & Davidson, 1994). It has rather mild variability, so van Genderen (2001) classified it in the group of “weak-active” S Doradus variables (meaning low-amplitude 0.5 mag variability). Its status as one of the most luminous stars in the Milky Way (e.g., de Jager 1998) is based on its presumed association with Cyg OB2 at about 1.7 kpc (Clark et al., 2005a, 2012). Recently, however, Berlanas et al. (2019) have questioned this association. Berlanas et al. (2019) find two likely populations along the same line of sight from a recent analysis of Gaia DR2 data, with one at 1.76 kpc (close to the traditional distance for Cyg OB2) and a foreground group at 1.35 kpc. The excess astrometric noise for this star is quite large, 0.588 mas. The measured parallax is =1.178 (0.128) mas, so while the measured parallax is larger than the excess noise, the excess noise does significantly impact the uncertainty. Moreover, the RUWE value of 1.52 makes this the only source in our sample that is bigger than the value of 1.4, above which Lindegren, et al. (2018) caution against. The HDI for Cyg OB2 #12 is between 0.6 and 2.2 kpc. Hence, Gaia DR2 is consistent with the literature distance, or the two diufferent distance of subgeroupos along the same line of sight of 1.76 or 1.35 kpc (Berlanas et al., 2019).
3.3 Westerlund 1 and W243
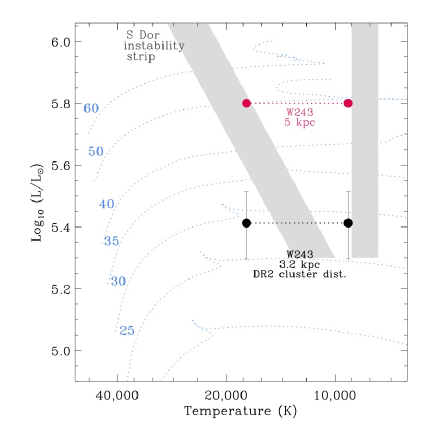
W243 is a confirmed LBV that is thought to be associated with the young massive star cluster Westerlund 1 (Clark & Negueruela, 2004; Clark et al., 2005a). It exhibits photometric variability and changes in spectral type that have been interpreted as LBV-like variability (Clark & Negueruela, 2004), but the variability that has been observed is not conclusively due to S Dor-like cycles. With a often-presumed distance of 5 kpc for that cluster, W243 would be a luminous LBV with an effective single-star initial mass around 50 , similar to S Dor. With that presumed mass, it helps define the inferred turn-off mass, young age, and high total stellar mass of Wd1. In Gaia DR2, W243 has a large astrometric excess noise, mas, which is almost as large as the measured parallax, mas. As a result, the Gaia DR2 HDI for W243 alone is unfortunately large, between 0.83 and 4.15 kpc, the upper end of which is closer than the typical literature value (although to be fair, previous literature estimates had a wide dispersion from 2-5 kpc as well, a dispersion that is often not quoted).
On the other hand, if W243 is truly a member of the Wd1 cluster, then the numerous other members of the cluster (many of which do not have such large astrometric noise) can be used to reduce the uncertainty in distance. A full analysis of the DR2 results for a sample of stars in Wd1 is beyond the scope if this paper, but we have conducted this analysis and discuss it in a separate article (Aghakhanloo et al., 2019). In that study, we find a well-determined Gaia DR2 distance to Wd1 of 3.2 0.4 kpc. This cluster-based distance would be a less extreme revision to its distance and luminosity than for the Gaia DR2 data for the star W243 alone, but also clearly reduced from the usually adopted value around 5 kpc. At the new cluster distance, W243 would have a lower luminosity, appropriate to an evolved single star of around 25-30 M⊙ (see Figure 5) instead of 50 (the implied cluster turn-off mass would be lower as well, and the cluster age would be older than previously assumed so that it is not such a young and massive cluster after all; see Aghakhanloo et al. 2019). W243 would be near the bottom of the traditional range of luminosities for LBVs, close to where the S Dor strip meets the constant-temperature outburst strip. However, at this low luminosity, W243’s presumed hot temperature around 17-18 kK indicated by its B2 spectral type in quiescence (Clark & Negueruela, 2004; Clark et al., 2005a) would move it off the S Dor instability strip at quiescence, and its observed variation in temperature would be too large to be consistent with traditional expectations for LBVs. For now, 3.2 (0.4) kpc is our preferred distance to W243 because it is more precise, although formally, it is fully consistent with the individual DR2 value we find between 0.83 and 4.15 kpc. AlthoughGaia DR2 data are not consistent with a large distance of 4.5 or 5 kpc that is often adopted in the literature, the new DR value is consistent with the original claimed distance of 2 kpc d 5.5 kpc (Clark et al., 2005a).
The case of W243 illustrates the utility in having an independent estimate of the distance based on the parallax for many associated cluster members, especially in individual cases where high prohibits a reliable individual parallax. Unfortunately, however, it appears that many LBVs simply do not reside in obvious clusters Smith & Tombleson (2015). There are some LBVs with possible host clusters that have been noted, such as Wra 751. Even though Wra 751 appears to be overluminous for this cluster, it may help to more tightly constrain the distance and true age and initial mass of this object. Another possible case to investigate is Sco. HD 168625 and HD 168607 may be associated with Ser OB1, as noted earlier, but these already have quite good Gaia DR2 distances (with =0.0).
4 DISCUSSION
About half of the LBVs and LBV candidates included in Gaia DR2 have literature distances that are within the 68% HDI. These are the LBVs HR Car, Wra 751, P Cygni, MWC930, MN48, and G24.73+0.69, and the LBV candidates Hen 3-519, Sher 25, SBW1, Sco, WRAY 17-96, G79.29+0.46, and CYG OB2 #12. While the uncertainty overlaps with literature estimates, the value for the distance from Gaia DR2 is lower in most of these cases.
Two LBV candidates have had their distances and luminosities increase significantly as a result of DR2. MWC314 has a significantly increased distance that makes its luminosity comparable to that of Carinae. HD 316285 also has a significantly increased distance, raising its luminosity above 106 L⊙.
For almost all the objects where the Gaia DR2 distance is significantly revised, however, we find that the objects have moved closer and their luminosity is lower than traditionally assumed. This reduction applies to 10 objects, including both confirmed and candidate LBVs. Of the five confirmed LBVs that have moved significantly closer (AG Car, W243, HD 160529, WS1, and HD 168607), only W243 and WS1 have large excess noise. As we noted, however, if we adopt the new Gaia DR2 parallax for the host cluster Wd1 as the distance to W243 (Aghakhanloo et al., 2019), then this object is also confidently closer and less luminous, but with a much smaller uncertainty. Five of the LBV candidates are moved to a significantly closer distance and lower luminosity, although one of them (AS314) has such a small distance and low luminosity that it is probably not related to LBVs). Overall, with a few getting brighter, many not changing significantly, and 10 shifting to significantly closer distances and lower luminosities, the net effect is a widening and an overall downward shift of the observed luminosity range for Galactic LBVs. This broad conclusion is true whether or not we include sources with excess astrometric noise. Obviously the situation is expected to improve with DR3, but that is several years in the future, and it is worthwhile to consider the implications for LBVs now.
4.1 Luminosity range and the S Dor strip
With a larger spread in LBV luminosity range that now extends to lower luminosity than previously assumed, there are two divergent ways to interpret the result. One option is simply that these lower-luminosity stars were mistakenly classified as LBVs. The other view is that the original definition of the S Doradus strip, based on only a few objects, might have been too narrow; it might therefore fail to capture the diverse range of real physical variability and mass loss exhibited by luminous, blue, and irregularly variable stars. Which of these two options is chosen might have important implications for understanding the range of initial masses that yield LBVs and the physical mechanism(s) governing their instability and mass loss. Both options have some subjectivity.
Following the first option, we might decide to strip these lower-luminosity stars of their LBV or LBV candidate status, demoting them to “normal” blue supergiants or B[e] supergiants and thus preserving the S Doradus instability strip. This demotion may be valid for some objects, where the main motivation for including them as LBV candidates in the first place was their high luminosity (like AS 314). However, it is less appealing to simply discount the lower-luminosity candidates with dusty shell nebulae, because these nebulae indicate substantial episodes of previous mass loss that are relatively rare among blue supergiants. It is also not so easy to discount lower luminosity stars that have strong emission-line spectra that resemble their very luminous cousins, since these emission-line spectra indicate strong current mass loss. Moreover, it is not so easy to “unconfirm” Wra 751 or the lower-luminosity objects that have been confirmed as LBVs based on their variability (HD 168607, W243, and WS1). If these are not lower-luminosity LBVs, then what type of blue irregular variable are they?
We note that previous efforts to classify a star as an “LBV”, “LBV candidate”, or “neither” (not to mention various subtypes like classical S Doradus stars, SN impostors, ex-dormant, weak active, P Cygni stars, etc.) have been somewhat arbitrary and inconsistent among authors (Conti, 1984; Humphreys & Davidson, 1994; van Genderen, 2001; Smith et al., 2004; Clark et al., 2005a). This reflects the fact that LBVs are rare stars and that each one has some unique peculiarities. To classify them in a group or subgroups requires one to make choices about which observed properties to emphasize in a definition. The original definition of an LBV by Conti (1984) was a hodgepodge of many different types of massive and variable hot stars – basically “not Wolf-Rayet stars” and “not red supergiants” (in fact, Conti used the term “other”) – including the Hubble-Sandage variables, S Doradus variables, Car-like variables, P Cygni stars, etc. The motivation was that all these stars may play a similar transitional role in evolution once O-type stars leave the main sequence, and it is potentially useful to discuss them together. It is also a convenient oversimplification for the purpose of discussion. As study of these stars intensified, some observers, guided by stellar evolution models for single stars, favored a more precise definition of what is an LBV so that only very few objects were included (Wolf, 1989; Humphreys & Davidson, 1994), whereas others chose to proliferate LBV subtypes to accommodate some of the diversity in observed characteristics (van Genderen, 2001). Some objects were included as LBVs or LBV candidates based on much more limited information than for the classical LBVs, as in the cases of the Galactic Center sources. In light of the fact that we still do not understand the physical mechanism that drives LBV variability or their place in evolution, it may be wise to lean toward being inclusive with respect to this diversity. Regardless of the name we choose to give them, revised distances and luminosities from Gaia DR2 seem to indicate that blue supergiants at lower luminosity than previously thought can also suffer episodes of mass ejection, variability, instability, and strong winds that could be similar to traditional expectations for LBVs.
A few objects are also found to be off the S Dor instability strip, but above it. These include Car (this has been known for a long time), MWC 314, HDE 316285, and HD 80077. The Pistol Star and FMM 362 were also known to be well above the S Dor instability strip, similar to Car. Demoting the lower-luminosity stars from the class of LBVs would not change the fact that these more luminous stars are also off the S Doradus instability strip, again arguing that its definition may have been too narrow in the past.
Whether or not revised luminosities land a star on the S Dor instability strip depends, of course, on exactly where we choose to put that instability strip. Since the defining S Doradus variables, AG Car and HR Car, have slightly revised distances, perhaps the location of the S Dor strip needs to be adjusted as compared to the original position (Wolf, 1989). As noted earlier, Groh et al. (2009b) presented a revised S Dor strip defined by detailed modeling of physical parameters for AG Car and HR Car in their hot quiescent states (which we have slightly adjusted in Figure 4 based on their new Gaia DR2 distances). If this placement of the S Dor instability strip is adopted, then Car and MWC 314 fit nicely along an extension of its slope, as do P Cygni and HD 168625. This steeper slope also encompasses the general locations of B[e] supergiants and many LBV candidates. However, with that steeper slope, many other LBVs are then left far off the S Dor strip, including most of the known extragalactic LBVs, as well as W243, HD 160529, HD 168607, and G24.73+0.69. Wra 751 is far off the S Dor strip no matter what.
It seems difficult to escape the conclusion that the S Dor instability strip must be broader and must extend over a wider luminosity range than previously appreciated. How shall we interpret this? One possible option is that the LBV instability does indeed occupy a wider spread of luminosity and than the narrow strip originally defined by Wolf (1989) or the revised version proposed by Groh et al. (2009b). When one examines Figure 2, where no extragalactic LBVs are plotted and where we show no S Dor strip to guide the eye, it is not obvious that LBVs reside along any strip at all.
Figures 2, 3, and 4 give the impression that the zone of instability for LBVs and related objects might include everything redward of the terminal age the main sequence, over to about 8000 K, spreading both above and below the S Dor strip (objects that are luminous and variable but cooler than 8000 K are not called LBVs because they are yellow or red). In other words, one might simply extend the locus of normal BSGs and B[e] supergiants upward to include the classical LBVs as well. This zone encompasses LBVs and LBV candidates, but also includes many blue supergiants that are not highly variable and do not have significant circumstellar material. In this view, perhaps the classical LBVs are just the most extreme end of a continuum of diverse variability and mass loss.
Whether or not a star in this zone is an LBV may depend on its evolutionary history, as well as our choice for the threshold of variability needed to call that star an LBV. Some LBVs could conceivably be on a post-RSG blue loop, where previous strong mass loss as a RSG has increased their L/M ratio, making them more unstable. This may work for the stars in the 30-40 initial mass range (Humphreys & Davidson, 1994; Smith et al., 2004), but at lower luminosities, stars remain far from the classical Eddington limit. The other viable option is that some stars arrive in this zone through single-star evolution whereas others arrive there as a product of binary interaction, or that they have different rotation rates. Mass accretion and spin up through binary mass transfer or stellar mergers may provide a means for only some selected stars in this zone to experience peculiar and episodic mass loss, anomolous enrichment, rapid rotation, and instability (Kenyon & Gallagher, 1985; Gallagher, 1989; Justham et al., 2014; Smith & Tombleson, 2015; Smith, 2016; Aghakhanloo et al., 2017). There is no clear reason why such effects would be limited to a narrow zone coincident with the S Dor instability strip, so in a binary context, the wider spread of luminosity would not be surprising.
4.2 Lower luminosity LBVs
Gaia DR2 reveals a handful of LBVs and candidate LBVs that reside at lower luminosities than previously realized, well below log(/)=5.3 where the nominal S Doradus instability strip joins the constant temperature outburst temperature of LBVs. Why have analogs of these lower-luminosity LBVs not been found in the LMC/SMC or M31/M33 (the purple sources in Figure 4)? This might easily be a selection effect since it is harder to detect subtle variability in fainter stars, especially if one is interested in the most luminous stars. Alternatively, “LBV-or-not” classifications in these galaxies may have been biased to high luminosities (the brightest objects are deemed LBVs, while fainter blue stars with variability may have been ignored or called something else). There may also be a real physical effect: perhaps whatever mechanism is responsible for the LBV instability (such as Fe opacity; e.g., Gräfener et al. 2012; Jiang et al. 2018) can be triggered at different luminosities in a higher-metallicity environment or at different rotation rates. Deciding between these options is difficult, and a renewed and unbiased effort to characterize variable stars in these nearby galaxies may be warranted. This is an area where the Large Synoptic Survey Telescope may provide a significant advance. We note that recently, such a study has been undertaken for M51 by Conroy et al. (2018). Using multi-epoch HST data, they found a continuum of variability over a wide luminosity range for luminous stars, where the observed diversity of variability among luminous blue stars was considerably broader than the narrow definition of traditional S Dor variables.
The possible existence of LBV-like instability at lower initial mass and lower luminosity than previously recognized has at least three broader implications.
1. Physical cause of LBV instability: The traditional interpretation for the cause of normal S Dor instability has been that these stars are unstable because of their proximity to an opacity-modified Eddington limit (Lamers & Fitzpatrick, 1988; Ulmer & Fitzpatrick, 1998). Single-star models suggest that a star of 60 , for example, will develop a progressively more LBV-like spectrum and instability as it approaches the Eddington limit in its mass-loss evolution (Groh et al., 2014; Jiang et al., 2018). This may work for the most luminous LBVs, but it may not work so well for the lower-luminosity examples in the 30-40 initial mass range. As noted above, these might plausibly reach a similar instability if one invokes rather severe previous RSG mass loss, so that they are now in a post-RSG phase (Humphreys & Davidson, 1994; Smith et al., 2004; Groh et al., 2013, 2014). Gaia DR2 distances now suggest that there are LBV-like stars at even lower luminosities (in the 10-30 initial mass range). At such low luminosities, this near-Eddington instability doesn’t work because their previous RSG mass loss is not strong enough, and their luminosities are not high enough (Beasor & Davies, 2018). We must either conclude that they have a separate instability mechanism unrelated to the Eddington limit, or that perhaps some other instability governs all the LBVs. As noted above, post-merger or post-mass transfer evolution may populate the whole relevant range of luminosities with massive blue stragglers. This may be an important clue.
2. Relation to low-luminosity SN impostor progenitors like SN 2008S: The possible existence of LBVs that push to lower luminosities and initial masses than previously thought may have interesting implications for a subset of SN impostors similar to the well-studied object SN 2008S. SN impostors were generally thought to be related to giant eruptions of LBVs (Humphreys et al., 1999; Van Dyk, 2005, 2006; Van Dyk & Matheson, 2012; Smith et al., 2011). However, a few transients in the past decade, highlighted by the prototypes SN 2008S and NGC 300-OT (Prieto, 2008; Prieto et al., 2008; Bond et al., 2009), had dust-obscured progenitors. These had lower inferred luminosities and lower initial masses than traditional LBVs, so these have been suggested to be transients that arise from super-AGB stars with initial masses around 8-10 , including electron capture SNe (Thompson et al., 2009; Boticella et al., 2009). However, if LBVs actually extend to lower luminosity, then they might also be dust-enshrouded LBV-like supergiants that reside at somewhat lower luminosity than previously recognized (Smith et al., 2009; Berger et al., 2009; Bond et al., 2009). For NGC 300-OT, the surrounding stellar population points to an age appropriate to an initial mass of 12-25 (Gogarten et al., 2009), inconsistent with an electron capture SN (8-10 ) or a transient associated with an even lower-mass star. This would, however, be consistent with the implied initial masses for the lower-luminosity Galactic LBVs like W243, and HD 168607 found here. Perhaps these lower-luminosity Galactic LBVs are likely progenitors for some of these SN 2008S-like events, or products of them if they are merger events. The spectra for many of these objects look quite similar at various points in their evolution, including objects that have been suggested to be stellar mergers (Smith et al., 2011, 2016a). On the other hand, the SN impostors may be a mixed-bag across a wide mass range, since some, like SN 2008S itself and SN 2002bu, have surrounding star formation histories that translate to ages appropriate for initial masses less than 8 (Williams et al., 2018).
3. SN progenitors with pre-SN mass loss: The group of lower-luminosity Galactic LBVs and LBV candidates have interesting potential implications for some types of SN progenitors. First, we have noted that several LBV-like stars seem to be quite close to the location of SN 1987A’s progenitor on the HR diagram, and few of these even have similar ring nebulae. This adds to speculation that some sort of LBV-like instability and mass loss could have played a role in forming the nebula around SN 1987A (Smith, 2007). Previously, it was thought that the lower bound of LBV luminosities did not extend low enough to include SN 1987A, but Gaia DR2 shows that it reaches even lower. Second, there has been much discussion about LBVs as possible progenitors of Type IIn supernovae (SNe IIn), because their dense circumstellar material (CSM) seems to require some sort of eruptive pre-SN mass loss akin to LBV eruptions (see review by Smith 2014 and references therein). In seeming contradiction, host galaxy environments surrounding SNe IIn (and also SN impostors) do not favor very high mass stars in very young regions (Anderson & James, 2008; Anderson et al., 2012; Habergham et al., 2014)
Even the special case of SN 2009ip, with a very luminous and eruptive LBV-like progenitor, is out in the middle of nowhere, with no sign of recent star formation (Smith et al., 2016b). If the LBV phenomenon extends to much lower masses than previously thought, then perhaps SNe IIn can arise from LBV-like progenitors over a wide range of initial masses that even overlaps with progenitors of normal SNe II-P. The lower-luminosity LBVs in Figure 4 overlap with single-star evolutionary tracks as low as 10-20 . If they are the results of mass gainers or mergers in binary systems, then their true initial masses may extend even lower, and their lifetimes may potentially be quite long (Smith & Tombleson, 2015; Smith, 2016; Aghakhanloo et al., 2017). Such LBV-like progenitors of SNe IIn originating from this lower-mass range might vastly outlive any main-sequence O-type stars that could ionize surrounding gas, possibly explaining the lack of correlation between SN IIn locations and H emission (Anderson & James, 2008; Anderson et al., 2012; Habergham et al., 2014).
This last point seems to be in general agreement with the relative isolation of LBVs on the sky as compared to O-type stars (Smith & Tombleson, 2015). Moreover, some of the firmer distance estimates for Galactic LBVs reported here have implications for the isolation of LBVs and implications for their evolutionary origin in binary systems (Smith & Tombleson, 2015; Smith, 2016; Aghakhanloo et al., 2017).
4.3 LBVs and clusters
Among confirmed unobscured LBVs that are found in young massive clusters, now only Car remains as a confident association, although its luminosity is so high that it is consistent with being a blue straggler as compared to the surrounding stars in Tr 16. The earliest-type main sequence star in Tr16 is O3.5 V with an implied initial mass of around 60 , whereas Car has an equivalent single-star initial mass of around 200 or more. Indeed, there are a number of other clues, such as light echoes from the Great Eruption, that Car’s present state is inconsistent with single-star evolution and might instead be the result of a stellar merger event (Smith et al., 2018a, b). Although W243 is probably in the cluster Wd1, the revised nearer distance to Wd1 from Gaia DR2 (Aghakhanloo et al., 2019) means that the cluster is not as young and massive as previously thought. Wra 751’s distance makes it marginally consistent with its presumed host cluster (Pasquali et al., 2006), but this is not a young massive cluster either, and this is actually a problem for the single-star scenario. This is because Wra 751 has a luminosity indicating an effective single-star initial mass that is more than 2 times higher than the turnoff mass inferred from the late O-type stars still on the main sequence in that same cluster. AG Car and Hen 3-519 are at a large distance, but this means that they are not at the same distance as O-type stars that appear near them on the sky in the Car OB association, which is at around 2 kpc (Smith & Stassun, 2017). This makes their apparent isolation even worse, and the discrepancy is exacerbated by the fact that the higher distance also gives them a higher luminosity and shorter lifetime. It is remarkable that AG Car has a luminosity consistent with an initial mass of around 80 , but it is not known to be associated with any O-type stars at a similar distance. More detailed investigations of any possible birth populations associated with LBVs could be illuminating.
Of course, there are a few luminous LBVs and candidate LBVs known in highly obscured massive clusters, such as the clusters in the Galactic Center. However, their significance is difficult to judge, and their implications for LBV evolution are unclear, since these were discovered as LBV-like stars based on studies of the clusters and are therefore a heavily biased sample. As noted by Smith & Tombleson (2015), there is no available census of visually-obscured LBVs in the field or a census of highly obscured O-star populations around them that can be used to infer what fraction obscured LBVs in the Galactic plane avoid clusters.
Acknowledgements
We thank an anonymous referee for a careful reading of the manuscript and helpful comments. Support for NS was provided by NSF award AST-1515559, and by the National Aeronautics and Space Administration (NASA) through HST grant AR-14316 from the Space Telescope Science Institute, which is operated by AURA, Inc., under NASA contract NAS5-26555. Support for MA and JWM was provided by the National Science Foundation under Grant No. 1313036. Support for this work was provided to MRD by NASA through Hubble Fellowship grant NSG-HF2-51373 awarded by the Space Telescope Science Institute, which is operated by the Association of Universities for Research in Astronomy, Inc., for NASA, under contract NAS5-26555. MRD acknowledges support from the Dunlap Institute at the University of Toronto. JHG acknowledges support from the Irish Research Council New Foundations Award 206086.14414 “Physics of Supernovae and Stars”.
This work has made use of data from the European Space Agency (ESA) mission Gaia (\urlhttps://www.cosmos.esa.int/gaia), processed by the Gaia Data Processing and Analysis Consortium (DPAC, \urlhttps://www.cosmos.esa.int/web/gaia/dpac/consortium). Funding for the DPAC has been provided by national institutions, in particular the institutions participating in the Gaia Multilateral Agreement.
References
- Aghakhanloo et al. (2017) Aghakhanloo M, Murphy J, Smith N, Hlozek R. 2017, MNRAS, 472, 591
- Aghakhanloo et al. (2019) Aghakhanloo M, Murphy J, Smith N, Parejko J, Drout MR, Groh JH, Stassun KG, Diaz-Rodriguez M. 2019, MNRAS, submitted (arXiv:1901.06582)
- Anderson & James (2008) Anderson J, James PA. 2008, MNRAS, 390, 1527
- Anderson et al. (2012) Anderson J, et al. 2012, MNRAS, 424, 1372
- Arnett (1989) Arnett W. D., 1989, ApJ, 343, 834
- Astraatmadja & Bailer-Jones (2016) Astraatmadja, T. L., & Bailer-Jones, C. A. L. 2016, ApJ, 833, 119
- Bailer-Jones et al. (2018) Bailer-Jones CAL, Rybizki J, Fouesneau M, Mantelet G, Andrae R. 2018, preprint, arXiv:18-4:10121
- Barbosa et al. (2008) Barbosa C. L., Blum R. D., Conti P. S., Damineli A., Figuerêdo E., 2008, ApJ, 678, L55
- Baume et al. (1999) Baume G., Vázquez R. A., Feinstein A., 1999, Astronomy and Astrophysics Supplement Series, 137, 233
- Beasor & Davies (2018) Beasor E, Davies B. 2018, MNRAS, 475, 55
- Berger et al. (2009) Berger, E., et al. 2009, ApJ, 699, 1850
- Berlanas et al. (2019) Berlanas et al. 2019, MNRAS, 484, 1838
- Bond et al. (2009) Bond, H., et al. 2009, ApJ, 695, L154
- Boticella et al. (2009) Botticella, M. T., et al. 2009, MNRAS, 398, 1041
- Brandner et al. (2008) Brandner W., Clark J. S., Stolte A., Waters R., Negueruela I., Goodwin S. P., 2008, A&A, 478, 137
- Brott et al. (2011) Brott, I., Evans, C. J., Hunter, I., et al. 2011, A&A, 530, A115
- Brown et al. (2018) Brown AGA, et al. (Gaia Collaboration), 2018, preprint (arXiv:1804.09365)
- Chentsov (1980) Chentsov EL. 1980, Soviet Ast. Lett, 6, 199
- Chentsov & Luud (1989) Chentsov EL, Luud L. 1989, Ap., 31, 415
- Chentsov & Gorda (2004) Chentsov EL, Gorda ES. 2004, Ast. Lett, 30, 461
- Chini et al. (1980) Chini R., Elsaesser H., Neckel T., 1980, A&A, 91, 186
- Clark & Negueruela (2004) Clark JS, Negueruela I. 2004, A&A, 413, L15
- Clark et al. (2003) Clark J. S., Egan M. P., Crowther P. A., Mizuno D. R., Larionov V. M., Arkharov A., 2003, A&A, 412, 185
- Clark et al. (2005a) Clark JS, Larioniv VM, Arkharov A. 2005a, A&A, 435, 239
- Clark et al. (2005b) Clark JS, Negueruela I, Crowther PA, Goodwin SP. 2005b, A&A, 434, 949
- Clark et al. (2009) Clark J. S., Davies B., Najarro F., MacKenty J., Crowther P. A., Messineo M., Thompson M. A., 2009, A&A, 504, 429
- Clark et al. (2012) Clark JS, Najarro F, Negueruela I, et al. 2012, A&A, 541, A145
- Conroy et al. (2018) Conroy C, et al. 2018, ApJ, 864, 111
- Conti (1984) Conti PS. 1984. IAUS, 105: 233
- Crowther et al. (2006a) Crowther PA, Hadfield LJ, Clark JS, Negueruela I, Vacca WD. 2006a, MNRAS, 372, 1407
- Crowther et al. (2006b) Crowther P. A., Lennon D. J., Walborn N. R., 2006b, A&A, 446, 279
- Davidson et al. (1993) Davidson K., Humphreys R. M., Hajian A., Terzian Y., 1993, ApJ, 411, 336
- de Jager (1998) de Hager C. 1998, Astron. AStoph. Rev., 8, 145
- de Pree et al. (1999) de Pree C. G., Nysewander M. C., Goss W. M., 1999, AJ, 117, 2902
- Egan et al. (2002) Egan MP, Clark JS, Mizuno DR, Carey SJ, Steel IA, Price SD. 2002, ApJ, 572, 288
- Figuerêdo et al. (2008) Figuerêdo E., Blum R. D., Damineli A., Conti P. S., Barbosa C. L., 2008, AJ, 136, 221
- Gaia Collaboration (2016) Gaia Collaboration et al. 2016, A&A, 595, A1
- Gaia Collaboration (2018) Gaia Collaboration et al. 2018, A&A, 616, A1
- Gallagher (1989) Gallagher, J.S. 1989, in Physics of Luminous Blue Variables, ed. K. Davidson, A.F.J. Moffat, & H.J.G.L.M. Lamers (Dordrect: Kluwer), 185
- Geballe et al. (2000) Geballe TR, Najarro F, Figer DR. 2000, ApJ, 530, L97
- Gogarten et al. (2009) Gogarten, S., et al. 2009, ApJ, 703, 300
- Gräfener et al. (2012) Gräfener G, Owocki SP, Vink JS. 2012. A&A, 538: A40
- Groh et al. (2006) Groh JH, Hillier DJ, Damineli A. 2006, ApJ, 638, L33
- Groh et al. (2009a) Groh JH, Hillier DJ, Damineli A, et al. 2009a, ApJ, 698, 1698
- Groh et al. (2009b) Groh JH, Hillier DJ, Damineli A, et al. 2009b, ApJ, 705, L25
- Groh et al. (2013) Groh JH, Meynet G, Georgy C, Ekström S. 2013, A&A, 558, A131
- Groh et al. (2014) Groh JH, Meynet G, Ekström S, Georgy C. 2014, A&A, 564, A30
- Gvaramadze et al. (2012) Gvaramadze V. V., 2012, MNRAS, 421, 3325
- Gvaramadze et al. (2015) Gvaramadze V. V., Kniazev A. Y., Berdnikov L. N. 2015, MNRAS, 454, 3710
- Habergham et al. (2014) Habergham S.M., Anderson J. P., James P. A., Lyman J. D., 2014, MNRAS, 441, 2230
- Higgs et al. (1994) Higgs L. A., Wendker H. J., Landecker T. L., 1994, A&A, 291, 295
- Hiller et al. (1998) Hillier DJ, Crowther PA, Najarro F, Fullerton AW. 1998, A&A, 340, 483
- Hillier et al. (2001) Hillier DJ, Davidson K, Ishibashi K, Gull T. 2001, ApJ, 553, 837
- Hoekzema et al. (1992) Hoekzema N. M., Lamers H. J. G. L. M., van Genderen A. M., 1992, A&A, 257, 118
- Hu et al. (1990) Hu J. Y., de Winter D., The P. S., Perez M. R., 1990, A&A, 227, L17
- Humphreys (1978) Humphreys R. M., 1978, ApJs, 38, 309
- Humphreys et al. (1989) Humphreys R. M., Lamers H. J. G. L. M., Hoekzema N., Cassatella A., 1989, A&A, 218, L17
- Humphreys & Davidson (1994) Humphreys RM, Davidson K. 1994, PASP, 106, 1025
- Humphreys et al. (1999) Humphreys RM, Davidson K, Smith N. 1999, PASP, 111, 1124
- Hutsemekers & van Drom (1991) Hutsemekers D., van Drom E., 1991, A&A, 248, 141
- Imai et al. (2002) Imai H., Watanabe T., Omodaka T., Nishio M., Kameya O., Miyaji T., Nakajima J., 2002, Publications of the Astronomical Society of Japan, 54, 741
- Jiang et al. (2018) Jiang, Y.F., Cantiello, M., Bildsten, L., Quataert, E., Blaes, O., Stone, J. 2018, Nature, 561, 498
- Justham et al. (2014) Justham S, Podsiadlowski P, Vink JS. 2014, ApJ, 796, 121
- Kenyon & Gallagher (1985) Kenyon, S.J., & Gallagher, J.S. 1989, ApJ, 290, 542
- Kniazev et al. (2015) Kniazev A. Y., Gvaramadze V. V., Berdnikov L. N., 2015, MNRAS, 449, L60
- Kniazev et al. (2016) Kniazev A. Y., Gvaramadze V. V., Berdnikov L. N., 2016, MNRAS, 459, 3068
- Kozok (1985) Kozok J. R., 1985, Astronomy and Astrophysics Supplement Series, 62, 7
- Lamers & Fitzpatrick (1988) Lamers HJGLM, Fitzpatrick EL. 1988, ApJ, 324, 279
- Lamers & Nugis (2002) Lamers HJGLM, Nugis T. 2002, A&A, 395, L1
- Lamers, et al. (1996) Lamers H. J. G. L. M., et al., 1996, A&A, 315, L229
- Langer & Kudritzki (2014) Langer N, Kudritzki RP. 2014, A&A, 564, A52
- Langer et al. (1999) Langer N, Gacia-Segura, G., Mac Low, M.M. 1999, ApJ, 520, L49
- Lindegren, Lammers, Hobbs, O’Mullane, Bastian & Hernández (2012) Lindegren L., Lammers U., Hobbs D., O’Mullane W., Bastian U., Hernández J., 2012, A&A, 538, A78
- Lindegren, et al. (2018) Lindegren L., et al., 2018, A&A, 616, A2
- Luri et al. (2018) Luri X, et al. 2018, A&A, 616, A9
- Massey & Thompson (1991) Massey P., Thompson A. B., 1991, AJ, 101, 1408
- Massey et al. (2001) Massey P., et al. 2001, AJ, 121, 1050
- McGregor et al. (1988) McGregor P. J., Hyland A. R., Hillier D. J., 1988, ApJ, 324, 1071
- Miroshnichenko et al. (1998) Miroshnichenko A. S., Fremat Y., Houziaux L., Andrillat Y., Chentsov E. L., Klochkova V. G., 1998, Astronomy and Astrophysics Supplement Series, 131, 469
- Miroshnichenko et al. (2000) Miroshnichenko AS, Chentsov EL, Klochkova VG. 2000, A&ASS, 144, 379
- Miroshnichenko et al. (2005) Miroshnichenko A. S., Bjorkman K. S., Grosso M., Levato H., Grankin K. N., Rudy R. J., Lynch D. K., Mazuk S., Puetter R. C., 2005, MNRAS, 364, 335
- Miroshnichenko et al. (2014) Miroshnichenko AS, et al. 2004, Adv. Astr., 2014, 7
- Moffat & Fitzgerald (1977) Moffat A. F. J., Fitzgerald M. P., 1977, A&A, 54, 263
- Morris et al. (2008) Morris PM, et al. 2008, IAU Symp., 250, 361
- Najarro et al. (1997) Najarro, F., Hillier, D. J., Stahl, O. 1997, A&A, 326, 1117
- Najarro et al. (2009) Najarro F, Figer D, Hillier DJ, Geballe TR, Kudritzki RP. 2009, ApJ, 691, 1816
- Naze et al. (2012) Naze Y, Rauw G, Hutsemekers D. 2012, A&A, 538, A47
- Owocki et al. (2004) Owocki SP, et al. 2004, ApJ, 616, 525
- Pandey et al. (2000) Pandey A. K., Ogura K., Sekiguchi K., 2000, Publications of the Astronomical Society of Japan, 52, 847
- Pasquali et al. (2006) Pasquali A, Cameron F, Nota A. 2006, A&A, 448, 589
- Prieto (2008) Prieto, J. 2008, ATel, 1550, 1
- Prieto et al. (2008) Prieto, J., et al. 2008, ApJ, 681, L9
- Richardson et al. (2011) Richardson N, et al. 2011, AJ, 142, 201
- Riess et al. (2018) Riess A. G., et al., 2018, ApJ, 861, 126
- Ritchie et al. (2009) Ritchie B. W., Clark J. S., Negueruela I., Najarro F., 2009, A&A, 507, 1597
- Russeil (2003) Russeil D., 2003, A&A, 397, 133
- Sato et al. (2010) Sato M., Reid M. J., Brunthaler A., Menten K. M., 2010, ApJ, 720, 1055
- Schneps et al. (1981) Schneps M. H., Lane A. P., Downes D., Moran J. M., Genzel R., Reid M. J., 1981, ApJ, 249, 124
- Smartt et al. (2002) Smart SJ, Lennon DJ, Kudritzki RP, Rosales F, Ryans RSI, Wright N. 2002, A&A, 391, 979
- Smith, Crowther & Prinja (1994) Smith L. J., Crowther P. A., Prinja R. K., 1994, A&A, 281, 833
- Smith (2006) Smith N. 2006, Apj, 644, 1151
- Smith (2007) Smith N. 2007, AJ, 133, 1034
- Smith (2014) Smith N. 2014, ARAA, 52, 487
- Smith (2016) Smith N. 2016, MNRAS, 461, 3353
- Smith & Owocki (2006) Smith N, Owocki SP. 2006, ApJ, 645, L45
- Smith & Stassun (2017) Smith N, Stassun KG. 2017, AJ, 153, 125
- Smith & Tombleson (2015) Smith N, Tombleson R. 2015, MNRAS, 447, 602
- Smith et al. (2004) Smith N, Vink JS, de Koter A. 2004, ApJ, 615, 475
- Smith et al. (2007) Smith N, Bally J, Walawender J. 2007, AJ, 134, 846
- Smith et al. (2009) Smith, N., et al. 2009, ApJ, 697, L49
- Smith et al. (2011) Smith N, Li W, Silverman JM, Ganeshalingam M, Filippenko AV. 2011a, MNRAS, 415, 773
- Smith et al. (2013) Smith N, Arnett WD, Bally J, Ginsburg A, Filippenko AV. 2013, MNRAS, 429, 1324
- Smith et al. (2016a) Smith N, Andrews JE, Van Dyk SD, et al. 2016a, MNRAS, 458, 950
- Smith et al. (2016b) Smith N, Andrews JE, Mauerhan JC. 2016b, MNRAS, 463, 2904
- Smith et al. (2017) Smith N, Groh JH, France K, McCray R. 2017, MNRAS, 468, 2333
- Smith et al. (2018a) Smith N, Rest A, Andrews JE, Matheson T, Bianco FB, Prieto JL, James DJ, Smith RC, Strampelli GM, Zenteno A. 2018a, MNRAS, 480, 1457
- Smith et al. (2018b) Smith N, Andrews JE, Rest A, Bianco FB, Prieto JL, Matheson T, James DJ, Smith RC, Strampelli GM, Zenteno A. 2018b, MNRAS, 480, 1466
- Stassun & Torres (2018) Stassun K. G., Torres G., 2018, ApJ, 862, 61
- Steemers & van Genderen (1986) Steemers W. J. G., van Genderen A. M., 1986, A&A, 154, 308
- Sterken et al. (1991) Sterken C., Gosset E., Juttner A., Stahl O., Wolf B., Axer M., 1991, A&A, 247, 383
- Sterken et al. (2008) Sterken C, van Genderen AM, Plummer A, Jones AF. 2008, A&A, 484, 463
- Thompson et al. (2009) Thompson, T. A., Prieto, J. L., Stanek, K. Z., Kistler, M. D., Beacom, J. F., Kochanek, C. S. 2009, ApJ, 705, 1364
- Torres-Dodgen et al. (1991) Torres-Dodgen A. V., Tapia M., Carroll M., 1991, MNRAS, 249, 1
- Ulmer & Fitzpatrick (1998) Ulmer A, Fitzpatrick EL. 1998, ApJ, 504, 200
- van der Veen et al. (1994) van der Veen W. E. C. J., Waters L. B. F. M., Trams N. R., Matthews H. E., 1994, A&A, 285, 551
- Van Dyk (2005) Van Dyk SD. 2005, ASPC, 332, 47
- Van Dyk (2006) Van Dyk SD. 2006, IAU JD, 5, 6
- Van Dyk & Matheson (2012) Van Dyk SD, Matheson T. 2012, ASSL, 384, 249
- van Genderen (2001) van Genderen AM. 2001, A&A, 366, 508
- van Genderen et al. (1991) van Genderen A. M., Robijn F. H. A., van Esch B. P. M., Lamers H. J. G., 1991, A&A, 246, 407
- van Genderen et al. (1992) van Genderen A. M., The P. S., de Winter D., Hollander A., de Jong P. J., van den Bosch F. C., Kolkman O. M., Verheijen M. A. W., 1992, A&A, 258, 316
- Voors et al. (2000) Voors R. H. M., Geballe T. R., Waters L. B. F. M., Najarro F., Lamers H. J. G. L. M., 2000, A&A, 362, 236
- Williams et al. (2018) Williams B, Hillis TJ, Murphy JW, Gilbert K, Dalcanton JJ, Dolphin AE. 2018, preprint (arXiv:1803.08112)
- Wolf (1989) Wolf B. 1989, A&A, 217, 87
- Xu et al. (2009) Xu Y., Reid M. J., Menten K. M., Brunthaler A., Zheng X. W., Moscadelli L., 2009, ApJ, 693, 413
- Zinn, Pinsonneault, Huber & Stello (2018) Zinn J. C., Pinsonneault M. H., Huber D., Stello D., 2018, ArXiv e-prints, arXiv:1805.02650