Quantifying the Sensitivity of HIV-1 Viral Entry to Receptor and Coreceptor Expression
Abstract
Infection by many viruses begins with fusion of viral and cellular lipid membranes, followed by entry of viral contents into the target cell and ultimately, after many biochemical steps, integration of viral DNA into that of the host cell. The early steps of membrane fusion and viral capsid entry are mediated by adsorption to the cell surface, and receptor and coreceptor binding. HIV-1 specifically targets CD4+ helper T-cells of the human immune system and binds to the receptor CD4 and coreceptor CCR5 before fusion is initiated. Previous experiments have been performed using a cell line (293-Affinofile) in which the expression of CD4 and CCR5 concentration were independently controlled. After exposure to HIV-1 of various strains, the resulting infectivity was measured through the fraction of infected cells. To design and evaluate the effectiveness of drug therapies that target the inhibition of the entry processes, an accurate functional relationship between the CD4/CCR5 concentrations and infectivity is desired in order to more quantitatively analyze experimental data. We propose three kinetic models describing the possible mechanistic processes involved in HIV entry and fit their predictions to infectivity measurements, contrasting and comparing different outcomes. Our approach allows interpretation of the clustering of infectivity of different strains of HIV-1 in the space of mechanistic kinetic parameters. Our model fitting also allows inference of nontrivial stoichiometries of receptor and coreceptor binding and provides a framework through which to quantitatively investigate the effectiveness of fusion inhibitors and neutralizing antibodies.
I Introduction
Despite their great adaptability and capacity to survive in many different environments, viruses are not equipped with the necessary biochemical materials, structures, or metabolic resources to self replicate Wilen et al. (2012); Roche et al. (2015); Lodish et al. (2004); Boulant et al. (2015); Stalmeijer et al. (2004); Chou (2007); Nowak and Chou (2009); Chou and D’Orsogna (2007). In order for a virus strain to survive, it must find and bind to a host cell membrane, inject its virion contents (RNA, reverse transcriptase, proteins) into the cytosol of the host cell through membrane fusion or endocytosis, help facilitate the processing and transport of such contents to the cell nucleus, and finally integrate its genome into the DNA of the host cell. After these complex series of events, the “hijacked” cell is instructed to produce the virion’s constituent parts that later assemble into new viruses and escape the host cell Lodish et al. (2004); Qian et al. (2009); Wilen et al. (2012); Boulant et al. (2015); Chou (2007); Nowak and Chou (2009).
Therapies developed to combat viral infection involve inhibiting one or several of the above described processes employed by the virus to infect the target cell Qian et al. (2009); Pegu et al. (2014); Osbourn et al. (1998). For example, in the case of the human immunodeficiency virus (HIV), enfuvirtide (T-20) inhibits fusion of the viral membrane with that of the host cell Qiu et al. (2012) while zidovudine, didanosine, and zalcitabine inhibit reverse transcription of RNA into integration-ready DNA Jonckheere et al. (2000). Elvitegravir, dolutegravir, and raltegravir inhibit DNA integration in the nucleus, blocking the insertion of the viral genome into the host DNA Thierry et al. (2015), while darunavir, saquinavir, and fosamprenavir inhibit HIV-1 protease activity which ensures the proper cleavage of viral polypeptide chains Paterson et al. (2000). Fusion inhibitors, the latest class of anti-viral drugs to be developed, are now integrated into overall therapy and have the advantage of inhibiting the virus at the first step of the infection process. In principle, the employment of fusion inhibitors can reduce the need for intracellularly targeted therapies which often result in additional side-effects, require higher drug concentrations, and involve more complicated pharmacokinetics Qiu et al. (2012).
In order to design and assess the effectiveness of viral entry inhibitor treatments, a quantitative description of the viral entry process is necessary Moore and Doms (2003); Platt et al. (2005). Since a complete biological picture is still elusive, mathematical models that include relevant mechanisms such as surface receptor binding, dissociation, viral degradation, and viral fusion can allow us to explore several aspects of the viral entry process, such as the influence of multiplicity of infection and stoichiometry of receptor/coreceptor binding. Once appropriate models are derived, a statistical inference can be performed using data from experimental measurements of viral entry to validate assumptions and to obtain constraints on the model rate parameters.
HIV-1 is an enveloped virus that follows a receptor-coreceptor binding paradigm Wilen et al. (2012); Lodish et al. (2004); Platt et al. (2014); Nowak and Chou (2009). It has evolved to target helper T-cells of the human immune system. Helper T-cells express the membrane surface receptor CD4 which normally functions as a coreceptor to the T-cell receptor (TCR) complex. Both the TCR and CD4 bind to the MHC class II protein complex of antigen-presenting cells (APC) prior to the initiation of cytokine release, activation of cytotoxic T-cells and antibody producing B-cells, and other secondary immune response processes Lodish et al. (2004).
HIV-1 binds to CD4 with its glycoprotein spike, Env, upon contact with the cell surface of the helper T-cell Boulant et al. (2015); Wilen et al. (2012); Platt et al. (2014); Nowak and Chou (2009). Env is formed by a trimer of a pair of glycoprotein subunits: gp120 and gp41. The former subunit contains a CD4 binding domain and five variable chain regions. The complex gp41 anchors gp120 to the viral membrane via a non-covalent bond and is central to the fusion process of infection Manca et al. (1993); White et al. (2008). After binding to CD4, gp120 goes through a conformational change that exposes an occluded binding domain that binds to a cell surface coreceptor. Though many coreceptors have been identified and are used differentially depending on the HIV-1 strain, the two that are by far the most prevalent are CCR5 and CXCR4 Wilen et al. (2012); Xiao et al. (1999). HIV-1 that bind CCR5 are called R5 strains and are the most common variant involved in transmission of the virus between individuals while the strains that bind CXCR4, R5X4, normally manifest later in the disease, possibly due to the depletion of CCR5 expressing T-cells Stalmeijer et al. (2004). For the rest of this study we will focus only on the R5 strain of HIV-1 and consider CCR5 as the main coreceptor. After the Env complex has bound to CCR5, it undergoes a further conformational change that exposes gp41 which extends and penetrates the host cell membrane Wilen et al. (2012); White et al. (2008), bringing the cellular and viral membranes to close proximity and allowing them to fuse. After successful viral entry, the capsid coat dissolves and HIV-1 RNA is reverse transcribed to DNA, transported into the nucleus, and finally integrated into the host DNA. The cell will now produce the constituent parts needed to assemble more HIV-1 virions.
Since binding of surface receptor CD4 and coreceptor CCR5 are fundamental steps in viral entry, we expect the infectivity of most strains of HIV-1 to be particularly responsive to the cell surface density of those receptors. This response has been investigated using the 293-Affinofile cell line system Chikere et al. (2013); Johnston et al. (2009). Affinofile cells are a CD4/CCR5 dual-inducible cell line capable of expressing independent combinations of surface expression of CD4 and CCR5 Johnston et al. (2009). CD4 expression is induced with minocycline or doxycycline, protein synthesis inhibitors used in antibiotics, and CCR5 is induced with ponasterone A, an ecdysteroid activity inducer. Once induced, Affinofile cells can be infected with reporter-pseudotyped HIV-1 particles or live virus in a spinoculation protocol where virions are exposed to a layer of plated cells. Infection is then quantified through reported expression or intracellular staining for expression of p24, the capsid protein HIV-1 uses to form a protein coat Mascola et al. (2002); Johnston et al. (2009); Webb and Lee (2016). By following this protocol, Johnston et al. Johnston et al. (2009) measured the infectivity of a number of HIV-1 strains on cells that expressed a matrix of varying levels of CD4 and CCR5. Once the levels of p24 are measured, viral infectivity can be directly related to the associated CD4 and CCR5 concentrations used.
In their analysis, Johnston et al. Chikere et al. (2013) argued that viral infectivity as functions of CD4 and CCR5 concentrations, [CD4] and [CCR5] respectively, could be qualitatively fit to a quadratic polynomial function
| (1) |
representing the amount of viral particle entry measured through the percentage of cells that are p24+. The independent variables and are rescaled concentrations of CD4 and CCR5, respectively, defined as:
| (2) |
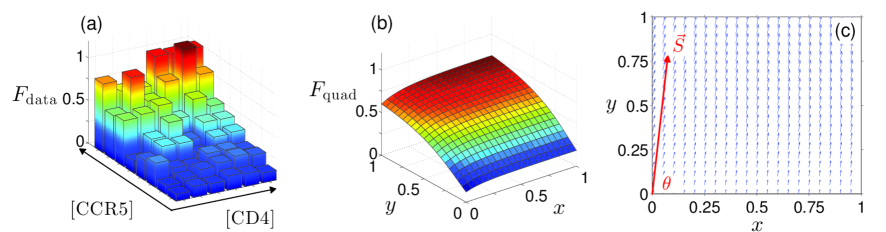
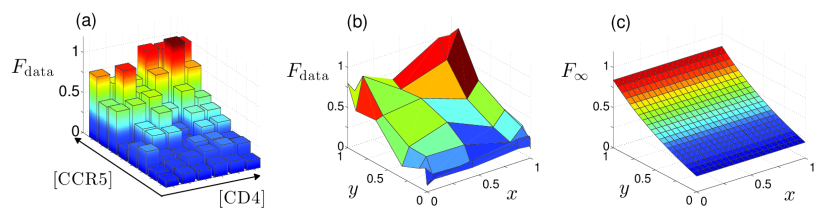
In Eqs. 2, , and , are the minimum and maximum expression levels of receptor and coreceptor, respectively, used in a given measurement. The rescaling in Eqs. 2 restricts and to be between and and is used to compare results obtained from different experiments and/or protocols that may have yielded different absolute ranges of [CD4] and [CCR5]. The parameters ,,,,, and are estimated from fitting to data. Three metrics were derived from : the mean relative infectivity , and the amplitude and angle of the average infectivity gradient, . These were defined as:
| (3) |
characterizes of the overall relative infectivity of a strain of HIV-1, while and quantify how responsive a given strain is to receptor and coreceptor concentrations. For example, a value close to implies and indicates infectivity that is very responsive to CD4 expression levels, while a value close to implies and indicates a high responsiveness to CCR5 levels, as shown in Fig. 1. Johnston et al. Chikere et al. (2013) observed this latter pattern in several virus strains that exhibited apparent unresponsiveness to CD4, even at extremely low CD4 concentrations, leading to the possibility of an effectively “CD4-independent” pathway for viral entry. A complete mechanistic picture of the molecular processes involved however is lacking and the current empirical evidence is insufficient to conclusively argue for a completely CD4-independent entry pathway. Although fitting data to provides a functional relationship between receptor and coreceptor concentrations and viral infectivity, and descriptive parameters characterizing that relationship, the fitted function offers no mechanistic insight into the relevant biochemical processes or their rates. Essentially, the parameters , , and are not directly related to mechanistic parameters involved in viral entry, especially those that could be potentially altered by fusion inhibitors or other therapeutics. Finally, although in previous work different viral strains were tentatively clustered as a function of their receptor and coreceptor usage patterns Chikere et al. (2013); Johnston et al. (2009), a mechanistic model, where kinetic rates carry a biochemical significance, allows us to place greater confidence in the validity of experimentally derived rates, especially if estimates from different viral strains cluster in parameter space.
In this paper, we seek to quantitatively characterize HIV-1 infectivity as a function of cell surface concentrations of CD4 receptor, CCR5 coreceptor, and the associated kinetic rates. We propose three alternative models for receptor/coreceptor engagement and validate them against experimental data derived from the Affinofile cell system and derive estimates for kinetic parameters using maximum likelihood estimation (MLE). Furthermore, we cluster the parameter estimates from experiments derived from the same viral strains to demonstrate confidence in our inference. Lastly, we consider model selection criteria to compare the performance of our proposed models and assess their utility in modeling HIV-1 infection.
II Theory
II.1 Sequential Model
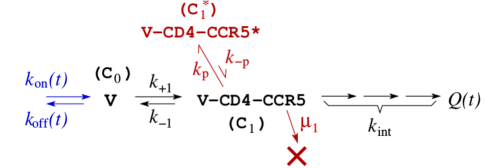
The simplest model of HIV-1 viral entry is based on the assumption that binding of the viral Env protein complex to cell surface receptor CD4 is a necessary precursor step for viral entry Wilen et al. (2012); Boulant et al. (2015); Platt et al. (2014). This binding causes Env to undergo a conformational change that allows further binding to the CCR5 coreceptor, initiating the fusion event. We display this “sequential” binding assumption with rate parameters and pathways in Fig. 2. We denote the concentration [V] (number per host cell area) of membrane-associated HIV-1 virion particles which are not bound to any receptors by , the concentration [V-CD4] of CD4 receptor-bound HIV-1 by , and the concentration [V-CD4-CCR5] of HIV-1 bound to both CD4 and CCR5 by , at a given time . In addition, we include a potential fusion inhibitor and denote by the concentration [V-CD4-CCR5*] of HIV-1 that is bound to CD4 and CCR5 and to an external peptide that impedes fusion, effectively sequestering the cell from further progressing towards infection.
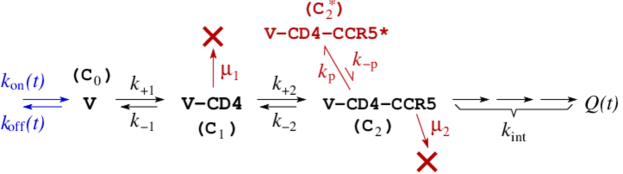
Although there are many intermediate steps during membrane fusion and inside the cytoplasm that ultimately result in viral DNA integration, we subsume these processes into a single step that follows the assembly of the V-CD4-CCR5 complex in the rate parameter . We also assume the adsorption rate, , of free virus onto the cellular surface is time dependent since cell adhesion is high during spinoculation when the HIV-1 viruses are driven close to the cell membrane Chou and D’Orsogna (2007). After spinoculation, the culture medium is replaced to wash away free virus particles. Therefore, for times adsorption of new HIV-1 to the membrane is precluded and we set . Finally, while describes the rate of HIV-1 desorption from the cell membrane, and describe the rate of CD4 or CCR5-bound virus elimination via capsid protein coat degradation, endocytosis, or other abortive events. Using these assumptions, we can mathematically describe the sequence of events leading to infection for as follows:
| (4) | |||||
The above equations represent the concentration flow in and out of the four states the virus can inhabit, V, V-CD4, V-CD4-CCR5, and V-CD4-CCR5*, respectively, as detailed in Fig. 2. For example, the three terms in the first equation, from left to right, describe HIV-1 binding to CD4, HIV-1 desorbing from the cell membrane, and CD4-bound HIV-1 dissociating from CD4 while maintaining cell adhesion. We adopt the simplest assumption that the overall receptor and coreceptor binding rates and are increasing functions of the surface expression of CD4 and CCR5, respectively, and define
| (5) |
where and are the intrinsic binding rates between Env and the respective receptors CD4 and CCR5. The stoichiometry, and , represent, in the infinitely cooperative binding limit, the number of receptors and coreceptors that must bind before fusion can be triggered Weiss (1997); Kuhmann et al. (2000). For example, Env is known to form a trimer of gp120/gp41 complexes, with each subunit containing a CD4 binding domain Wilen et al. (2012); Zolla-Pazner and Cardozo (2010); Platt et al. (2014). If typically two or more of these binding domains are required to be bound to CD4 receptors before the appropriate conformational changes occur, we expect the associated Hill coefficient .
Within our mathematical model, we represent HIV-1 infectivity by
| (6) |
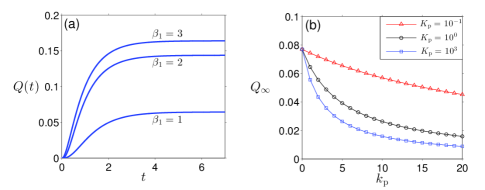
the fraction of initially-adsorbed virus particles that that have undergone fusion by time . represents the cumulative number of successful fusion events from state V-CD4-CCR5. Once the relevant rates are determined, given an initial concentration of adsorbed virus, , and assuming no other bound complexes so that , we can derive from Eqs. II.1 and compare analytical results with the experimental measurements of viral infection on Affinofile cells Webb and Lee (2016); Chikere et al. (2013). The qualitative behavior of for various is shown in Fig. 3(a) assuming a hypothetical case where all rates are set to 1s-1. The plot shows an initial steep increase of viral infectivity immediately after as viruses progress toward receptor and coreceptor binding and fusion. Eventually the initial concentration of HIV-1, , is depleted, at which point flattens out. We expect larger values of to yield larger values of since they allow for stronger binding, while the -independent dissociation and degradation rates stay the same. Since viral infectivity is measured after a sufficiently long exposure time we focus on the long time value . Upon solving Eqs. II.1 and Eq. 6, we find
| (7) |
where
| (8) |
The quantity can be interpreted as the total flow of virus out of the state V-CD4-CCR5 as the individual terms describe, from left to right, the dissociation of CCR5, viral membrane fusion, fusion inhibiting peptide binding, and V-CD4-CCR5 complex degradation. Note that, through the rate parameters and (Eqs. 5), is a function of the concentrations [CD4] and [CCR5].
As evident from Eq. 7, the total infectivity depends on rates of known kinetic processes and initial viral concentrations. Measuring the effects of each of these parameters on is particularly useful in the study and development of drug therapies. For example, if we make the reasonable assumption that the fusion inhibitor peptide binding rate is proportional to the concentration of the peptide in the extracellular environment, we may vary while keeping all other parameters fixed and observe how infectivity changes, as depicted by the dose-response curves in Fig. 3(b). Here, increasing leads to a more pronounced decrease in infectivity at low , while for high values of , changes in are less significant. Thus, our analyses of the model can be used to guide, based on mechanistic principles, the development and administration of entry inhibitor therapeutics.
III Results & Discussion
In order to compare experiments from a number of different HIV-1 strains, cell lines, and laboratory conditions, rescaled expression levels of CD4 and CCR5, and , respectively, are used. Solving Eqs. 2 for [CD4] and [CCR5], we can express the rates and as functions of and . We find and . Furthermore, as in Eq. 7 has units of concentration, so does . To nondimensionalize the expression in Eq. 7 and allow for direct comparisons of results across different experiments, we can normalize by a reference virus concentration. Experimentalists commonly use the raw infectivity value corresponding to the highest concentrations of CD4 and CCR5 as the reference concentration Johnston et al. (2009); Roche et al. (2011). If we define as the experimental infectivity at and , the normalized infectivity becomes
| (9) |
where and are experiment-dependent constants and is a six-dimensional vector of parameters. The dimensionless combination of parameters , , and are defined by
| (10) | ||||
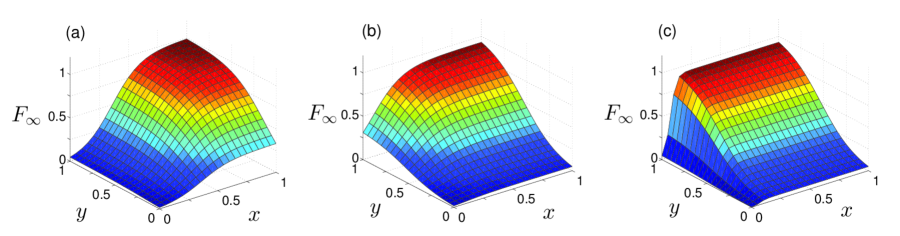
For illustration, in Fig. 4 we plot for three different sets of . In Fig. 4(a), we assume a small value of the dimensionless parameter , while in Fig. 4(b) we assume a small dimensionless parameter . In Fig. 4(c), we set but we assume different stoichiometries and . All values of the chosen parameters are presented in the figure caption. The different sets of parameters yield model infectivity functions with gradients along various directions in the plane, indicating greater sensitivity to [CD4] or [CCR5]. Furthermore, higher values of stoichiometry amplify the sensitivity over a range of concentration values. Therefore, may effectively represent different viral strains with different CD4/CCR5 usage patterns distinguished by values of .
Before fitting to data to find the MLE of , we note that even though is a known constant from the raw infectivity data, some previous data sets do not report its value Johnston et al. (2009); Roche et al. (2011). Therefore this normalization factor is subsumed into the inference of but still can be inferred provided the other parameters forming can be independently determined.
If we wish to fit raw unnormalized infectivities, we can also use the form for directly, but redefine the prefactor as having the same units as the experimental output (such as number of cells, fluorescence, etc.). In this case, the parameter must be rescaled by an experimental factor with units of the experimental output multipled by an area. In either case, we consider the amplitude as a free parameter to be inferred from data fitting. This parameter incorporates, and is confounded by, the initial intensity of exposure, as well as many of the sample-to-sample experimental variability arising from instrument error, host cell number, and area within each sample well. Therefore, we do not expect the effective values of to systematically represent intrinsic kinetic rates. However, we do expect the remaining parameters , and to influence the shape of and the receptor/coreceptor usage patterns. Note that in addition to the intrinsic rate parameters, and also depend on [CD4]min and [CCR5]min which can vary from from one measurement to the next. Therefore, direct comparisons of and can be made only across measurements that use the same and .
We now fit to previously-obtained normalized infectivity by finding the maximum likelihood values for . The appropriate likelihood function is based on the assumption that chemical kinetic rates are typically products of positive random variables representing chemical concentrations and other rates. This, and the need to restrict the infectivity signal to strictly positive values implies that a log-normal distribution for values of is reasonable. The maximum likelihood estimation for then equivalent to minimizing the objective function
| (11) |

where are measured values of normalized infectivity at rescaled concentrations and of CD4 and CCR5 used in the experiments. As a first approximation, we assume and . This last approximation is valid when the CD4 dissociation rate is much smaller than the CD4-bound degradation rate , a chemically reasonable assumption. In our subsequent fits using all parameters , the best-fit value of is indeed near one. Therefore by henceforth setting and , we reduce the number of parameters to be estimated from six to three. The results obtained by fitting the data from several experimental measurements of HIV-1 strains can be found in Table 1.
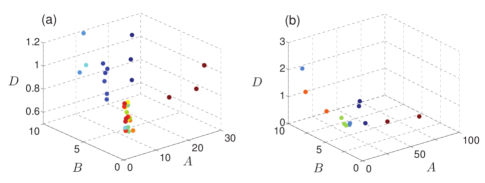
In Fig. 5 we plot the fitted curve of using the estimated parameters from viral strain B5(YA) shown in the fourth line of Table 1, which qualitatively shows good agreement with the corresponding experimental data. Upon repeating the same analysis on 32 experimental data sets selected from previous publications Johnston et al. (2009); Chikere et al. (2013), we can associate each set of infectivities with fitted -- values. As expected, infectivities of the same strain of HIV-1 cluster together in - parameter space as shown in Fig. 6. To indicate the goodness of fit to our model, we also calculate and display in Table 1 the coefficient of determination
| (12) |
where is the measured normalized infectivity averaged over all [CD4] and [CCR5] concentration combinations. The low values suggest that our initial assumption of should be relaxed to obtain better fits.
| Strain-Experiment | ||||
|---|---|---|---|---|
| B5 (YA)-Rep1 | 6.39 | 1.56 | 1.09 | 0.64 |
| B5 (YA)-Rep2 | 6.03 | 1.53 | 1.27 | 0.64 |
| B5 (YA)-Rep3 | 5.91 | 1.34 | 1.49 | 0.66 |
| B5 (RT)-Rep1 | 3.77 | 3.80 | 1.1 | 0.60 |
| B5 (RT)-Rep2 | 4.18 | 4.25 | 1.17 | 0.68 |
| B5 (RT)-Rep3 | 4.58 | 3.87 | 1.13 | 0.64 |
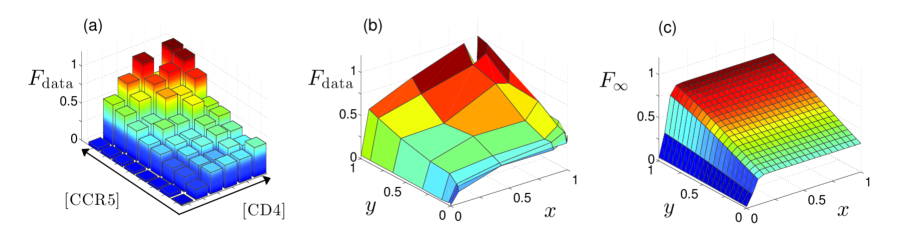
We thus consider the role of stoichiometry of receptor and coreceptor binding by reintroducing and as free parameters and perform maximum likelihood fitting using five parameters , again using the approximation . The fitted function is shown in Fig. 7 which is qualitatively different from Fig. 5.
The new estimated parameters using the same data as before are displayed in Table 2. Here, the residual values are higher, indicating a much better fit of the data when are adjustable. The kinetic model in Eq. 7 consistently outperforms the quadratic model introduced earlier.
| Strain-Experiment | : | : | |||||
|---|---|---|---|---|---|---|---|
| B5 (YA)-Rep1 | 17.04 | 1.84 | 0.96 | 11.7 | 0.79 | 0.95 | 0.96 |
| B5 (YA)-Rep2 | 16.40 | 2.62 | 1.49 | 11.6 | 0.57 | 0.94 | 0.98 |
| B5 (YA)-Rep3 | 14.85 | 2.30 | 1.73 | 10.8 | 0.55 | 0.80 | 0.97 |
| B5 (RT)-Rep1 | 10.67 | 3.15 | 0.79 | 13.9 | 1.29 | 0.79 | 0.90 |
| B5 (RT)-Rep2 | 9.90 | 9.42 | 2.01 | 10.7 | 0.68 | 0.77 | 0.92 |
| B5 (RT)-Rep3 | 12.32 | 3.30 | 0.81 | 12.1 | 1.23 | 0.81 | 0.92 |
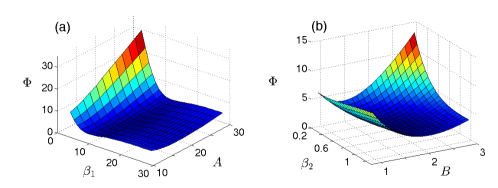
The value of is consistently close to which indicates that coreceptor binding only involves a single CCR5 for fusion to be initiated. The value of , on the other hand, is much larger. If interpreted as a binding stoichiometry, this would indicate that multiple gp120/gp41 complexes of the Env trimer must bind to separate CD4 receptors before conformational changes can take place. Our results, however, show , which indicates that each individual gp120/gp41 complex binds to multiple CD4 receptors. Alternatively, the large exponent can describe high allosteric cooperativity of Env or the dynamics of multiple Env each binding to CD4, increasing the effective rate of CCR5 binding. To quantify our confidence in this result, we take a closer look at the objective function in Eq. 11 and evaluate it for values close to , the optimal value of that minimizes constrained by the data. By varying one of the parameters at this minimum while keeping all others fixed, we can measure the rate of change in with respect to that parameter. In particular, we can determine the sensitivity of the model with respect to a given parameter by evaluating the curvature of , a measure of fit error, along the direction in which that parameter changes, as shown in Fig. 8.
To compare the performance of the quadratic model described by with that of our kinetic model described by both with and as free parameters, we calculate the Akaike Information Criterion (AIC) score
| (13) | |||||
| (14) |
a standard statistical measure for model comparison and selection. In Eq. 14, is the number of inferred parameters in the model and the last two terms are derived from the log-likelihood function of the infectivity distribution. The AIC score penalizes models with large errors in the prediction of each data point and with too many fitted parameters, so a low AIC score is ideal. We observe that the kinetic model with and as free parameters once again outperforms both the models with fixed and the quadratic model, further validating our mechanistically derived model. This implies that the data provides some confidence in a higher stoichiometry .
| Strain- | AIC: | AIC: | AIC: |
|---|---|---|---|
| Experiment | () | (free ,) | |
| B5 (YA)-Rep1 | -19.9 | -7.30 | -22.4 |
| B5 (YA)-Rep2 | -1.80 | 9.20 | -6.0 |
| B5 (YA)-Rep3 | 26.0 | 28.2 | 15.6 |
| B5 (RT)-Rep1 | -31.4 | -25.7 | -39.4 |
| B5 (RT)-Rep2 | -35.5 | -36.0 | -45.2 |
| B5 (RT)-Rep3 | -38.0 | -32.9 | -46.1 |
Once accurate estimates of the model parameters , , , , and are obtained from minimizing , we can derive constraints on the physical rate parameters through Eqs. 10. Although there are more kinetic parameters to solve for than available estimates, we can use known rate values obtained from past ligand binding assays Gibbons et al. (2010); Seisenberger et al. (2001). For example, Chang et al. Chang et al. (2005) set the Env-CD4-CCR5 dissociation rate at . Furthermore, if we assume all degradation rates are equal, we can follow Seisenburger et al. Seisenberger et al. (2001) and use as general viral degradation rates. Furthermore, through GFP genetic marking and flow cytometry, assays can be designed to potentially measure the nonspecifically absorbed virus dissociation rate Dale et al. (2011).
The data shown in Fig. 1 reveals that the entry of the associated viral strain is very insensitive to CD4 levels for the values explored. Using the previous metrics defined in Eqs. 3, the sensitivity vector points almost entirely in the (CCR5) direction. Previous work has also suggested the existence of “CD4-independent” strains that infect at extremely low levels of CD4 Hoffman et al. (1999); Zhuang et al. (2014). However, our sequential model requires binding of CD4 before fusion can occur. In the next section, we explore an alternative and more general “parallel” pathway model that may better fit observed data such as that illustrated in Fig. 1.
III.1 Parallel Model
The quantitative analysis done by Johnston et al. Chikere et al. (2013); Johnston et al. (2009) showed that HIV-1 infectivity of some viral strains had remarkably low responsiveness to the induced surface concentrations of CD4 while still having a relatively monotonic dependence on CCR5 concentrations, as previously shown in Fig. 1. Furthermore, some strains of simian immunodeficiency virus (SIV) are known to infect via “CD4-independent” pathways, requiring only CCR5 coreceptor for viral entry Edinger et al. (1999). Motivated by these observations, we propose a “parallel” pathway model wherein HIV-1 can either enter through the standard pathway described in the sequential model presented in the last section, or can either completely bypass CD4 binding. Within this “parallel” model we propose that HIV-1 can interact with CCR5 directly with rate and form the complex V-CCR5 whose concentration, [V-CCR5], we denote as . As shown in Fig. 9, this state can then directly enter the cell through fusion or endocytosis leading to infection with rate Miyauchi et al. (2009a). For mathematical simplicity, we describe the standard sequential model discussed in the previous subsection via a “lumped” model where the sequential binding of CD4 and CCR5 is described by one effective rate.
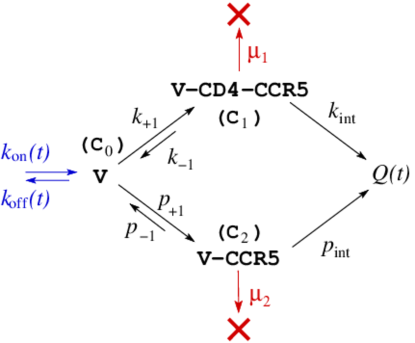
The corresponding rate equations are:
| (15) | |||||
Similar to the sequential model, we expect the binding rates to be functions of the concentrations of CD4 and CCR5: , , where and are the intrinsic binding rates between the virus and the respective receptors and , , and are effective stoichiometries. The total infectivity is now given by
| (16) |
To further simplify matters, we set all degradation rates equal so that . Upon solving Eqs. 15 and 16, and normalizing by the reference concentration from the infectivity data associated with and , we find the normalized infectivity to be
| (17) |
where
| (18) |
and
| (19) |
Note that our simplified parallel model has an additional parameter compared to that of the sequential model. We can now perform maximum likelihood statistical analysis using our parallel pathway model. In Fig. 10 we show the data of the NL43(RT) strain from Johnston et al. Johnston et al. (2009). The fitted surface shows a qualitatively good fit to the data. Not surprisingly, , indicating the independence of CD4 attachment on [CD4].
In this case, the AIC score yields AIC(parallel) = 3.62 and AIC(sequential) = -1.3, suggesting that the parallel pathway model is not statistically warranted even for a highly “CD4-independent” strain. Although there are only seven parallel pathway parameters versus six for the sequential model, the parallel model lumps CD4 and CCR5 binding into a single process which may be too coarse a description. We test this possibility by exploring this lumped version of the sequential model.
III.2 Lumped Model
The sequential model explored above assumes that gp120 binding of CCR5 is contingent on first binding to the CD4 receptor. Separating the two viral states V-CD4 and V-CD4-CCR5, which correspond to virus bound to CD4 and virus bound to both CD4 and CCR5, factors in the binding and dissociation dynamics between these states into the expression for infectivity derived above. If the rate of transitioning between these two states is sufficiently fast, it is possible to further simplify the model by eliminating the intermediate state V-CD4 by assuming that CD4 and CCR5 binding occur simultaneously, as shown in Fig. 11. Upon simplifying the model in this manner, we reduce the parameter space for which we perform statistical inference. In order to explore whether this simplification leads to a better model fit and estimation of physical rate parameters, we start with the rate equations:
| (20) |
Within the the lumped model, we expect the rate of simultaneous CD4 and CCR5 binding to be a function of both the concentrations of CD4 and CCR5: , where and are the appropriate stoichiometry parameters, similar to those defined in the sequential model. Here, the raw infectivity is while the normalized rescaled infectivity takes the form
| (21) |
where
| (22) |
As in the sequential model, the quantity
| (23) |
can be considered the bulk flow of virus out of the V-CD4-CCR5 viral state.
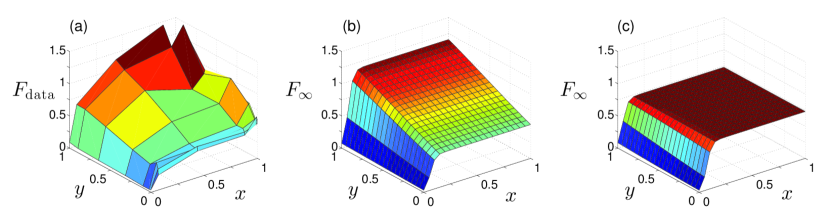
Upon comparing AIC scores of AIC(sequential) = 15.6 and AIC(lumped) = 17.6 from the viral strain B5 (YA) data presented in Johnston et al. Johnston et al. (2009), we find the sequential model yields a better fit to the data, despite the reduction of the number of parameters in the lumped model. Fits are shown in Fig. 12. As in the sequential model, dictates the sharpness of the descent of for very low values of [CD4], but the terms that define the tilt of the broader region of the function are lost in the lumped model, preventing an adequate fit of the average slope of the data. This signifies that the intermediate process of CD4 binding prior to CCR5 binding is a necessary inclusion into the model.
IV Conclusions
In order to distinguish different strains of HIV-1 via their entry kinetics, heuristic metrics have been derived to classify different sensitivities of infection to CD4 and CCR5 expression in the host cell Johnston et al. (2009). The metrics , , and in Eqs. 3 are good discriminators and cluster experimental replicates of identical strains of HIV-1 sufficiently due to the fact that they are purely based on the shape of the data, but not on any mechanistic processes involved in viral entry. Here, we analyzed a sequential kinetic binding model of HIV-1 viral entry that yields a functional relationship between the infectivity of a strain of virus and the levels of CD4 and CCR5 based on known chemical processes. Our model provides a framework in which to analyze different strains of HIV-1 based on combinations of parameters in the kinetic model and physical insight into how these parameters facilitate or inhibit HIV-1 viral entry. One can now distinguish different strains of HIV-1 according to the inferred values of kinetic parameters and display the infectivity of each strain as points in parameter space with physical meaning.
In addition to kinetic rates, stoichiometries of CD4 and CCR5 are incorporated in our model. In fact, the dependencies of the infectivity to CD4 and CCR5 levels are most sensitive to their respective stoichiometries at the expense of the sensitivity of the other estimated parameters. We show that overall infectivity data is sufficient to provide some confidence in assigning nonunit stoichiometries, suggesting that on average either multiple CD4s bind to a gp spike, or multiple gp spikes are engaged in a typical entry event. In fact, due to the high sensitivity of the characteristic shape of the infectivity function to stoichiometry, we suggest that experiments be designed to increase the number of data points in regions of high gradients of , where the stoichiometric parameters exhibit the most influence. In this same regard, choosing the minimum and maximum values for the CD4 and CCR5 experimental inputs dictates the relative sizes of the constants and , thus altering the relative sensitivity between the two stoichiometric parameters. These properties of provide guidance to the experimentalist in designing the most informative measurements.
Finally, in order to address the existence of strains that are highly insensitive to CD4 expression, and that infect cells with extremely low levels of CD4, we proposed a parallel pathway model that allows slow entry, even in the absence of CD4, through, perhaps, an endocytotic mechanism Miyauchi et al. (2009a). Here, binding to CCR5 is sufficient to allow for viral entry through an alternate pathway. We performed parameter inference on this parallel model and compared our results with those from the original sequential model. We also explored a simplification of the sequential model by subsuming the intermediate CD4 binding process into one combined process of simultaneous CD4 and CCR5 binding. We compared the performance of this last lumped model with the sequential model to determine what effects such simplifying assumptions might have on the inference capabilities of our models.
The modeling and data analysis framework we developed in this work may also be used to quantify the effectiveness of fusion inhibitors. For example, though fusion inhibitors can arrest the fusion process at an intermediate step Miyauchi et al. (2009b), the bond between gp120 and gp41 is non-covalent and weak enough so there is a high probability of this bond breaking, resulting in the virus dissociating from the cell Manca et al. (1993). Though the Env spike used in that failed infection attempt is now non-functional, the virus can theoretically return to the cell and make another attempt with a different Env on its membrane. But unlike simian immunodeficiency virus (SIV) that is covered in large amounts of spikes Yang et al. (2000), HIV-1 has relatively small numbers of Env on its surface; often on the order of five spikes per virus Brown (1997). Thus fusion inhibition becomes a process of repeated failed attempts at infection of a virus until the Env spikes are depleted. In this context, two time scales would be established between the rate of fusion without inhibitor and the rate of depletion of glycoprotein spikes. Modeling this aspect of the infectivity process in the presence of fusion inhibitors can give better insight into the effectiveness of inhibitor treatment and recommendations on the duration of possible treatment protocols. As shown in Fig. 3(b), a model of infectivity can be used to predict a reduction in viral infection as a function of fusion inhibitor dosage. Instead of performing infectivity measurements for varying [CD4] and [CCR5], we can also change fusion inhibitor levels and study the corresponding infectivity patterns using the same models presented in this work. Similar analyses can also be performed to study the efficacy of broadly neutralizing antibodies in suppressing viral entry. These and other physical chemical considerations will be pursued in future work involving model analysis and inference from forthcoming data.
V acknowledgement
The authors thank Paul Gorry for sharing some of infectivity data sets presented in this work. BM was supported by the NIH through a T32 training grant GM008185. TC acknowledges support from the National Science Foundation through grant DMS-1516675. MD and TC were also supported by Army Research Office through grant W911NF-14-1-0472.
References
- Wilen et al. (2012) C. B. Wilen, J. C. Tilton, and R. W. Doms, Cold Spring Harb. Persp. Med. 2 (2012).
- Roche et al. (2015) J. Roche, J. M. Louis, A. Aniana, R. Ghirlando, and A. Bax, J. Biomol. NMR 61, 235 (2015).
- Lodish et al. (2004) H. Lodish, A. Berk, and P. Matsudaira, Molecular Cell Biology (W.H. Freeman, 2004).
- Boulant et al. (2015) S. Boulant, M. Stanifer, and P.-Y. Lozach, Viruses 7, 2794 (2015).
- Stalmeijer et al. (2004) E. H. B. Stalmeijer, R. P. van Rij, B. Boeser-Nunnink, J. A. Visser, M. A. Naarding, D. Schols, and H. Schuitemaker, J. Virol. 78, 2722 (2004).
- Chou (2007) T. Chou, Biophys. J. 93, 1116 (2007).
- Nowak and Chou (2009) S. A. Nowak and T. Chou, Biophys. J. 96, 2624 (2009).
- Chou and D’Orsogna (2007) T. Chou and M. R. D’Orsogna, J. Chem. Phys. 127, 105101 (2007).
- Qian et al. (2009) K. Qian, S. L. Morris-Natschke, and K.-H. Lee, Med. Res. Rev. 29, 369 (2009).
- Pegu et al. (2014) A. Pegu, Z.-y. Yang, J. C. Boyington, L. Wu, S.-Y. Ko, S. D. Schmidt, K. McKee, W.-P. Kong, W. Shi, X. Chen, et al., Sci. Transl. Med. 6, 88 (2014).
- Osbourn et al. (1998) J. K. Osbourn, J. C. Earnshaw, K. S. Johnson, M. Parmentier, V. Timmermans, and J. McCafferty, Nat. Biotechnol. 16, 778 (1998).
- Qiu et al. (2012) S. Qiu, H. Yi, J. Hu, Z. Cao, Y. Wu, and W. Li, Curr. HIV Res. pp. 182–194 (2012).
- Jonckheere et al. (2000) H. Jonckheere, J. Anné, and E. De Clercq, Med. Res. Rev. 20, 129 (2000).
- Thierry et al. (2015) S. Thierry, S. Munir, E. Thierry, F. Subra, H. Leh, A. Zamborlini, D. Saenz, D. N. Levy, P. Lesbats, and A. Saib, Retrovirology 12, 24 (2015).
- Paterson et al. (2000) D. L. Paterson, S. Swindells, J. Mohr, M. Brester, E. N. Vergis, C. Squier, M. M. Wagener, and N. Singh, Ann. Intern. Med. 133, 21 (2000).
- Moore and Doms (2003) J. P. Moore and R. W. Doms, P. Natl. Acad. Sci. U.S.A. 100, 10598 (2003).
- Platt et al. (2005) E. J. Platt, J. P. Durnin, and D. Kabat, J. Virol. 79, 4347 (2005).
- Platt et al. (2014) E. J. Platt, M. M. Gomes, and D. Kabat, J. Virol. 88, 4304 (2014).
- Manca et al. (1993) F. Manca, E. Seravalli, M. T. Valle, D. Fenoglio, A. Kunkl, G. Li Pira, S. Zoiia-Pazner, and F. Celada, Int. Immunol. 5, 1109 (1993).
- White et al. (2008) J. M. White, S. E. Delos, M. Brecher, and K. Schornberg, Crit. Rev. Biochem. Mol. 43, 189 (2008).
- Xiao et al. (1999) X. Xiao, L. Wi, T. S. Stantchev, Y. Feng, S. Ugolini, H. Chen, Z. Shen, J. L. Riley, C. C. Broder, Q. J. Sattentau, et al., P. Natl. Acad. Sci. U.S.A. 96, 7496 (1999).
- Johnston et al. (2009) S. H. Johnston, M. A. Lobritz, S. Nguyen, K. Lassen, S. Delair, F. Posta, Y. J. Bryson, E. J. Arts, T. Chou, and B. Lee, J. Virol. 83, 11016 (2009).
- Chikere et al. (2013) K. Chikere, T. Chou, P. R. Gorry, and B. Lee, Virology 435, 81 (2013).
- Mascola et al. (2002) J. R. Mascola, M. K. Louder, C. Winter, R. Prabhakara, S. C. De Rosa, D. C. Douek, B. J. Hill, D. Gabuzda, and M. Roederer, J. Virol. 76, 4810 (2002).
- Webb and Lee (2016) N. E. Webb and B. Lee, in HIV Protocols (Springer New York, 2016), vol. 1354 of Methods in Molecular Biology, pp. 3–20.
- Weiss (1997) J. N. Weiss, FASEB J. 11, 835 (1997).
- Kuhmann et al. (2000) S. E. Kuhmann, E. J. Platt, S. L. Kozak, and D. Kabat, J. Virol. 74, 7005 (2000).
- Zolla-Pazner and Cardozo (2010) S. Zolla-Pazner and T. Cardozo, Nat. Rev. Immunol. 10, 527 (2010).
- Roche et al. (2011) M. Roche, M. R. Jakobsen, J. Sterjovski, A. Ellett, F. Posta, B. Lee, B. Jubb, M. Westby, S. R. Lewin, P. A. Ramsland, et al., J. Virol. 85, 4330 (2011).
- Salimi et al. (2013) H. Salimi, M. Roche, N. Webb, L. R. Gray, K. Chikere, J. Sterjovski, A. Ellett, S. L. Wesselingh, P. A. Ramsland, B. Lee, et al., J. Leukoc. Biol. 93, 113 (2013).
- Gibbons et al. (2010) M. M. Gibbons, T. Chou, and M. R. D’Orsogna, J. Phys. Chem. B 114, 15403 (2010).
- Seisenberger et al. (2001) G. Seisenberger, M. U. Ried, T. Endress, H. Büning, M. Hallek, and C. Bräuchle, Science 294, 1929 (2001).
- Chang et al. (2005) M. I. Chang, P. Panorchan, T. M. Dobrowsky, Y. Tseng, and D. Wirtz, J. Virol. 79, 14748 (2005).
- Dale et al. (2011) B. M. Dale, G. P. McNerney, W. Hübner, T. R. Huser, and B. K. Chen, Methods 53, 20 (2011).
- Hoffman et al. (1999) T. Hoffman, C. LaBranche, W. Zhang, G. Canziani, J. Robinson, I. Chaiken, J. Hoxie, and R. Doms, P. Natl. Acad. Sci. U.S.A. 25, 6359 (1999).
- Zhuang et al. (2014) K. Zhuang, A. Leda, L. Tsai, H. Knight, C. Harbison, A. Gettie, J. Blanchard, S. Westmoreland, and C. Cheng-Mayer, J. Virol. 88, 8407 (2014).
- Edinger et al. (1999) A. L. Edinger, C. Blanpain, K. J. Kunstman, S. M. Wolinsky, M. Parmentier, and R. W. Doms, J. Virol. 73, 4062 (1999).
- Miyauchi et al. (2009a) K. Miyauchi, Y. Kim, O. Latinovic, V. Morozov, and G. B. Melikyan, Cell 137, 433 (2009a).
- Miyauchi et al. (2009b) K. Miyauchi, M. Kozlov, and G. Melikyan, PLoS Pathog. 5, e1000585 (2009b).
- Yang et al. (2000) C. Yang, Q. Yang, and R. W. Compans, J. Virol. 74, 6217 (2000).
- Brown (1997) A. J. L. Brown, P. Natl. A. Sci. 94, 1862 (1997).