Crowdtesting : When is The Party Over?
Abstract.
Trade-offs such as “how much testing is enough” are critical yet challenging project decisions in software engineering. Most existing approaches adopt risk-driven or value-based analysis to prioritize test cases and minimize test runs. However, none of these is applicable to the emerging crowd testing paradigm where task requesters typically have no control over online crowdworkers’s dynamic behavior and uncertain performance.
In current practice, deciding when to close a crowdtesting task is largely done by guesswork due to lack of decision support. This paper intends to fill this gap by introducing automated decision support for monitoring and determining appropriate time to close the crowdtesting tasks.
First, this paper investigates the necessity and feasibility of close prediction of crowdtesting tasks based on industrial dataset. Then, it designs 8 methods for close prediction, based on various models including the bug trend, bug arrival model, capture-recapture model. Finally, the evaluation is conducted on 218 crowdtesting tasks from one of the largest crowdtesting platforms in China, and the results show that a median of 91% bugs can be detected with 49% saved cost.
1. Introduction
Crowdtesting is an emerging trend in software testing practices that accelerates testing processes by attracting online crowd workers to accomplish various types of testing tasks (Mao et al., 2017; Zhang et al., 2018; lin, 2018; Wang et al., 2017a; Cui et al., 2017b). On one hand, crowdtesting entrusts testing tasks to unknown, online crowd workers whose diverse testing environments/platforms, background, and skill sets could significantly contribute to more reliable, cost-effective, and efficient testing results. On the other hand, some aspects of software cannot be tested any other way, except asking humans to use the system, e.g., usability testing (Gomide et al., 2014). For these tasks, crowdtesting is inherently a natural fit than other alternatives.
Trade-offs such as “how much testing is enough” are critical yet challenging project decisions in software engineering (Myers et al., 2011; Lewis, 2016; Garg et al., 2011; Iqbal et al., 2013). Stopping too early can lead to inefficient testing and unsatisfying software quality, while stopping too late can result in the waste of testing resources.
In current practice, deciding when to close a crowdtesting task is largely done by guesswork due to lack of decision support. Project managers usually set up task’s closing condition through either a fixed duration (e.g., 5 days) or fixed budget (e.g., recruiting 400 crowd workers). If either of the criteria is met first, then the task will be automatically closed. Our investigation on real-world crowdtesting data reveals that the number of detected bugs111This paper uses bug and defect interchangeably. would first increase rapidly, then undergo slow growth, and finally become flatten-out (see Section 2.3). This is because for the latter stage of a crowdtesting task, the submitted reports are mainly the duplicates of previous ones. Therefore, it is of great value to automatically decide when to close a crowdtesting task so as to improve its cost-effectiveness.
Many existing approaches employed either risk-driven or value-based analysis to prioritize or select test cases and minimize test runs (Wang et al., 2017b; Shi et al., 2015; Epitropakis et al., 2015; Saha et al., 2015; Henard et al., 2016). However, none of these is applicable to the emerging crowd testing paradigm where task requesters typically have no control over online crowdworkers’s dynamic behavior and uncertain performance. There were several researches focusing on the time-series models for measuring software reliability and predicting when to stop testing and release a software product (Garg et al., 2011, 2013; Iqbal et al., 2013). This paper will adopt two most promising models (i.e., Rayleigh’s defect arriving model and knee model) and examine its effectiveness in predicting when to close a crowdtesting task. Another body of previous researches aimed at optimizing software inspection, which also concerned predicting the total and remaining number of bugs (Briand et al., 2000; Walia and Carver, 2009; H.Chun, 2006; Rong et al., 2017; Mandala et al., 2012; Goswami et al., 2015; Vitharana, 2017). This paper will adopt ideas from the most commonly-used capture-recapture models and examine its effectiveness in conducting close prediction of crowdtesting.
This paper first investigates the necessity and feasibility of close prediction of crowdtesting tasks based on industrial dataset. It then designs 8 methods to conduct the close prediction. Method Trend is a straightforward and intuitive method, which determines the close time if no new bugs detected over a certain number of successive reports. Method Peak is based on the Rayleigh’s defect arriving model, while method Knee is based on the slope of bug trend curve. The other five methods are based on different variations of Capture-ReCapture models, which can estimate the total number of bugs in a software system.
This paper evaluates each method on 218 crowdtesting tasks from one of the largest Chinese crowdtesting platforms. The experimental results show that the most straightforward Trend method achieves the best performance. Generally speaking, a median of 91% bugs can be detected with 49% reduced cost. For our experimental crowdtesting platform, it delivers about 1000 crowdtesting tasks a year and a task consumes approximately 3,000 China Yuan (i.e., the cost paid to crowdworkers). According to estimates, this crowdtesting platform can save 1,470,000 China Yuan (about 245,000 US dollars) a year.
The contributions of this paper are as follows:
-
•
An empirical investigation on the necessity and feasibility to conduct the close prediction of crowdtesting tasks based on industrail dataset. To the best of our knowledge, this is the first work to identify the problem of close prediction for crowdtesting task. Practical experiences lead us to believe that this is an important problem in crowdtesting.
-
•
The design of 8 methods for close prediction of crowdtesting tasks.
-
•
An evaluation of the effectiveness of the designed methods based on 218 crowdtesting tasks from one of the largest crowdtesting platforms in China, and results are promising.
-
•
A cautionary tale that verbatim reuse of methods from other fields may not produce the best results of crowdtesting. Specifically, we show the capture-recapture models from software inspections do not work well on crowdtesting data. Furthermore, a straightforward method can produce the most effective performance in close prediction of crowdtesting task222Url for the website with experimental dataset, source code and detailed experimental results is blinded for review..
Note that, this paper does not aims at exploring the entire set of methods for close prediction of crowdtesting. Instead, because there are no ready-made methods, we adopt ideas from several commonly-used and representative techniques(Lyu et al., 1996; Yamada, 2014), and design 8 methods for close prediction of crowdtesting, with demonstrated prediction capability as well as application readiness.
The rest of this paper is organized as follows. Section 2 describes the background and motivation of this study. Section 3 presents the details of our designed methods. Sections 4 and 5 show the experimental setup and evaluation results respectively. Section 6 provides a detailed discussion and threats to validity. Section 7 surveys related work. Finally, we summarize this paper in Section 8.
2. Background and Motivation
2.1. Background
In this section, we present a brief background of crowdtesting to help better understand the challenges we meet in real industrial crowdtesting practice.
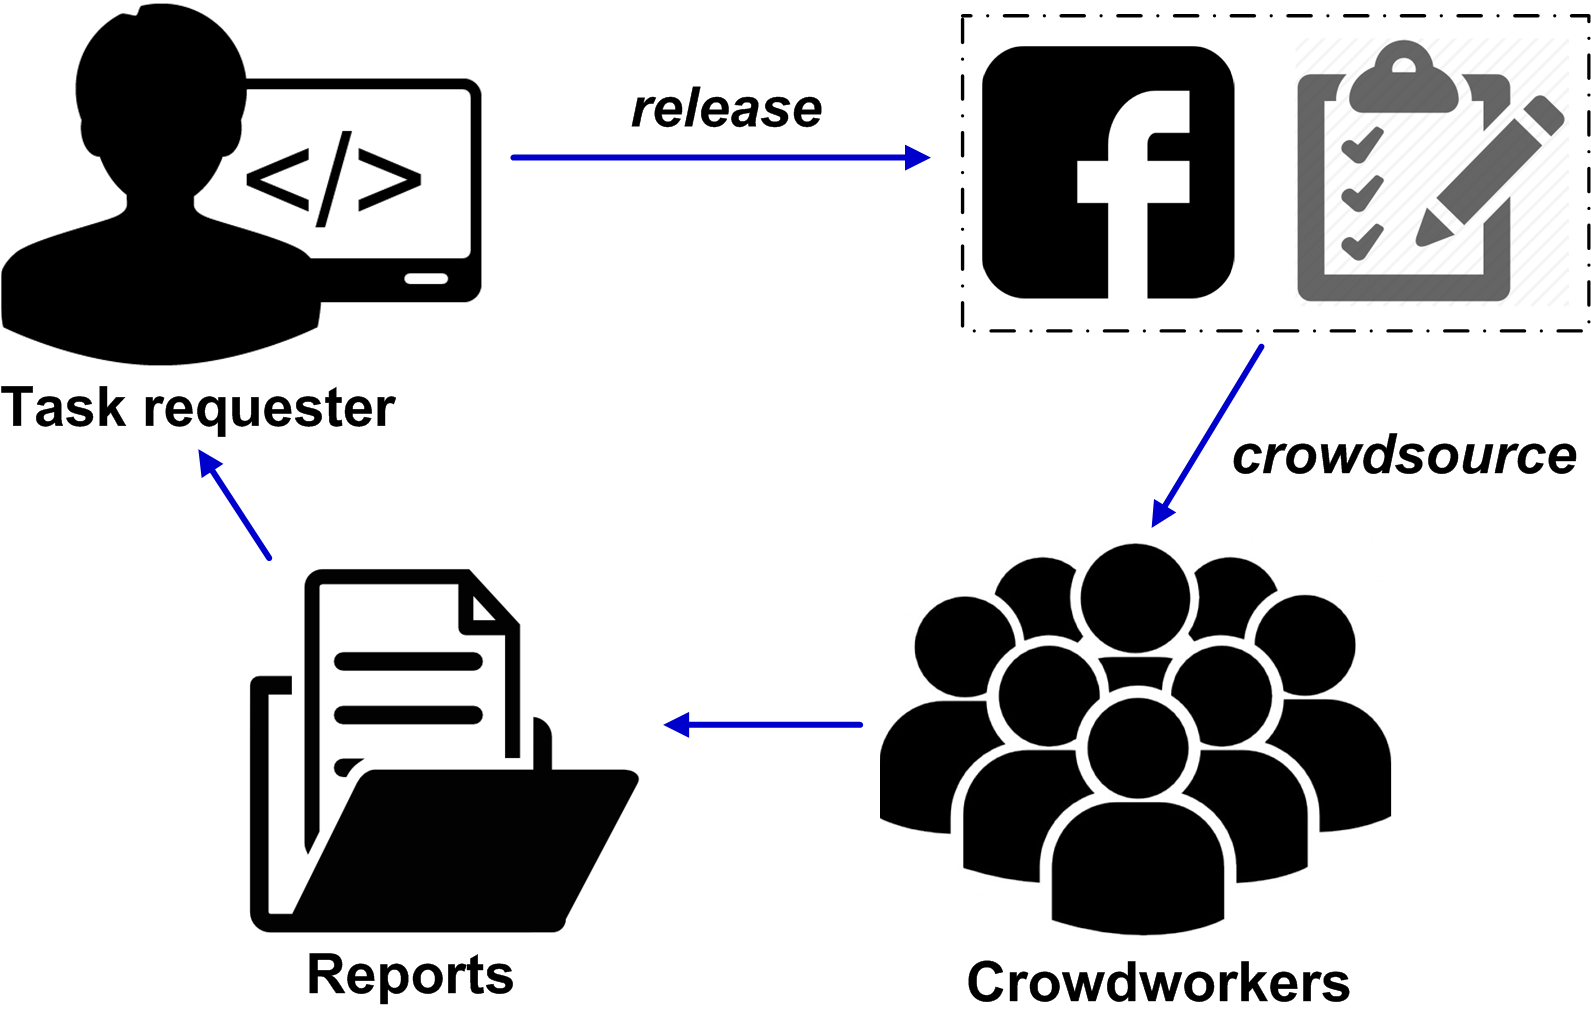
As shown in Figure 1, in general, the task requester prepares the crowdtesting task (including the software under test and test requirements), and distributes it on the crowdtesting platform. The crowdworkers can sign in to conduct the tasks and are required to submit crowdtesting reports, which describe the input, operation steps, results of the test, etc. In this way, the crowdtesting platform will receive crowdtesting reports submitted by the crowdworkers in chronological order. The task requester then inspects each report manually or using automatic tool support (e.g., (Wang et al., 2016a, 2017a)), and the content of each report will be characterized using two attributes: 1) whether it contains a bug333In our experimental platform, a report would contain zero or one bug.; 2) whether it is the duplicate of previously submitted reports. In the following paper, if not specified, when we say “bug” or “unique bug”, we mean the corresponding report contains a bug and the bug is not the duplicate of previously submitted ones.
Our experiment is conducted with BigCompany crowd-testing platform. Through talking with the project managers in this platform, we find that deciding when to close a crowdtesting task is largely done by guesswork due to lack of decision support. They usually set up either a fixed period (e.g., 5 days) or a fixed number of participant (e.g., recruiting 400 crowd workers). If either of the criteria is met first, then the testing task will be automatically closed. To avoid insufficient testing, they tend to employ a relatively large threshold for testing period or number of participants. The observation on their dataset reveals it is a waste of cost (see Section 2.3). The project managers mentioned that they keen for the automatic decision support for when to close a crowdtesting task.
2.2. BigCompany DataSet
The experimental dataset is collected from BigCompany444Blinded for review. crowdtesting platform, which is one of the largest crowdtesting platforms in China. We collected all crowdtesting tasks closed between May. 1st 2017 and Jul. 1st 2017. In total, there are 218 crowdtesting tasks, with 46434 submitted crowdtesting reports. The minimum, average, and maximum number of reports (and unique bugs) in a crowdtesting task are respectively 101 (6), 213 (26), and 876 (89).
To understand the real-world crowdtesting practice, we have conducted an analysis on the collected dataset, and observations are shown in the next subsection.
2.3. Observations and Implications
For the received reports (in chronological order) of each crowdtesting task, we count how many unique bugs have been accumulated considering the previous K reports (we call it bug trend for simplicity). K is ranged from 1 to the total number of reports. We then compute the percentage of bugs for each K, considering the total number of detected unique bugs.
We have investigated the bug trend for all 218 experimental crowdtesting tasks. A general pattern observed is that the number of detected bugs of a test task would first increase rapidly, then undergo slow growth, and finally become flatten-out. This is because for the latter stage of a crowdtesting task, the submitted reports are mainly contributing duplicate bugs.
Nevertheless, as the crowdworkers are encouraged to come and perform the testing tasks at any time, the bug trend of different tasks vary slightly. We further summarize three categories of bug trend in Figure 2 to better motivate this study. The red dots in Figure 2 denotes the turning points, i.e., the point after which the number of detected bugs remain unchanged for a successive 20 reports. Note that, the number 20 is set empirically and is just used for demonstrating the trend, not for evaluation purpose.
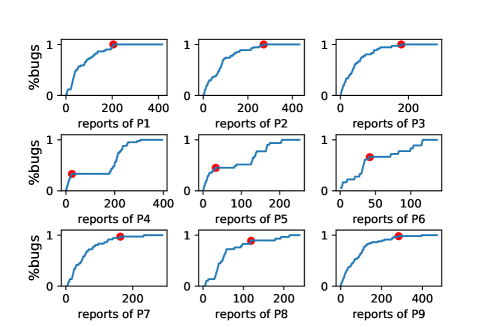
The first category is called “Rise-Stay”. We present three example crowdtesting tasks, i.e., P1, P2, and P3 in Figure 2. We can see that for the tasks in this category, with the increase of submitted reports, the percentage of detected bugs would first increase sharply and remain unchanged during the latter part of the task. For this category, there is an obvious turning point (the red dot in Figure 2). If the crowdtesting platform can close the test task in the turning point, a large portion of cost can be saved without sacrifice the testing quality (i.e., number of detected bugs). 51.8% (113/218) of our experimental crowdtesting tasks belong to this category.
The second category is called “Rise-Stay-Rise”. The P4, P5, and P6 example tasks in Figure 2 belong to this category. We can see that for the tasks in this category, with the increase of submitted reports, the percentage of detected bugs would first increase, and remain unchanged for a noticeable number of reports during the front part of the task, then increase greatly again. For this category, although the unchanged part of the task is a waste of cost, the task could not be closed at that turning point because there are still a large number of bugs not be reported. 8.7% (19/218) of our experimental crowdtesting tasks belong to this category.
The third category is called “Rise-Stay-Slight Rise”. We also present three example tasks of this category, i.e., P7, P8, and P9 in Figure 2. We can see that for the tasks of this category, with the increase of submitted reports, the percentage of detected bugs would first increase, remain unchanged in the rear part of the task, and increase slightly. This category is between the first one and the second one. Compared with the first category, the tasks of this category does not remain unchanged in the latter part of task. Compared with the second category, there is only a slight increase in bug number after the turning point. If the crowdtesting platform close the task in the turning point, the task would be more cost-effective, although a very small portion of bugs would not be detected. 39.5% (86/218) of our experimental crowdtesting tasks belong to this category.
To summarize, the crowdtesting tasks of the first category and the third category (91.3% of all experimental tasks) can be closed much earlier than the real-world practice. This can save the cost of crowdtesting (i.e., less crowd workers are needed), and make it more cost-effective. Therefore, these findings motivate the necessity and feasibility to conduct the close prediction of crowdtesting tasks.
3. Methods for Close Prediction
To explore the feasibility of close prediction of crowdtesting task, we adopt the idea from several commonly-used and representative techniques (Lyu et al., 1996; Yamada, 2014) and design 8 methods to conduct the close prediction.
With respect to the context described in Section 2.1, the designed close prediction method would monitor the report submitting process. When there is a new report coming, the method would determine whether the submitted reports so far satisfy the predefined stopping criterion; if yes, it determines the time, when the last report was received, as the close point. The following subsections will introduce each method (including its stopping criterion) in detail.
3.1. Trend Indicator (short for Trend) Method
Driven by the flatten-out ending of bug trend discussed in Section 2.3, we design a straightforward and intuitive method for close prediction of crowdtesting tasks. The basic assumption here is that if the number of accumulated bugs remain unchanged for a while, it may suggest that there is no potential to discover new bugs from that point on.
More specifically, during the report submitting process, Trend method monitors the bugs accumulated so far, and counts the number of consecutive, non-contributing reports (i.e., reports not contributing any newly discovered, unique bugs). The stopping criterion is that the number of consecutive, non-contributing reports reaches a predefined threshold stableThres.
3.2. Peak Indicator (short for Peak) Method
In software reliability researches, Rayleigh’s defect arriving model is a classical method to characterize the events of defect detection/arrival following a Rayleigh distribution, i.e. a specialized variant in the Weibull probability distribution family (Kan, 2002). It has been demonstrated effective in predicting the dynamic defect arrival probability w.r.t. specific testing intervals (i.e. days, weeks, months, etc.), as well as the total number of defects associated with a software system based on the cumulative probability distribution (Kan, 2002).
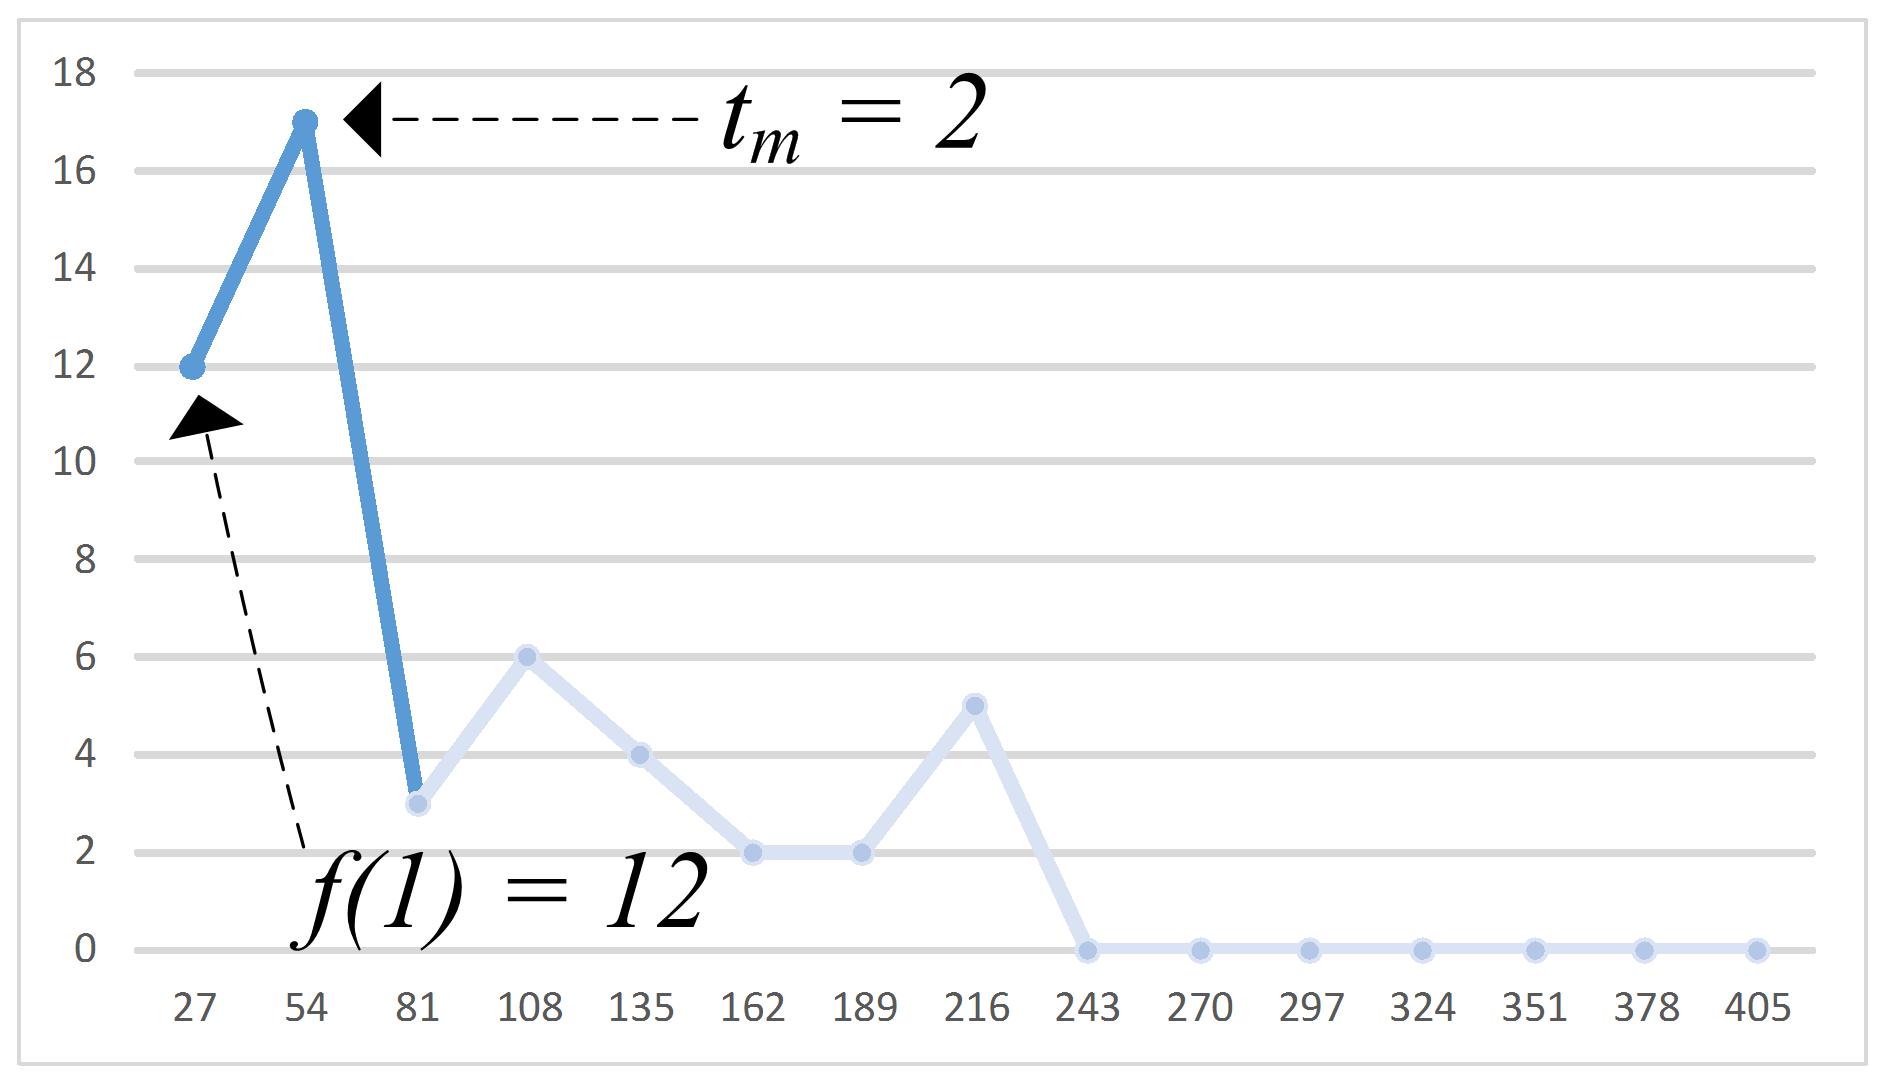
Inspired by the Rayleigh model, Peak method treats every stepSize reports as a unit (stepSize is a parameter denoting the size of a group of successive reports), and counts the number of bugs in each unit (denoted as ). With the arrival of reports, this method monitors until it first declines. It then records how many units have passed when reaches the peak (i.e., the unit before it first declines, denoted as ). Figure 3 presents an illustrative example (stepSize = 27) for task P1 (Figure 2). Note that, this figure displays the number of detected bugs during each unit (e.g., every 27 reports), while Figure 2 shows the number of accumulated bugs. As shown in Figure 3, starts to decline at the 3rd unit, then is 2. The total number of bugs can then be estimated using Equation 1 (Kan, 2002).
| (1) |
In Equation 1, we follow the most common practice and set as 1, denoting using the 1st unit to fit the distribution. Peak method will continue monitoring the process, and the stopping criterion is that the estimated total number of bugs equals to the number of accumulated bugs so far.
Note that, traditional software testing usually treats the reports within a fixed period (e.g. one day) as a unit. However, our initial analysis shows that in crowdtesting, tasks are typically open for shorter periods of time (e.g. 5 days). We did experiments on grouping reports by various time-based unit555For more details to these experiment results, we will provide online access in the camera-ready version. and the prediction performance is rather poor compared with the report-based unit treatment, as introduced above.
3.3. Knee Method
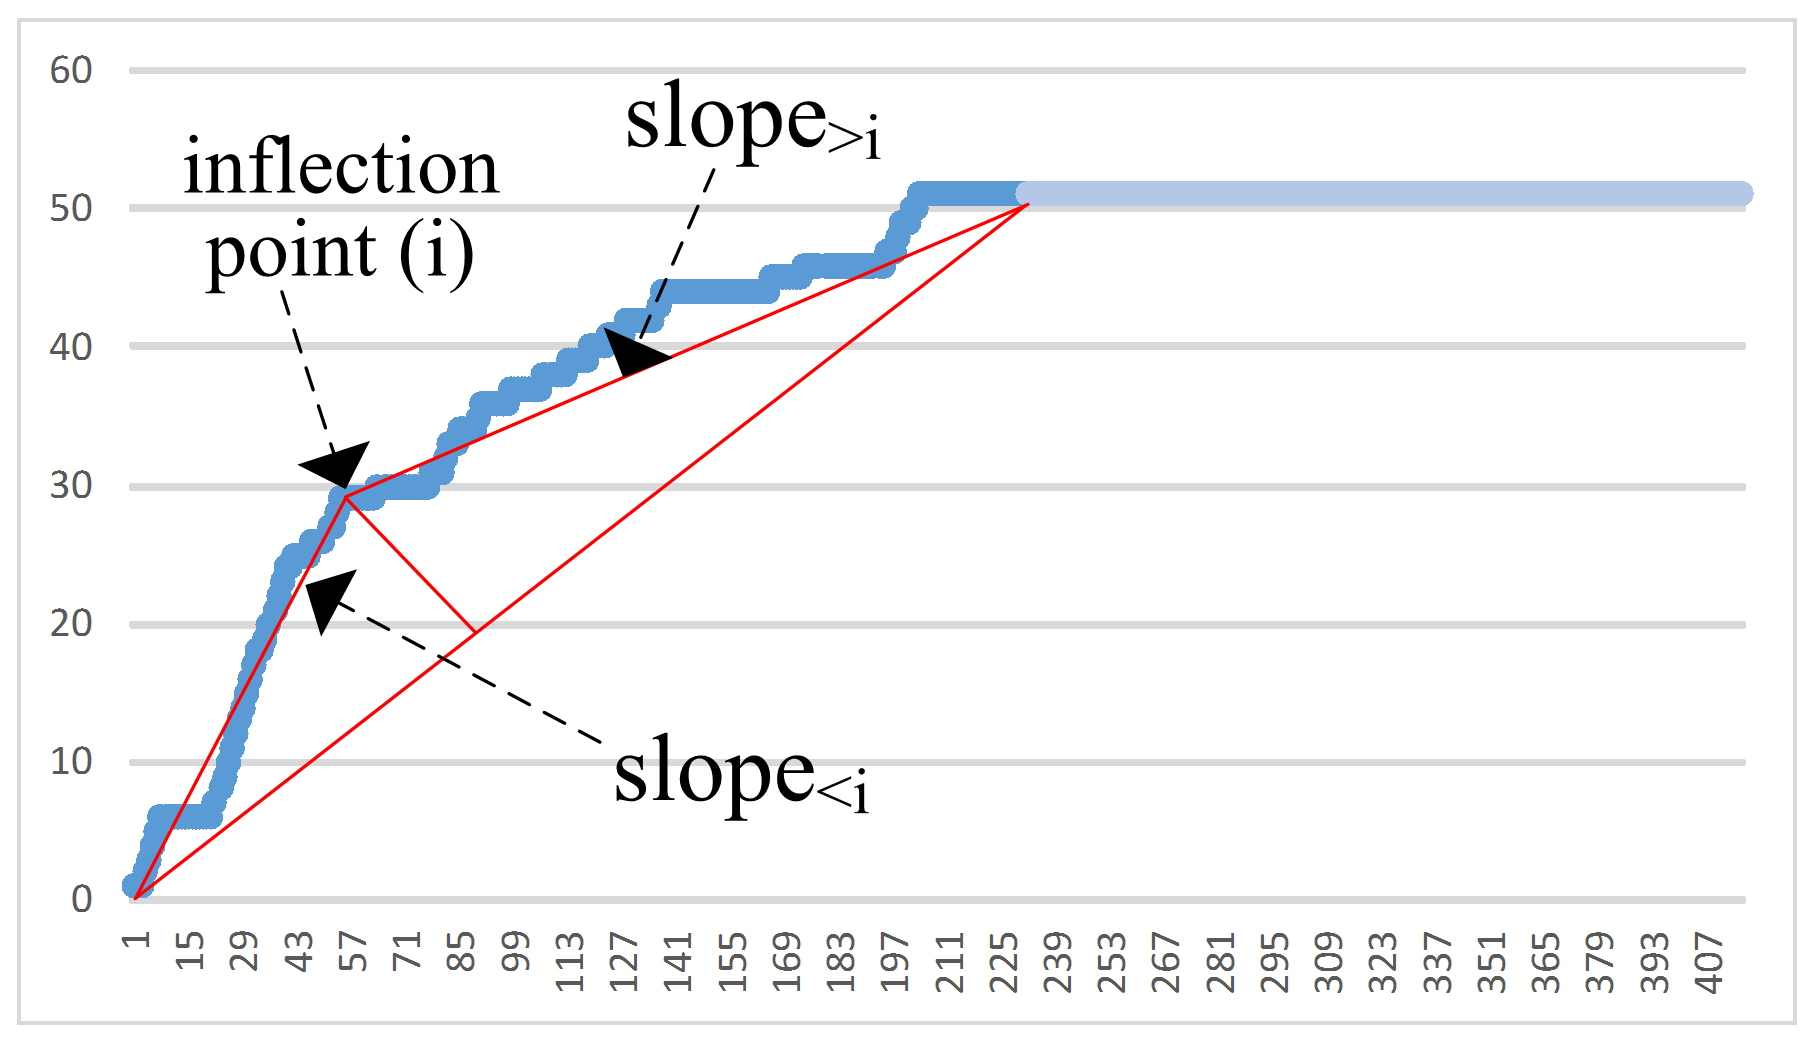
Knee method is widely used in technology-assisted review to decide when to stop, considering the quality and reliability (Cormack and Grossman, 2016). This method is based on the the slope of accumulated bug trend curve formed by the reports submitted up to now, as shown in Figure 2. It first detects the inflection point of current curve. This is done by connecting the starting point and end point of current bug trend curve, then the inflection point is the point which is the farthest from connection line. Figure 4 illustrates an example for task P1 (Figure 2) when receiving 232 reports. It then compares the slopes before and after , and the stopping criterion is that the ratio of is greater than a specific threshold kneeThres.
3.4. M0 Method
We first present some background knowledge shared by the following five methods, i.e., in Section 3.4-3.8.
The Capture-ReCapture (CRC) method, which uses the overlap generated by multiple captures to estimate the toal population, has been applied in software inspections to estimate the total number of bugs (Rong et al., 2017; Liu et al., 2015; H.Chun, 2006; Mandala et al., 2012). Existing CRC models can be categorized into four types according to bug detection probability (i.e. identical vs. different) and crowdworker’s detection capability (i.e. identical vs. different), as shown in Table 1.
M0 supposes all different bugs and crowdworkers have the same detection probability. Model Mh supposes that the bugs have different probability of being detected. Mt supposes that the crowdworkers have different detection capabilities. Mth supposes different detection probabilities for different bugs and crowdworkers.
Based on the four basic CRC models, various estimators were developed. According to a recent systematic review (Liu et al., 2015), MhJK, MhCH, MtCH are the three most frequently investigated and most effective estimators in software engineering. Apart from that, we investigate another two estimators (i.e., M0 and Mth) to ensure all four basic models are investigated. Base on the general idea of these five models, we design five corresponding methods to be applied to the close prediction problem for crowdtesting tasks in this section and Section 3.5-3.8.
Method M0 treats every capSize reports as a capture (capSize is a parameter denoting how many reports are considered in each capture). At the end of each capture (i.e., the number of received reports is the multiple of capSize), it conducts the following operations. It treats the newest capture as the second round, while all previous captures as the first round. It then counts the number of bugs in the first round (denoted as ) and number of bugs in the second round (denoted as ), as well as the number of bugs contained in both rounds (i.e., duplicate reports between 1st round and 2nd round, denoted as ). Note that, when counting , for the bug duplicated with the one in 1st round, we still treat it as a bug because the 2nd round is considered as a recapture. The total number of bugs is estimated as Equation 2 (Laplace, 1783). The stopping criterion is that the predicted total number of bugs is equal with the actual number of detected bugs so far. Note that, we simply treat as the total number when is 0.
| (2) |
3.5. Mth Method
This method treats every capSize reports as a capture. At the end of each capture, Mth method estimates the total number of bugs based on Equation 3, 4 (Lee, 1996). The stopping criterion is the same with M0 method, i.e., the predicted total number of bugs is equal with the actual number of detected bugs so far.
| (3) |
| (4) |
In it, is the predicted total number of bugs;
is the actual number of bugs captured so far;
is the number of capture;
is the number of bugs detected in each capture; Note that, as in M0, we do not consider the bug duplication among different captures.
is the number of bugs captured exactly times in all captures, i.e., .
Note that, these value assignments are shared among the following methods.
3.6. MhJK Method
MhJK method is similar with Mth method, except its equation for estimating the total number of bugs in Equation 5 (Burnham and Overton, 1978).
| (5) |
3.7. MhCH Method
MhCH method is similar with Mth method, except its equation for estimating the total number of bugs in Equation 6, 7 (Chao, 1988).
| (6) |
or
| (7) |
3.8. MtCH Method
MtCH method is also similar with Mth method, except its equation for estimating the total number of bugs in Equation 8 (Chao, 1987).
| (8) |
In it, is the number of bugs detected only in the capture, i.e., .
4. Experiment Design
To evaluate the effectiveness of the proposed close prediction methods, we design a series of evaluation experiments. This section presents the research questions, evaluation metrics, and setup for the experiments.
4.1. Research Questions
We formulate two research questions to be addressed in the experiment:
-
•
RQ1: How does the parameter of each method influence the prediction performance, and what is the optimal parameter value?
Since each method has a predefined parameter, RQ1 aims at analyzing the sensitivity of the parameters on prediction performance, and investigating its feasibility to converge on the optimal parameter value which optimizing the prediction performance.
-
•
RQ2: How effective is each method in close prediction of crowdtesting task?
RQ2 aims at evaluating the performance of the proposed methods to prove their effectiveness in improving current crowdtesting practices in determining optimal task closing.
Note that, because there is no existing work for close prediction of crowdtesting, we do not have explicit baselines. The only possible baseline, i.e., the actual practice indicated by the total number of detected bugs and the total number of submitted reports, is reflected in the evaluation metrics since %bug and %reducedCost are compared with actual practice.
4.2. Evaluation Metric
We measure the performance of each close prediction method based on how much percentage of bugs can be detected together with how much percentage of cost can be saved.
%bug is the percentage of bugs detected by the predicted close point. We treat the number of historical detected bugs as the total number. The larger %bug, the more bugs can be detected by the predicted clost point, the more effective the corresponding close prediction method is.
%reducedCost is the percentage of saved cost by the predicted close point. To derive this metric, we first obtain the percentage of reports submitted at the close point, in which we treat the number of historical submitted reports as the total number. We suppose this is the percentage of consumed cost666The most important cost in crowdsourced testing is the reward for workers, and their submitted reports are usually equally paid (Cui et al., 2017a, b); Hence we suppose it is reasonable for using the number of submitted reports to indicate the consumed cost. and %reducedCost is derived using 1 minus the percentage of consumed cost. The larger %reducedCost, the more cost is saved and less testing cost is needed, the more effective the proposed method is.
Intuitively, an increase in %bug would be accompanied with a decrease in %reducedCost. Motivated by the F1 (or F-Measure) in prediction approaches of software engineering (Nam et al., 2017; Wang et al., 2017a, 2016a), we further define F1, to measure the harmonic mean of %bug and %reducedCost as follows:
| (9) |
4.3. Experimental Setup
For RQ1, to demonstrate the influence of parameter and determine the optimal parameter value for each method, we first experiment with all candidate parameter values for each method on all experimental crowdtesting tasks, and then obtain the median performance across all tasks under each candidate parameter value (results are shown in Section 5.1.1). Next, we conduct three-fold cross validation (Witten and Frank, 2005) and repeat 1000 times to alleviate the randomness. In each cross validation, we randomly separate the 218 experimental crowdtesting tasks into three equal folds. We employ each two folds as training set to tune the optimal parameter value (rules for parameter tuning will be shown in Section 5.1.2), and use the remaining one fold as testing set. We then record the tuned optimal parameter value, and obtain the frequency of these values appeared in the 1000 cross validations, which will be reported in Section 5.1.3.
For RQ2, we use the parameter value which appeared most frequently (i.e., the highest bar in Fig. 6) in the 1000 cross validations to investigate the effectiveness of each method.
5. Results and Analysis
This section presents the results and analysis from the evaluation experiments.
5.1. Answering RQ1: Parameter Sensitivity and Tuning of Optimal Parameter Values
5.1.1. Parameter Sensitivity Analysis
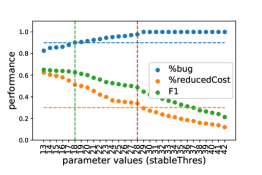
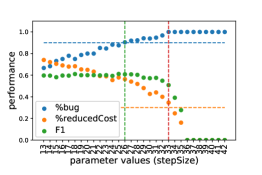
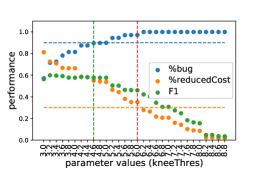
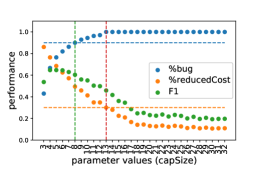
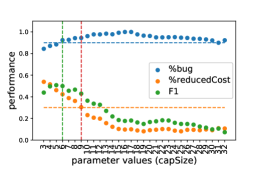
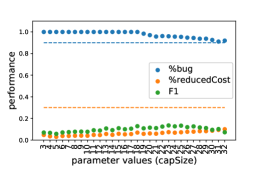
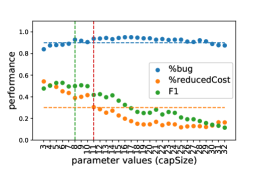
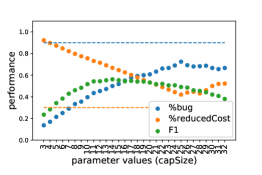
Figure 5 shows the scatter plots between parameter values and prediction performance for the 8 close prediction methods. Note that, for each method, we explored 100 candidate parameter values, and the charts present 30 of them with relatively good performance. The rest are omitted in this paper due to space limit.
In each chart of Fig. 5, three dotted curves demonstrate the prediction performance, i.e. %bug, %reducedCost, and F1. Generally speaking, with the increase of %bug, %reducedCost would decrease. This is consistent with common intuition that it costs more to detect every additional bugs.
It’s also observed that, almost for all methods, the change in performance is quite smooth. Put it in another way, the performances only demonstrate small difference with two continuous parameter values. This indicates that choosing two adjacent parameter values would not bring much variation in the performance. This is valuable when applying these methods in real-world practice, which will be discussed in details in Section 5.1.3.
Furthermore, for each method, only under certain parameter values, the prediction can achieve a satisfying performance. For example, for Peak, if the parameter value is smaller than 21, the percentage of detected bugs is not so high, i.e., less than 0.8 (Figure 5(b)). For Knee, the reduced cost is quite low, i.e., less than 0.05, when the parameter value is larger than 8.2 (Figure 5(c)). This implies that there is a need to tune the optimal parameter value when using these methods in real-world practices.
5.1.2. Rules for Determining Optimal Parameter Value
Presumably, the optimal parameter value will not only lead to a sufficiently good F1, but also ensure a pair of satisfactory values for %bug and %reducedCost which conveys meaningful and actionable insights to be easily interpreted and applied in planning for crowdtesting practices. It is observed from Figure 5 that under certain parameter value, although F1 is the highest, only 68% bugs can be detected with saving 76% cost (Figure 5(d), when parameter value is 5). We do not think this prediction makes much sense in real-world crowdtesting context, because a large portion of bugs still remain undetected. Similarly, we also hope the %reducedCost should satisfy a lower-bound restriction to ensure the achievement of cost-effectiveness objective.
In this study, after consulting with the managers from the BigCompany, we employ a rule-based approach to help determine the optimal parameter value. More specifically, as shown in Fig. 5, two horizontal lines are introduced to specify the performance expectation corresponding to the following two rules: R1) a minimum acceptable %bug value of 90%; R2) a minimum acceptable %reducedCost value of 30%. In other words, following these two rules, we expect to determine the optimal parameter value which will guarantee the prediction performance with a %bug value higher than 90% and a %reducedCost value greater than 30%.
Based on these two rules, the determined range of parameter values is depicted using two vertical lines in Fig. 5. The left line (i.e. Green) is identified by applying Rule R1 to the %bug data, and the right line (i.e. Red) is identified by applying Rule R2 to the %reducedCost data. Finally, we introduce a third rule: R3) the optimal parameter value is the specific parameter value associated with a maximum F1 from the restricted range identified by R1 and R2. For example, the optimal parameter value of Peak is 27 (Figure 5(b)), and the optimal parameter value of M0 is 8 (Figure 5(d)).
Please note that the restriction values (i.e., 90%, 30%) in this experiment is decided based on our discussion with the project managers in BigCompany. People can customize their own restriction values when deciding the optimal parameter value. For example, if they want to save more cost, they can lower the %bug restriction to 80%. Another note is that, for those methods which do not have parameter value satisfying the restriction (i.e., MhJK and MtCH), we simply choose the parameter value with the largest F1 (directly applying R3). We will explain the reason for the low performance of MhJK and MtCH in Section 5.2.
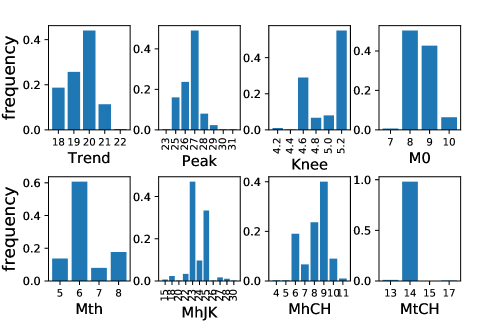
5.1.3. Tuned Parameter Values
Figure 6 demonstrates the frequency of tuned optimal parameter values in the 1000 cross validations (see Section 4.3). It is noticeable that for most methods, there are mainly 2-4 values determined as the optimal parameter values in different training dataset. For example, the optimal parameter values for Trend is 18 to 21, while the optimal parameter values for M0 is 8 and 9.
These tuned optimal parameter values are consistent with the optimal parameter values determined on all experimental tasks in Figure 5. For example, the optimal parameter value (Figure 5) of Peak and M0 are respectively 27 and 8, while most frequently tuned optimal parameter value (Figure 6) of Peak and M0 are also 27 and 8.
In addition, these optimal parameter values are adjacent with each other, for example, 18, 19, 20, 21 for Trend. We have mentioned in Section 5.1.1, the performances obtained by adjacent parameter values usually have small difference. This indicates that based on the high frequency parameter values in Figure 6, the performance might not exert much difference among the different choices (e.g. using 19 or 20 in Trend).
This experimental finding provides insightful guidelines for applying these methods. Crowdtesting managers can use the high frequency parameter values obtained in our experimental dataset, and different choice might not bring large variance in the performance. Of course, if they have historical crowdtesting tasks, they can apply additional tuning of the optimal parameter value.
In the following subsection, for each method, we will report results from experiments applying the most frequent parameter value to investigate the effectiveness of the method.
5.2. Answering RQ2: Effectiveness
| Median | Std. | |||||
|---|---|---|---|---|---|---|
| %B | %R | F1 | %B | %R | F1 | |
| Trend | 0.913 | 0.494 | 0.607 | 0.173 | 0.202 | 0.181 |
| Peak | 0.919 | 0.540 | 0.607 | 0.180 | 0.345 | 0.333 |
| Knee | 0.934 | 0.503 | 0.536 | 0.236 | 0.317 | 0.274 |
| M0 | 0.926 | 0.475 | 0.579 | 0.187 | 0.212 | 0.186 |
| Mth | 0.919 | 0.414 | 0.493 | 0.251 | 0.269 | 0.220 |
| MhJK | 0.956 | 0.065 | 0.123 | 0.099 | 0.084 | 0.106 |
| MhCH | 0.900 | 0.407 | 0.499 | 0.246 | 0.257 | 0.210 |
| MtCH | 0.500 | 0.667 | 0.561 | 0.177 | 0.130 | 0.105 |
| Peak | Knee | M0 | Mth | MhJK | MhCH | MtCH | |||||||||||||||
|---|---|---|---|---|---|---|---|---|---|---|---|---|---|---|---|---|---|---|---|---|---|
| %B | %R | F1 | %B | %R | F1 | %B | %R | F1 | %B | %R | F1 | %B | %R | F1 | %B | %R | F1 | %B | %R | F1 | |
| Trend | 0.97 | 0.69 | 0.07 | 0.70 | 0.79 | 0.00* | 0.33 | 0.20 | 0.08 | 0.59 | 0.01* | 0.00* | 0.00* | 0.00* | 0.00* | 0.25 | 0.00* | 0.00* | 0.00* | 0.00* | 0.00* |
| Peak | 0.92 | 0.16 | 0.81 | 0.51 | 0.83 | 0.30 | 0.38 | 0.46 | 0.17 | 0.00* | 0.00* | 0.00* | 0.14 | 0.67 | 0.12 | 0.00* | 0.00* | 0.21 | |||
| Knee | 0.74 | 0.75 | 0.06 | 0.43 | 0.36 | 0.06 | 0.01* | 0.00* | 0.00* | 0.13 | 0.26 | 0.06 | 0.00* | 0.00* | 0.44 | ||||||
| M0 | 0.24 | 0.13 | 0.00* | 0.00* | 0.00* | 0.00* | 0.06 | 0.06 | 0.00* | 0.00* | 0.00* | 0.09 | |||||||||
| Mth | 0.00* | 0.00* | 0.00* | 0.50 | 0.93 | 0.98 | 0.00* | 0.00* | 0.00* | ||||||||||||
| MhJK | 0.00* | 0.00* | 0.00* | 0.00* | 0.00* | 0.00* | |||||||||||||||
| MhCH | 0.00* | 0.00* | 0.00* | ||||||||||||||||||
Note that we mark the values less than 0.05 with *, denoting the difference is significant.
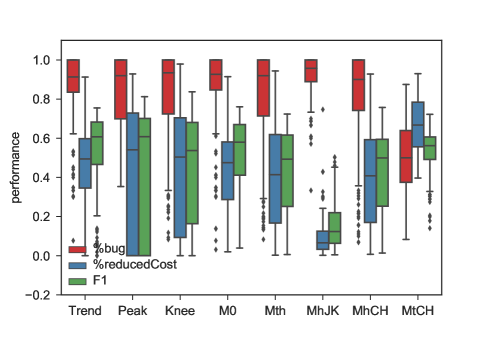
Figure 7 demonstrates the prediction performance on 218 experimental crowdtesting tasks with each method. Table 2 additionally demonstrates the mean and standard deviation of %bug, %reducedCost and F1 for better illustration. In addition, Table 3 presents the p-value of Mann-Whitney U Test between each two methods.
At first glance, we can see that the first four methods (i.e., Trend, Peak, Knee, and M0) achieve relatively better performance, while the performance of the last four methods are a little worse. This is beyond our expectation, because three of the last four methods (i.e., MhJK, MhCH, MtCH) have proven to be the best bug estimators in software inspection researches (Liu et al., 2015; Briand et al., 2000; H.Chun, 2006; Rong et al., 2017). In crowdtesting, these capture-recapture methods are worse than the simple capture-recapture methods (i.e., M0). This might because in software inspection, the inspectors are predetermined and they test under closed environment. For crowdtesting, there is no predefined workers for a task, and each registered crowdworker of the platform can come at any time, so they test under open environment. This implies the well-designed capture-recapture algorithms (i.e., MhJK, MhCH, and MtCH) for closed environment might not be suitable for crowdtesting.
For the four better methods (i.e., Trend, Peak, Knee, and M0), we first put our focus on the median performance on the experimental dataset. Generally speaking, the performance of them do not exert significant difference (all the p-value, except between Trend’s F1 and Knee’s F1, is larger than 0.05 in Table 3). This implies that all these four methods can obtain a similar median performance on our experimental crowdtesting tasks.
We then shift our focus on the variance of the performance. From Figure 7 and Table 2, we can easily see that the standard deviation of Peak and Knee is much larger than the variance of Trend and M0. This implies for a noticeable portion of our experimental crowdtesting tasks, the performance obtained by Peak and Knee is low. Put it in another way, on our experimental crowdtesting tasks, the performance obtained by Trend and M0 are more stable, thus more effective.
To summarize, 1)Trend and M0 are the best two methods for close prediction in terms of median and deviation performance across all experimental tasks; 2) Trend is slightly better than M0, considering median F1 of Trend is 0.607, while median F1 of M0 is 0.579. This is out of our expectation, because Trend is the most straightforward and intuitive method. This might because the bug detection process of crowdtesting task is more open and complicated than traditional software testing process. Under a complicated scenario, a simple way can usually take effect (Brighton, 2006; Fu and Menzies, 2017). This suggests, to conduct the close prediction of crowdtesting task, one should first try the most simple method.
Furthermore, under the best method Trend, a median of 91% bugs can be detected with 49% reduced cost. This implies the task requester can save 49% of budgeted cost with the risk of missing 9% bugs. The reduced cost is a tremendous figure when considering the large number of tasks delivered in a crowdtesting platform.
6. Discussion
6.1. Rise-Stay-Rise Pattern Causes Performance Bottleneck
We conduct additional analysis on the potential causes for the tasks with low %bug. The initial results suggest that for all methods, the low prediction performance is attributed to the errors from the crowdtesting tasks belonging to the second category, i.e. whose reports arrival follows the Rise-Stay-Rise pattern (see Section 2.3). Intuitively, during the “Stay” phase, the number of bugs remain unchanged for a noticeable large number of consecutive reports, which consequently misleads the close prediction methods to determine it as the close point. All 8 proposed methods suffer from this problem.
One possible mitigation is to combine these methods with other estimators which are based on orthogonal assumption other than the leverage of dynamic defect arrival pattern (i.e., methods proposed in this paper). For example, it might be helpful to predict the total number of bugs based on the function point or other related features using machine learner (Fu and Menzies, 2017; Nam et al., 2017; Menzies et al., 2007). Then this number can be used as a sanity check to detect false alarm when our designed method predicts a close point with much smaller total number of bugs. We will explore more techniques to detect and address this problem in future work.
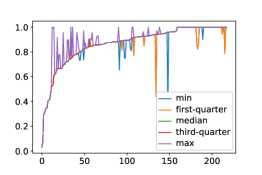
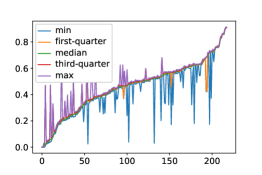
6.2. Stability of Performance in Terms of 1000 Cross Validations
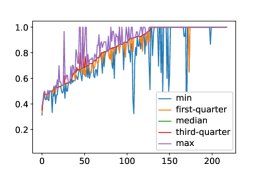
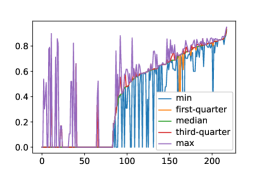
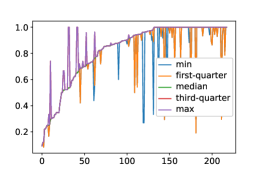
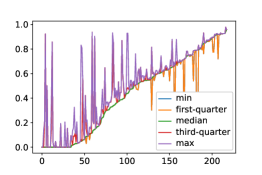
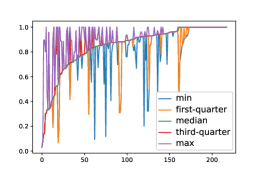
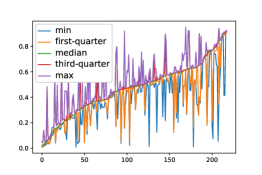
We have conducted 1000 cross validations to tune the optimal parameter on the randomly-selected 2/3 training tasks and test the tuned parameter on the remaining tasks (see Section 4.3). One may want to know, for each experimental task, whether the performance is stable across all validations (i.e., under different tuned parameter values). Figure 8 shows the min, first-quarter, median, third-quarter, and max value of %bug and %reducedCost for each experimental task (order by the median performance). Due to space limit, we only present the results for the best four methods (i.e., Trend, Peak, Knee, and M0), and present other results on our website.
From Figure 8, we can see that the performance of Trend is more stable than other three methods in terms of 1000 cross validations. This again indicates the effectiveness of Trend.
For Trend, we can see that in 93% (204/218) experimental tasks, the min and first-quarter of %bug obtained by Trend is the same as the median %bug. In 91% (199/218) experimental tasks, the median %bug is the same as the max %bug. For %reducedCost, in 87% (191/218) experimental tasks, the min and first-quarter performance is the same as the median performance. That is to say, for most experimental tasks, under different parameter values tuned by different training dataset, the performance remains almost unchanged. This implies the stability of Trend in terms of the 1000 cross validations, and further proves its effectiveness. We also noticed that for Trend method, %bug is more stable than %reduceCost. This is what the project managers expect. Because they mentioned the premises for making the crowdtesting more cost-effective is that a sufficient number of bugs should be detected.
We also examine the crowdtesting tasks whose min %bug is much smaller than its median %bug when using Trend. Results turn out that these projects have 18 successive reports during when the number of bugs remains unchanged and is far fewer than the total number of bugs (like the Rise-Stay-Rise pattern in Section 2.3). When the tuned parameter value is 18 based on the training set, the predicted close point is right located in the end of the 18 successive reports, therefore the %bug is low. When the tuned parameter value is bigger than 18, this would not happen. This is why the method is not stable enough when applied on these several projects.
6.3. Advantage of M0 Method
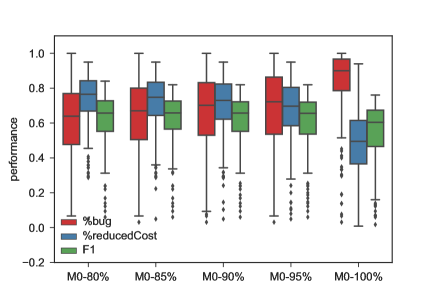
We have mentioned that Trend and M0 are the best two methods, with M0 slightly inferior than Trend. Nevertheless, method M0 provides additional flexibility over Trend, i.e. customization of the close point according to user’s preference. In detail, the experimental results in Section 5 assumes all the bugs should be reported. If the users hope to further save the cost, he can customize the method to close the task as long as K% (e.g., 80%) of bugs are reported.
Figure 9 shows the performance of M0 when the customized K% is 80%, 85%, 90%, 95%, 100% (i.e., the default M0). We can easily see that a lower K% can save more cost with fewer detected bugs. For example, default M0 can detect 91% bugs with 49% reduced cost. When we customize K% as 80%, a median of 65% bugs is reported with 77% reduced cost.
The reason why M0 can customize the close point is because it can obtain the estimated total number of bugs during the crowdtesting process. With the estimated total number of bugs, and the number of detected bugs so far, we can know how much percentage of bugs have been reported. However, we noticed that the total number of bugs are usually underestimated (i.e., customizing K% as 80%, only a median of 65% bugs found), we will explore this in future work.
6.4. Threats to Validity
The external threats concern the generality of this study. Firstly, our experiment data consists of 218 crowdtesting tasks collected from one of the Chinese largest crowdsourced testing platforms. We can not assume that the results of our study could generalize beyond this environment in which it was conducted. However, the diversity of tasks and size of dataset relatively reduce this risk. Secondly, our designed methods are largely dependent on the report’s attributes (i.e., whether it contains a bug; and whether it is the duplicates of previous ones) assigned by the task requesters. This is addressed to some extent due to the fact that we collected the data after the crowdtesting tasks were closed, and they have no knowledge about this study to artificially modify their assignment.
Internal validity of this study mainly questions the representativeness of the 8 designed methods. We have surveyed related work about quality insurance, software inspection and review, software reliability, and the designed methods involve the bug detection trend, the defect arrival model, the bug trend curve, the capture-recapture model, etc. Therefore we believe that this set coveres a large variety of of existing work, and captures the representative dynamic defect prediction models applicable in crowdtesting context.
Construct validity of this study mainly concerns the experimental setup for investigating the effectiveness of each method. We use the most frequent tuned optimal parameter values to examine the effectiveness. We also present the stability of the method in terms of 1000 cross validations to further prove its effectiveness.
7. Related Work
In this section, we discuss two areas related to our work, i.e., crowdsouced testing, software testing and reliability.
7.1. Crowdtesting
Crowdtesting has been applied to facilitate many testing tasks, e.g., test case generation (Chen and Kim, 2012), usability testing (Gomide et al., 2014), software performance analysis (Musson et al., 2013), software bug detection and reproduction (Gómez et al., 2016). These studies leverage crowdtesting to solve the problems in traditional testing activities, some other approaches focus on solving the new encountered problems in crowdtesting.
Feng et al. (Feng et al., 2015, 2016) proposed approaches to prioritize test reports in crowdtesting. They designed strategies to dynamically select the most risky and diversified test report for inspection in each iteration. Jiang et al. (Jiang et al., 2018) proposed the test report fuzzy clustering framework by aggregating redundant and multi-bug crowdtesting reports into clusters to reduce the number of inspected test reports. Wang et al. (Wang et al., 2016a, b, 2017a) proposed approaches to automatically classify crowdtesting reports. Their approaches can overcome the different data distribution among different software domains, and attain good classification results. Cui et al. (Cui et al., 2017b, a) and Xie et al. (Xie et al., 2017) proposed crowdworker selection approaches to recommend appropriate crowdworkers for specific crowdtesting tasks. These approaches considered the crowdworker’s experience, relevance with the task, diversity of testing context, etc., and recommend a set of workers who can detect more bugs.
In this work, we focus on predicting when to close a crowdtesting task, which is valuable to improve the cost-effectiveness of crowdtesting and not explored in existing work.
7.2. Software Testing and Reliability
Many existing approaches proposed risk-driven or value-based analysis to prioritize or select test cases (Wang et al., 2017b; Shi et al., 2015; Epitropakis et al., 2015; Saha et al., 2015; Henard et al., 2016; Panichella et al., 2015), so as to improve the cost-effectiveness of testing. However, none of these is applicable to the emerging crowd testing paradigm where task requesters typically have no control over online crowdworkers’s dynamic behavior and uncertain performance.
There are several researches focusing on studying the time-series models for measuring software reliability and predicting when to stop testing and release a software product (Garg et al., 2011, 2013; Iqbal et al., 2013). These researches have proposed different types of software reliability models to estimate the reliability of a software component for quality control purpose. Among them, we adopt two most promising models (i.e., Rayleigh’s defect arriving model and knee model) for the close prediction of crowdtesting.
Another body of previous researches aimed at optimizing software inspection, which also concerned predicting the total and remaining number of bugs. Eick et al. (Eick et al., 1992) reported the first work on employing capture-recapture models in software inspections to estimate the number of faults remaining in requirements and design artifacts. Following that, several researches focused on evaluating the influence of number of inspectors, the number of actual defects, the dependency within inspectors, the learning style of individual inspectors, on the capture-recapture estimators’ accuracy (Briand et al., 2000; Walia and Carver, 2009; H.Chun, 2006; Rong et al., 2017; Mandala et al., 2012; Goswami et al., 2015; Vitharana, 2017). The aforementioned approaches are based on different types of capture-recapture models, and results turned out MhJK, MhCH, and MtCH are the most effective estimators. We have reused all these estimators and experimentally evaluated them.
8. Conclusion
It is valuable to automatically decide when to close a crowdtesting task so as to improve the cost-effectiveness of crowdtesting. This paper first investigates the necessity and feasibility for close prediction of crowdtesting tasks. Then it designs 8 methods to conduct the close prediction, respectively based on the bug trend, bug arrival model, and capture-recapture model. Evaluations are based on 218 crowdtesting tasks from one of the largest crowdtesting platforms in China, and results show that a median of 91% bugs can be detected with 49% reduced cost.
This paper also provides a cautionary tale that verbatim reuse of methods from other fields may not produce the best results of crowdtesting. Specifically, we show the capture-recapture models from software inspections do not work well on crowdtesting data. Furthermore, the most straightforward method (i.e., Trend) can produce the most effective performance in close prediction of crowdtesting tasks.
It should be pointed out that the presented material is just the starting point of the work in progress. We are closely collaborating with BigCompany crowdtesting platform and begin to deploy the Trend and M0 method online. Returned results will further validate the effectiveness, as well as guide us in improving the methods.
References
- [1]
- lin [2018] 2018. http://www.softwaretestinghelp.com/crowdsourced-testing-companies/. (2018).
- Briand et al. [2000] L. C. Briand, K. El Emam, B. G. Freimut, and O. Laitenberger. 2000. A comprehensive evaluation of capture-recapture models for estimating software defect content. IEEE Transactions on Software Engineering 26, 6 (2000), 518–540.
- Brighton [2006] Henry Brighton. 2006. Robust Inference with Simple Cognitive Models. In AAAI spring symposium: Between a rock and a hard place: Cognitive science principles meet AI-hard problems. 17–22.
- Burnham and Overton [1978] Kenneth P Burnham and Walter Scott Overton. 1978. Estimation of the size of a closed population when capture probabilities vary among animals. Biometrika 65, 3 (1978), 625–633.
- Chao [1987] Anne Chao. 1987. Estimating the population size for capture-recapture data with unequal catchability. Biometrics (1987), 783–791.
- Chao [1988] Anne Chao. 1988. Estimating animal abundance with capture frequency data. The Journal of Wildlife Management (1988), 295–300.
- Chen and Kim [2012] Ning Chen and Sunghun Kim. 2012. Puzzle-based automatic testing: Bringing humans into the loop by solving puzzles. In Proceedings of the 27th IEEE/ACM International Conference on Automated Software Engineering. ACM, 140–149.
- Cormack and Grossman [2016] Gordon V Cormack and Maura R Grossman. 2016. Engineering quality and reliability in technology-assisted review. In Proceedings of the 39th International ACM SIGIR conference on Research and Development in Information Retrieval. ACM, 75–84.
- Cui et al. [2017b] Qiang Cui, Junjie Wang, Guowei Yang, Miao Xie, Qing Wang, and Mingshu Li. 2017b. Who Should Be Selected to Perform a Task in Crowdsourced Testing?. In Computer Software and Applications Conference (COMPSAC), 2017 IEEE 41st Annual, Vol. 1. IEEE, 75–84.
- Cui et al. [2017a] Qiang Cui, Song Wang, Junjie Wang, Yuanzhe Hu, Qing Wang, and Mingshu Li. 2017a. Multi-Objective Crowd Worker Selection in Crowdsourced Testing. In 29th International Conference on Software Engineering and Knowledge Engineering (SEKE). 218–223.
- Eick et al. [1992] Stephen G Eick, Clive R Loader, M David Long, Lawrence G Votta, and Scott Vander Wiel. 1992. Estimating software fault content before coding. In Proceedings of the 14th international conference on Software engineering. 59–65.
- Epitropakis et al. [2015] Michael G Epitropakis, Shin Yoo, Mark Harman, and Edmund K Burke. 2015. Empirical evaluation of pareto efficient multi-objective regression test case prioritisation. In Proceedings of the 2015 International Symposium on Software Testing and Analysis. ACM, 234–245.
- Feng et al. [2015] Yang Feng, Zhenyu Chen, James A Jones, Chunrong Fang, and Baowen Xu. 2015. Test report prioritization to assist crowdsourced testing.. In Proceedings of the 2015 10th Joint Meeting on Foundations of Software Engineering. 225–236.
- Feng et al. [2016] Yang Feng, James A Jones, Zhenyu Chen, and Chunrong Fang. 2016. Multi-objective test report prioritization using image understanding. In Automated Software Engineering (ASE), 2016 31st IEEE/ACM International Conference on. IEEE, 202–213.
- Fu and Menzies [2017] Wei Fu and Tim Menzies. 2017. Easy over hard: a case study on deep learning. In Proceedings of the 2017 11th Joint Meeting on Foundations of Software Engineering. ACM, 49–60.
- Garg et al. [2011] Mohit Garg, Richard Lai, and S Jen Huang. 2011. When to stop testing: a study from the perspective of software reliability models. IET software 5, 3 (2011), 263–273.
- Garg et al. [2013] M Garg, R Lai, and PK Kapur. 2013. A method for selecting a model to estimate the reliability of a software component in a dynamic system. In Software Engineering Conference (ASWEC), 2013 22nd Australian. IEEE, 40–50.
- Gómez et al. [2016] María Gómez, Romain Rouvoy, Bram Adams, and Lionel Seinturier. 2016. Reproducing context-sensitive crashes of mobile apps using crowdsourced monitoring. In Mobile Software Engineering and Systems (MOBILESoft), 2016 IEEE/ACM International Conference on. IEEE, 88–99.
- Gomide et al. [2014] V. H. M. Gomide, P. A. Valle, J. O. Ferreira, J. R. G. Barbosa, A. F. da Rocha, and T. M. G. d. A. Barbosa. 2014. Affective crowdsourcing applied to usability testing. Int. J. of Computer Science and Information Technologies 5, 1 (2014), 575–579.
- Goswami et al. [2015] Anurag Goswami, Gursimran Walia, and Abhinav Singh. 2015. Using Learning Styles of Software Professionals to Improve their Inspection Team Performance. International Journal of Software Engineering and Knowledge Engineering 25, 09-10 (2015), 1721–1726.
- H.Chun [2006] Young H.Chun. 2006. Estimating the number of undetected software errors via the correlated capture-recapture model. European Journal of Operational Research 175, 2 (2006), 1180 – 1192.
- Henard et al. [2016] Christopher Henard, Mike Papadakis, Mark Harman, Yue Jia, and Yves Le Traon. 2016. Comparing white-box and black-box test prioritization. In Software Engineering (ICSE), 2016 IEEE/ACM 38th International Conference on. IEEE, 523–534.
- Iqbal et al. [2013] Javaid Iqbal, N Ahmad, and SMK Quadri. 2013. A software reliability growth model with two types of learning. In Machine Intelligence and Research Advancement (ICMIRA), 2013 International Conference on. IEEE, 498–503.
- Jiang et al. [2018] He Jiang, Xin Chen, Tieke He, Zhenyu Chen, and Xiaochen Li. 2018. Fuzzy Clustering of Crowdsourced Test Reports for Apps. ACM Transactions on Internet Technology (TOIT) 18, 2 (2018), 18.
- Kan [2002] Stephen H Kan. 2002. Metrics and models in software quality engineering. Addison-Wesley Longman Publishing Co., Inc.
- Laplace [1783] Pierre S Laplace. 1783. Sur les naissances, les mariages et les morts. Histaire de I’Academie Royale des Sciences (1783), 693.
- Lee [1996] Shen-Ming Lee. 1996. Estimating population size for capture-recapture data when capture probabilities vary by time, behavior and individual animal. Communications in Statistics-Simulation and Computation 25, 2 (1996), 431–457.
- Lewis [2016] William E Lewis. 2016. Software testing and continuous quality improvement. CRC press.
- Liu et al. [2015] Gaoxuan Liu, Guoping Rong, He Zhang, and Qi Shan. 2015. The adoption of capture-recapture in software engineering: a systematic literature review. In Proceedings of the 19th International Conference on Evaluation and Assessment in Software Engineering. ACM, 15.
- Lyu et al. [1996] Michael R Lyu et al. 1996. Handbook of software reliability engineering. (1996).
- Mandala et al. [2012] Narendar R. Mandala, Gursimran S. Walia, Jeffrey C. Carver, and Nachiappan Nagappan. 2012. Application of Kusumoto Cost-metric to Evaluate the Cost Effectiveness of Software Inspections. In Proceedings of the ACM-IEEE International Symposium on Empirical Software Engineering and Measurement (ESEM ’12). 221–230.
- Mao et al. [2017] Ke Mao, Licia Capra, Mark Harman, and Yue Jia. 2017. A survey of the use of crowdsourcing in software engineering. Journal of Systems and Software 126 (2017), 57–84.
- Menzies et al. [2007] Tim Menzies, Jeremy Greenwald, and Art Frank. 2007. Data mining static code attributes to learn defect predictors. IEEE transactions on software engineering 33, 1 (2007), 2–13.
- Musson et al. [2013] R. Musson, J. Richards, D. Fisher, C. Bird, B. Bussone, and S. Ganguly. 2013. Leveraging the Crowd: How 48,000 Users Helped Improve Lync Performance. IEEE Software 30, 4 (2013), 38–45.
- Myers et al. [2011] Glenford J Myers, Corey Sandler, and Tom Badgett. 2011. The art of software testing. John Wiley & Sons.
- Nam et al. [2017] Jaechang Nam, Wei Fu, Sunghun Kim, Tim Menzies, and Lin Tan. 2017. Heterogeneous defect prediction. IEEE Transactions on Software Engineering (2017).
- Panichella et al. [2015] Annibale Panichella, Rocco Oliveto, Massimiliano Di Penta, and Andrea De Lucia. 2015. Improving multi-objective test case selection by injecting diversity in genetic algorithms. IEEE Transactions on Software Engineering 41, 4 (2015), 358–383.
- Rong et al. [2017] Guoping Rong, Bohan Liu, He Zhang, Qiuping Zhang, and Dong Shao. 2017. Towards Confidence with Capture-recapture Estimation: An Exploratory Study of Dependence Within Inspections. In Proceedings of the 21st International Conference on Evaluation and Assessment in Software Engineering (EASE’17). 242–251.
- Saha et al. [2015] Ripon K Saha, Lingming Zhang, Sarfraz Khurshid, and Dewayne E Perry. 2015. An information retrieval approach for regression test prioritization based on program changes. In Software Engineering (ICSE), 2015 IEEE/ACM 37th IEEE International Conference on, Vol. 1. IEEE, 268–279.
- Shi et al. [2015] August Shi, Tifany Yung, Alex Gyori, and Darko Marinov. 2015. Comparing and combining test-suite reduction and regression test selection. In Proceedings of the 2015 10th Joint Meeting on Foundations of Software Engineering. ACM, 237–247.
- Vitharana [2017] Padmal Vitharana. 2017. Defect propagation at the project-level: results and a post-hoc analysis on inspection efficiency. Empirical Software Engineering 22, 1 (2017), 57–79.
- Walia and Carver [2009] G. S. Walia and J. C. Carver. 2009. Evaluating the Effect of the Number of Naturally Occurring Faults on the Estimates Produced by Capture-Recapture Models. In 2009 International Conference on Software Testing Verification and Validation. 210–219.
- Wang et al. [2016a] Junjie Wang, Qiang Cui, Qing Wang, and Song Wang. 2016a. Towards effectively test report classification to assist crowdsourced testing. In Proceedings of the 10th ACM/IEEE International Symposium on Empirical Software Engineering and Measurement. ACM, 6.
- Wang et al. [2017a] Junjie Wang, Qiang Cui, Song Wang, and Qing Wang. 2017a. Domain adaptation for test report classification in crowdsourced testing. In Proceedings of the 39th International Conference on Software Engineering: Software Engineering in Practice Track. IEEE Press, 83–92.
- Wang et al. [2016b] Junjie Wang, Song Wang, Qiang Cui, and Qing Wang. 2016b. Local-based active classification of test report to assist crowdsourced testing. In Automated Software Engineering (ASE), 2016 31st International Conference on. IEEE, 190–201.
- Wang et al. [2017b] Song Wang, Jaechang Nam, and Lin Tan. 2017b. QTEP: quality-aware test case prioritization. In Proceedings of the 2017 11th Joint Meeting on Foundations of Software Engineering. ACM, 523–534.
- Witten and Frank [2005] Ian H Witten and Eibe Frank. 2005. Data Mining: Practical machine learning tools and techniques. Morgan Kaufmann.
- Xie et al. [2017] Miao Xie, Qing Wang, Guowei Yang, and Mingshu Li. 2017. COCOON: Crowdsourced Testing Quality Maximization Under Context Coverage Constraint. In 2017 IEEE 28th International Symposium on Software Reliability Engineering (ISSRE). IEEE, 316–327.
- Yamada [2014] Shigeru Yamada. 2014. Software reliability modeling: fundamentals and applications. Vol. 5. Springer.
- Zhang et al. [2018] Xiaofang Zhang, Yang Feng, Di Liu, Zhenyu Chen, and Baowen Xu. 2018. Research Progress of Crowdsourced Software Testing. Journal of Software 29(1) (2018), 69–88.