First metallicity determination from Near-Infrared spectra for five obscured Cepheids discovered in the inner Disk.
Abstract
We report the discovery from our IRSF/SIRIUS Near-Infrared (NIR) variability survey of five new classical Cepheids located in the inner Galactic Disk, at longitude . The new Cepheids are unique in probing the kinematics and metallicity of young stars at the transition between the inner Disk and the minor axis of the central Bar, where they are expected to be less affected by its dynamical influence. This is also the first time that metallicity of Cepheids is estimated on the basis of medium-resolution () NIR spectra, and we validated our results with data in the literature, finding a minimal dependence on the adopted spectroscopic diagnostics. This result is very promising for using Cepheids as stellar proxy of the present-time chemical content of the obscured regions in the Disk. We found that the three Cepheids within 8–10 kpc from us have metallicities consistent with the mean radial metallicity gradient, and kinematics consistent with the Galactic rotation curve. Instead, the closest (4 kpc)/farthest (12 kpc) Cepheids have significant negative/positive residuals, both in velocity and in iron content. We discuss the possibility that such residuals are related to large-scale dynamical instabilities, induced by the bar/spiral-arm pattern, but the current sample is too limited to reach firm conclusions.
keywords:
stars: variables: Cepheids – Galaxy: abundances – Galaxy: kinematics and dynamics1 Introduction
A comprehensive empirical characterisation of the present-time Milky Way (MW) disk is pivotal to pursue a full understanding of the formation history of our Galaxy. While the structure of its central components, such as the Bar and the Bulge, have been recently unveiled by large-scale surveys, their dynamical interplay and their mixing with the underlying disk-component remains poorly understood. The inner Disk, defined as the region within a Galactocentric distance () from 4 to 7 kpc (Feltzing & Chiba, 2013), is the Galactic locus where all these components coexist and, likely, interact. On the basis of stellar counts and photometric surveys, it is now well established that within the inner Disk lies the interface between the Disk, its inner spiral-arms and the long Bar, with a half length of 5 kpc (see e.g. Bland-Hawthorn & Gerhard, 2016, for a recent review on the Galactic Bar and Bulge), but it is still unclear e.g. where the Bars’ ends and resonances are located (Benjamin et al., 2005), wether there is a central molecular ring (Heyer & Dame, 2015) and which mechanism triggers the intense star-forming activity found e.g. in W43 (Bally et al., 2010), etc.
Moreover, the inner Disk is expected to be strongly affected by the bar-driven dynamical instabilities (Rix & Bovy, 2013), which impact both its kinematics and the chemical enrichment, and therefore the observed radial metallicity gradient. Indeed, gas-phase metallicity gradients in barred external galaxies are systematically shallower than the ones in un-barred galaxies, as supported by empirical (e.g. Zaritsky et al., 1994; Allard et al., 2006) and theoretical investigations (e.g. Athanassoula, 1992; Friedli & Benz, 1995; Minchev et al., 2013), while the stellar-phase shows a higher degree of complexity (e.g. Sánchez-Blázquez et al., 2011). In the generally accepted inside-out infall scenario of the Galactic-disk evolution (Chiappini et al., 1997), the radial migration induced by the Bar’s instabilities produces a smoothing of the metallicity content in the inner Disk. At the same time, the Bar’s resonances allow a pile-up of fresh material from inflowing gas, which produces hot-spots of star-formation activity, where local enrichment can occur. The end-product of this mechanism is the presence of an azimuthal metallicity gradient (e.g. Khoperskov et al., 2018, and reference therein).
Despite the relevance of the role played by the inner Disk in the Galactic evolution, its kinematics and chemical content has not been empirically constrained yet, as a consequence of the significant dust extinction towards the Galactic plane, which makes observations challenging at low latitudes. There are a few studies based on bright hot stars (e.g. OB stars, Daflon & Cunha, 2004), while more investigations focused on the use of star clusters (e.g. Jacobson et al., 2016) to trace the chemical pattern of the inner Galaxy.
In this context, Classical Cepheids are the best-suited stellar probes, as they are so luminous that can be seen at distances larger than 8 kpc from us, even through substantive dust extinction, and their individual distances and ages can be precisely determined on the basis of their pulsation periods. They are very young stars (ages 200 Myr Bono et al., 2005), but they have lower effective Temperature (T 6,000K) with respect to to other stars of similar age and hence their spectra, rich in metal absorption lines, allow for precise abundance determinations of many different chemical elements (e.g. da Silva et al., 2016, and references therein).
Indeed, works based on the chemical abundances of Cepheids within 4–7 kpc from the Galactic Center, have shown that the metallicity gradient steepens in the inner Disk (Andrievsky et al., 2002; Pedicelli et al., 2010; Luck et al., 2011; Genovali et al., 2013), and it can reach super solar metallicity of 0.4 dex at R2.5 kpc (Martin et al., 2015; Andrievsky et al., 2016). However, such investigations rely on only a few Cepheids (5) at galactocentric radius of 5 kpc, and thus at the transition with the Bar.
In fact, the number of Cepheids currently known in inner regions of the Disk (Metzger & Schechter, 1998, Fig. 11) is still limited with respect to the ones found in the solar neighbourhood, because variability surveys, traditionally performed in the optical bands, were strongly hampered by dust extinction towards the Galactic Center. Even the ongoing Gaia space mission will suffer from severe limitations in the Galactic plane, where its capability of detecting variables brighter than 20 mag (G-band), will translate to Galactocentric distances 6 kpc due to extinction (Windmark et al., 2011). Near-infrared (NIR) variability surveys have instead the capability to probe the innermost regions of the Galaxy by overcoming the thorny problems of the high extinction and the differential reddening.
In particular, our NIR survey towards the Galactic plane (Matsunaga et al., 2011), started in 2007 at the Japanese Infrared Survey Facility (IRSF), pioneered the search for distant Cepheids in the NIR bands and led to the discovery of four new Cepheids located in the Nuclear Bulge (Matsunaga et al., 2011, 2015), 13 new Cepheids beyond the Galactic Center (Matsunaga et al., 2016) and three new Cepheids within R kpc in the Northern inner Disk (Tanioka et al., 2017). At the same time, NIR data collected by the ESO public survey VVV (VISTA survey of the Via Lactea Minniti et al., 2010) also reported the discovery of additional 24 Cepheids located beyond the GC (Dékány et al., 2015a, b). However, determining the chemical abundances of the Cepheids identified by such NIR surveys also requires the use of NIR spectroscopy, which remains challenging for dynamical supergiant stars like Cepheids. In fact, while abundance determination of Cepheids based on optical spectra is well established, the NIR regime is still in its infancy, and a very limited background study is available in the literature (see e.g. Sasselov & Lester, 1990; Nardetto et al., 2011).
In this paper, we report the discovery of five new Cepheids located in the inner Disk, at longitudes degrees and close to the minor axis of the central Bar. As a follow up of the photometric observations, we collected medium-resolution (R3,000) NIR spectra with ISAAC@VLT for all the new Cepheids and we were able to determine their kinematics and iron abundances. The new Cepheids are the first ever detected in this region of the Disk and allow us to investigate the kinematics and chemical content of young stars in such crucial transition region.
The paper is organised as follows. In Section 2, we describe our photometric survey, the photometric data and data-reduction, and we present the NIR light-curves of the new Cepheids, together with their distance estimates (Section 2.1). Then, we describe the spectroscopic data-set in Section 3, and the analysis techniques for optical and NIR spectra, including the calibration of an homogenous metallicity abundance scale and the determination of the Cepheids’ velocities. We investigate the kinematics of the new Cepheids in the inner Disk in Section 4, and their metallicity as a function of galactocentric radius (Section 5.1) and azimuthal angle (Section 5.2). Finally, in Section 6, we summarise and discuss our results in the context of the Galactic disk evolution.
2 Observation and detection of the new Cepheids
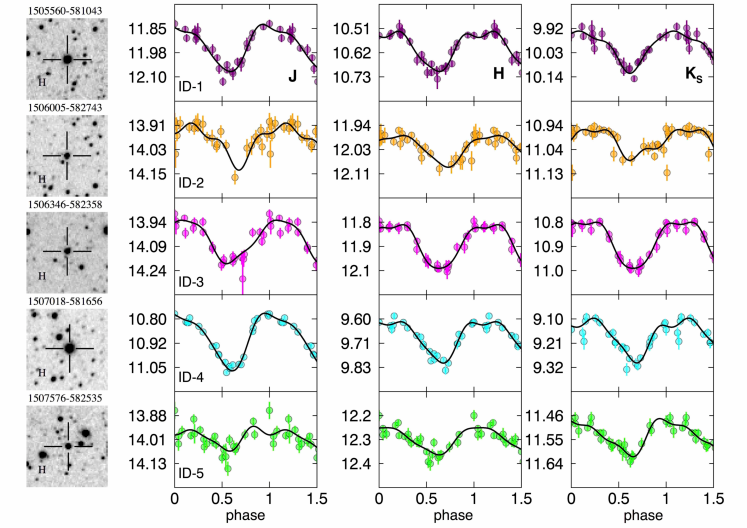
We conducted a NIR survey in the Galactic plane towards the line of sights = -20∘, -30∘ and -40∘ with the IRSF 1.4m telescope and the SIRIUS camera, which takes images in the three NIR bands (1.25 m), (1.64 m) and (2.14 m) simultaneously (Nagashima et al., 1999; Nagayama et al., 2003). The instrumental field of view is about 7.7’ 7.7’, with a pixel scale of 0.45"/pix. Between 2007 and 2009, thirty to forty observations have been performed for nine fields along the selected lines of sight. For each direction, we carried out monitoring observations for a 20’ 20’ area, covered by a 33 IRSF/SIRIUS fields of view. To obtain the photometry of the stars in these fields, we applied the same analysis presented in Matsunaga et al. (2009). After the pipeline reduction we carried out point-spread-function (PSF) fitting photometry using the DAOPHOT package in IRAF111IRAF – Imaging Reduction and Analysis Facility– is distributed by the National Optical Astronomy Observatory, which is operated by the Association of Universities for Research in Astronomy, Inc., under cooperative agreement with the National Science Foundation http://iraf.noao.edu/. Among all the images collected in each filter, the one characterised by the best condition (sky transparency and seeing) was selected as a reference frame for all the other observations of the same field. The photometric results of this reference frame were compared with the 2 Micron All-sky Survey (2MASS) point source catalogue (Skrutskie et al., 2006) in order to standardise the magnitudes. The reference frame has then been adopted to calibrate the remaining images of the same field. Thus, we created a master list of objects detected in each image, and we searched for their variability by adopting the same technique described in Matsunaga et al. (2013). This technique identifies the stars for which the variation in magnitude is larger then three times the standard deviation computed on all the images of the same object in a given filter. Among the many variable stars discovered (100, Matsunaga et al., in prep), we found five objects for which the light-curve shape is compatible with the ones of Classical Cepheids. These Cepheids are the first ones ever detected in the IV Galactic quadrant () and in the inner Disk (ID), and thus have been renamed ID-1, ID-2, ID-3, ID-4 and ID-5, in order of increasing Right Ascension.
| Name | RA | Dec | Period | |||
|---|---|---|---|---|---|---|
| [] | [] | [days] | [mag] | [mag] | [mag] | |
| ID-1 [purple] | 15:05:55.61 | -58:10:43.5 | 9.036 | 11.939 0.003 | 10.596 0.003 | 10.005 0.004 |
| ID-2 [magenta] | 15:06:00.57 | -58:27:43.3 | 10.26 | 13.985 0.007 | 12.024 0.005 | 11.007 0.005 |
| ID-3 [orange] | 15:06:34.67 | -58:23:58.1 | 9.996 | 14.045 0.005 | 11.938 0.004 | 10.873 0.003 |
| ID-4 [cyan] | 15:07:01.83 | -58:16:56.1 | 6.644 | 10.891 0.001 | 9.685 0.001 | 9.178 0.003 |
| ID-5 [lime] | 15:07:57.59 | -58:25 :5.7 | 4.407 | 13.991 0.005 | 12.317 0.005 | 11.533 0.01 |
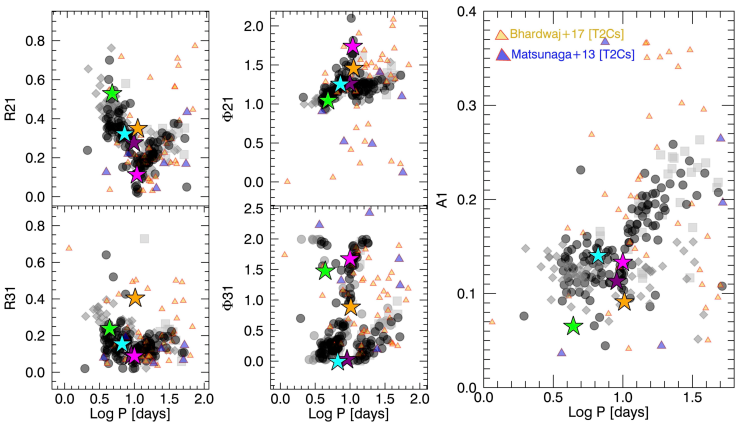
We estimated the period of the new identified Cepheids by performing a fourth-order Fourier series fitting to the photometric data. The , and band light-curves of the new Cepheids together with their analytical fits are shown in Figure 1 (ID-1: purple, ID-2: light red; ID-3: magenta, ID-4: cyan, ID-5: lime) and the resulting flux-averaged magnitudes in each band are listed in Table 1. The error bars show the photometric errors, which range from 0.01 mag (at 11 mag) to 0.1 mag (at 16 mag). The -band light-curves of the new Cepheids show indeed features typical of known Classical Cepheids with similar periods, such as e.g. the appearance of a bump on the rising branch related to the so-called Hertzsprung Progression starting at period 7 days (Inno et al., 2015). In order to properly quantify these proprieties, we determined the Fourier parameters of the -band light-curves: , ,,, as defined by Simon & Lee (1981). These parameters are listed in Table 2 and shown in Figure 2, where they are compared to the ones of known Cepheids in the Milky Way (Laney & Stobie, 1992; Monson & Pierce, 2011, dark dots), as well as in the Large (Persson et al., 2004, light grey squares) and in the Small Magellanic Cloud (Inno et al., 2015, grey diamonds). Unfortunately, extensive datasets of -band light-curves for Type 2 Cepheids are not available in the literature, thus it is difficult to obtain accurate Fourier parameters of these variables. However, we included the available data for Type 2 Cepheids towards the Galactic Center (Matsunaga et al., 2013, purple triangles), and in the Large Magellanic Cloud (LMC, Bhardwaj et al., 2017; Macri et al., 2015, yellow triangles) . Even though there is some marginal overlapping for some of the Fourier parameters between population 1 and 2 Cepheids, when considered altogether, the parameters of the new variables are only compatible with the ones of known classical Cepheids, thus further confirming our classification.
| Name | A1 | R21 | R31 | ||
|---|---|---|---|---|---|
| [mag] | |||||
| ID-1 | 0.113 | 0.276 | 0.092 | 1.26 | 0.02 |
| ID-2 | 0.091 | 0.349 | 0.404 | 1.45 | 0.88 |
| ID-3 | 0.133 | 0.112 | 0.087 | 1.74 | 1.67 |
| ID-4 | 0.140 | 0.321 | 0.153 | 1.25 | -0.01 |
| ID-5 | 0.065 | 0.528 | 0.237 | 1.04 | 1.47 |
2.1 The Cepheid Galactocentric distances
The multi-wavelength observations of the new Cepheids allow for a simultaneous determination of their distances and extinction by using Period-Luminosity (PL) relations in two different bands and by computing the corresponding selective extinction coefficients on the basis of the assumed extinction law. However, recent works (e.g. Nataf et al., 2016; Schlafly et al., 2016; Majaess et al., 2016) have shown that the extinction law in the Milky Way is patchy and can vary as a function of the line-of-sight, even in the NIR regime. Such uncertainty on the adopted extinction law strongly impacts Cepheids’ distance determinations, especially in highly obscured Galactic regions, as extensively discussed e.g. in Matsunaga et al. (2018, subm). As described in Tanioka et al. (2017), we can use the extinction laws by Cardelli et al. (1989, hereinafter C89) and by Nishiyama et al. (2006, hereinafter N06) to determine our best estimates of the Cepheids’ distances and the likely maximum uncertainties. In fact, the published values of the exponent for the power law used to model the extinction, mostly range between the two values determined by these two authors, namely 1.61 (C89) and 1.99 (N06). We use a similar approach here: in order to determine the true distance modulus and extinction, we adopt the PL relations in the and bands estimated by Inno et al. (2016) for the LMC Cepheids, calibrated by assuming a mean distance modulus to the LMC: 18.493 0.008 0.047 mag (Pietrzyński et al., 2013) and transformed into the IRSF photometric system (Kato et al., 2007). In fact, the true distance modulus, defined as:
| (1) |
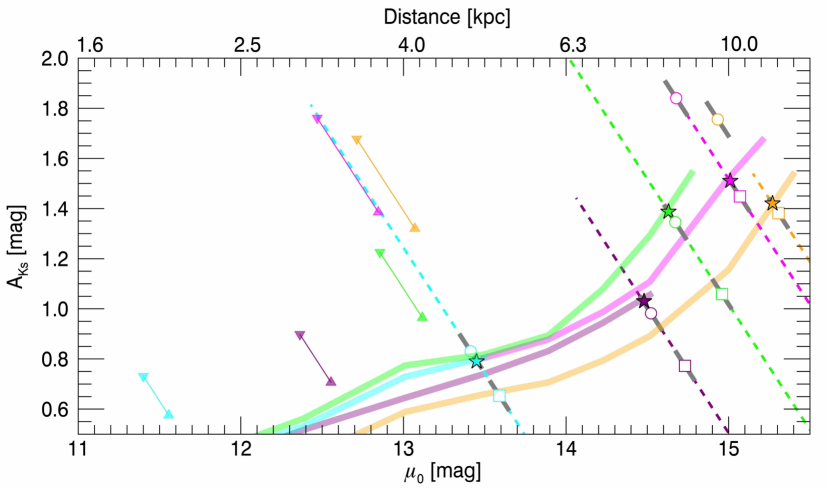
can be derived on the basis of the apparent distance modulus: , and the selective absorption in the -band: , by assuming first the coefficient by C89, and then by N06. The values obtained for the same Cepheids with the different extinction laws are listed in column 2 and 4 of Table 3 and they differ from 0.2 mag (ID-1,4) up to 0.4 mag (ID-2,3), or 16% in distance, which is considered as our conservative systematic uncertainty. However, in order to determine our best estimates, instead of adopting the mean values, we use a comparison with the distances determined on the basis of a three-dimensional dust map. In fact, Drimmel et al. (2003) computed such a map for the fourth Galactic Quadrant, where the new Cepheids are located, and Bovy et al. (2016, hereinafter B16) incorporated it in a comprehensive Galactic extinction map. Thus, we used the B16 code to determine the amount of selective absorption in the visual band for the five line-of-sights where the new Cepheids are located and at different distances. Note the dust map computed by Drimmel et al. (2003) rely on the dust emission in the Far-Infrared as measured by the COBE/DIRBE mission, on an assumed model for the Galactic structure, and marginally on the choice of the extinction law, which is necessary to derive the opacity from the optical depth along the line of sight (see Eq. 24 in Drimmel & Spergel, 2001). Thus, the map does not allow us to obtain a new determination of the Cepheids’ distances completely independent of the extinction law. However, Drimmel et al. (2003) adopted the extinction law by Rieke & Lebofsky (1985) and internally validated their choice by comparing the extinction predicted with the one measured for red-clump and OB stars in the inner and outer Galaxy. Here, we adopt the coefficient by C89, in order to extrapolate = in the IRSF photometric system, but the difference between the coefficients should be small (less then 1%). This is necessary because Rieke & Lebofsky (1985) do not provide a general function for the extinction curve which could be extrapolated to different wavelengths, but they only provide =0.112 . The values of obtained from the dust map as a function of the true distance modulus is shown as a thick solid line in Figure 3 for the five line-of-sights where the Cepheids are located (same colors as in Figure 1). The lines =constant for each Cepheid are indicated by the dashed lines in Figure 3, and their intersections with the solid lines of the corresponding colors, highlighted by the stars, determine the true distance modulus obtained on the basis of the extinction map (see Table 3). In Figure 3 we also show the distances derived on the basis of the , bands PL relations, and assuming the C89 (empty circles) and the N06 (empty squares) coefficients, together with the associated errors, indicated by the grey error-bars. Note that the distance values can only change according to the dashed lines, and by assuming that the extinction law cannot be shallower then the C89 in the inner Galaxy, we consider the empty circles as the minimum possible distance for the five new Cepheids. Similarly, we cannot expect them to be any further of the distances indicated by the empty squares.
More specifically, the data plotted in this Figure show that for Cepheids: ID-1, ID-4 and ID-5, the use of C89 reddening law provide values that are closer to the prediction from the dust map, and thus we adopt them as as our best estimates. For Cepheids ID-2 and ID-3, instead, the N06 law gives values more consistent with what is predicted by the map, and we decided to take them as the best estimates for these Cepheids. The final adopted distances and their associated errors are given in the last column of Table 3. On the basis of these distances, and by assuming a -band PL relation, we can also obtain the best estimate of the extinction coefficient for each of the Cepheids, and we find that it is close to the C89 value (0.40) for two of them, while it attains slightly larger values than the one by N06 (0.33) for the others, thus confirming that the slope of the extinction law in this direction is likely in between the two.
The coloured triangles show the values of extinction and distances for new variables in the case they are Type 2 Cepheids. Also in this case, we assumed the PL relations by Bhardwaj et al. (2017) in the and bands calibrated to the LMC distance, and the coefficients first from C89 (triangles up) and N06 (triangles down). The values of distances and extinction obtained are inconsistent with the absorption along the line-of-sight as predicted by the dust map. Thus, this hypothesis can be discarded. However, Cepheids ID-4 and ID-5 have short periods, thus they could be classical Cepheids but pulsating in the first overtone. In this case, they would be intrinsically brighter of 0.5 mag (see e.g. Feast & Whitelock, 1997; Kovtyukh et al., 2016), and therefore 1 kpc further. However, first-overtone pulsators are characterised by a different range of Fourier parameters and by smooth sinusoidal light-curves, without the bumps clearly visible on the rising branch of the light-curves in Figure 1.
| Name | Distance(d) | |||||||
| [mag] | [mag] | [mag] | [mag] | mag] | [mag] | [kpc] | ||
| ID-1 | 14.52 0.06 | 0.98 | 14.73 0.05 | 0.77 | 14.48 | 1.0 | 7.9 | 0.41 |
| ID-2 | 14.93 0.06 | 1.76 | 15.31 0.05 | 1.38 | 15.27 | 1.5 | 11.5 | 0.36 |
| ID-3 | 14.68 0.06 | 1.84 | 15.07 0.05 | 1.45 | 15.01 | 1.5 | 10.5 | 0.36 |
| ID-4 | 13.42 0.06 | 0.83 | 13.59 0.15 | 0.65 | 13.45 | 0.8 | 4.8 | 0.37 |
| ID-5 | 14.67 0.06 | 1.35 | 14.95 0.15 | 1.06 | 14.63 | 1.4 | 8.7 | 0.40 |
| (a) Based on the extinction law by Cardelli et al. (1989) and -,-band PL relations. | ||||||||
| (b) Based on the extinction law by Nishiyama et al. (2006) and -,-band PL relations. | ||||||||
| (c) Based on the dust map by Bovy et al. (2016) and -band PL relation. | ||||||||
| (d) The best distance estimates according to data shown in Figure 3 with the associated total (random and systematic) uncertainty. | ||||||||
| (e) Extinction coefficients determined on the basis of our best distances. | ||||||||
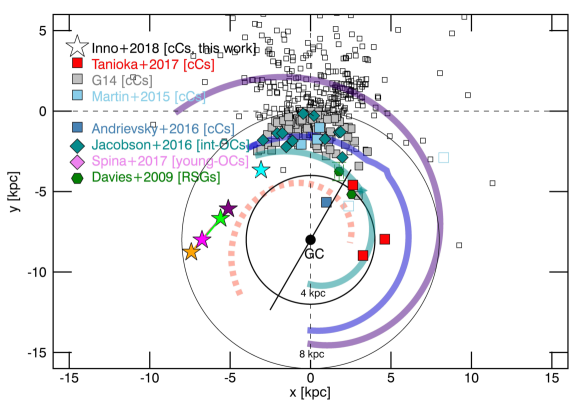
The position of the new Cepheids, projected onto the Galactic plane is shown in Figure 4. We used a cylindrical coordinate system centred on the Sun position, which is located at a distance from the Galactic center: =7.940.370.26 kpc (Groenewegen et al., 2008; Matsunaga et al., 2013, and references therein). We also show the position of all the known Galactic Cepheids for which homogenous metallicity were estimated by our group222We removed BC Aql from the sample, because a recent improved coverage of its optical light curve indicates it is a Type 2 Cepheid (see the AAVSO website at http://www.aavso.org/vsx/ for more details) (gray diamonds, Genovali et al., 2014, hereinafter G14), by Martin et al. (2015, blue squares) and by Andrievsky et al. (2016, ASAS181024–2049.6, blue diamond). Filled symbols indicate all the objects in the inner Disk, defined as the region within 2.5 and 8 kpc from the Galactic Center within 250 pc from the Galactic plane. Note that we do not include here the Cepheids found beyond the Galactic Center by Matsunaga et al. (2016); Dékány et al. (2015a, b) as there is no spectroscopic observations for them available in the literature, thus they are not relevant for the present discussion.
In order to investigate possible correlations between the new Cepheids’ position and the spiral arms of our Galaxy, we also plot their distribution according to Reid et al. (2016), including the Scutum (dark-cyan line), the Sagittarius (violet line) and the Perseus (indigo line) arms. We also show the expected location of the Norma arm according to a 4-arm logarithmic spiral model in red, but the exact morphology of the spiral arms in the fourth Galactic quadrant is still very uncertain (Vallée, 2017). The position of the Red Supergiant clusters RSC1 and RSC2 discovered by Davies et al. (2009b) is also shown, since they are located at similar galactocentric distances with respect to the new Cepheids, but at positive , therefore close to the edge of the Galactic bar. Finally, the position of 5 young ( 100 Myr, Spina et al., 2017, magenta diamonds) and 12 intermediate-age (100 Myr, Jacobson et al., 2016, dark-cyan diamonds) Open Clusters (OCs) investigated by the Gaia-ESO survey is also shown for comparison.
By using the Period-Age relation determined by Bono et al. (2005), we can determine the individual ages of the new Cepheids and we found that three of them have ages of about 45 Myr, while ID-4 and ID-5 are about 20 Myr older. Thus, only the young OCs and the RSCs have ages comparable to the ones of the Cepheids.
3 The Spectroscopic Data-set
During the semester March–September 2013, we collected NIR spectra with ISAAC at VLT for all the new Cepheids discovered in the inner Disk and for the Cepheid V367 Sct, which we adopt as a calibrating Cepheid to compare metallicity abundances based on NIR spectroscopy with the one derived from optical spectra. We adopted the medium-resolution (R3,100) spectroscopic (SWS1_MR) grism with the central wavelength =1.185 .
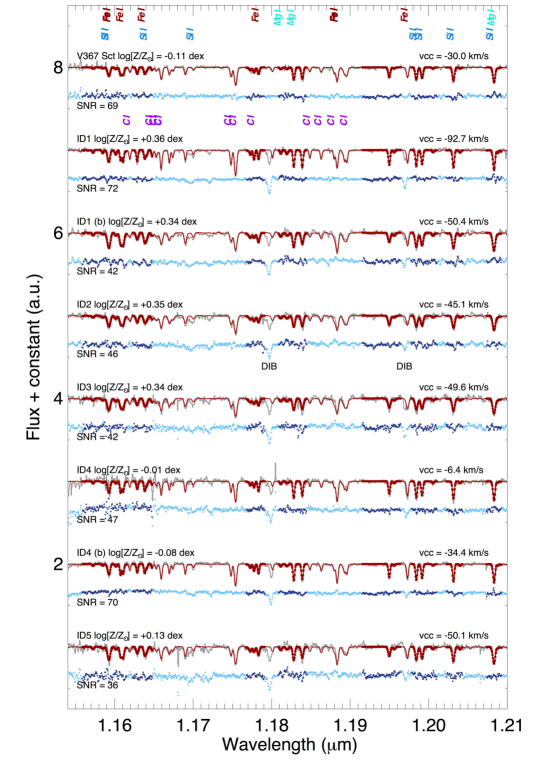
We have retrieved the raw files from the ESO Science Archive Facility, using the CalSelector option to associate the appropriate calibration files to the science ones. Due to the ABBA observing strategy, the sky subtraction has been done in the usual A-B/B-A way. Spectra extraction on the single frame has been accomplished using apall. The extracted spectra were then normalised via the continuum step in IRAF. The wavelength solution has been directly derived from the telluric standards, using as a primary reference a template absorption spectrum obtained from the ESO software Skycalc333http://www.eso.org/observing/etc/bin/gen/form?INS.MODE=swspectr+INS.NAME=SKYCALC. The target spectra were then cross-correlated with the wavelength calibrated telluric (in pixels) and shifted accordingly. This allows both the telluric correction and wavelength calibration of the targets. The reduced spectra were then corrected for atmospheric absorption features by adopting Molecfit, which is a software developed by the Institute for Astro- and Particle Physics at the University of Innsbruck for ESO. This tool is based on synthetic transmission spectra which can then be directly fitted to the observed spectra. Finally, the spectral analysis has been performed by adopting a novel technique we recently developed. This technique is based on existing precomputed grids of synthetic LTE spectra based on the MARCS code. The stellar parameters and abundances are then obtained by a best-fitting of the synthetic to the observed spectra, where the fit is performed through a sophisticated automated analysis procedure based on Monte Carlo Markov Chain techniques. The spectra reduced and corrected for the telluric lines are shown in Figure 5 together with the identification of some of the lines used for the metallicity estimate, while the physical parameters measured are listed in Table 5. Note that in the case of ID-1 and ID-4, we had two independent observations at two different pulsation phase, so we adopted the mean of the metallicity obtained from the two spectra, weighted for their SNR.
Some of the metal lines identified and used for performing the fit with the synthetic models are labelled in Figure 5. Note that there are also several intense DIBs (Diffuse Interstellar bands) present in the spectra of the new highly-obscured Cepheids, which are not visible instead in the spectrum of the calibrator V365 Sct. Excluding the most prominent one at 1.18 (Joblin et al., 1990), that is already known, the other DIBs are rarely observed, because the line-of-sight extinction is not high enough. This is the case of the structures centred around 1.17 microns and the one at 1.20 microns.
| Name | Epoch | SNR | [Fe/H] | RG | |||||||
| MJD | [] | [km s-1] | [dex] | [kpc] | [km s-1] | [km s-1] | [km s-1] | ||||
| ID-1 | 6527.484 | 0.77 | 72 | 6738 | 2.12 | 6.4 | 0.36 0.15 | 5.5 | -70 1 | -60 5 | -80 10 |
| ID-1 | 6407.688 | 0.51 | 42 | 6000 | 1.88 | 5.6 | 0.34 0.15 | -61 1 | |||
| ID-2 | 6407.723 | 0.51 | 46 | 6290 | 1.64 | 5.2 | 0.35 0.15 | 7.5 | -56 1 | -52 5 | -19 10 |
| ID-3 | 6407.773 | 0.83 | 42 | 6227 | 1.64 | 5.2 | 0.34 0.15 | 6.8 | -60 1 | -50 5 | -41 10 |
| ID-4 | 6401.898 | 0.88 | 47 | 6176 | 2.12 | 6.8 | -0.01 0.15 | 5.3 | -19 1 | -27 5 | -89 10 |
| ID-4 | 6533.484 | 0.68 | 70 | 6210 | 1.64 | 5.6 | -0.08 0.15 | -13 1 | |||
| ID-5 | 6407.832 | 0.26 | 36 | 6018 | 1.87 | 4.94 | 0.23 0.15 | 5.8 | -61 1 | -56 5 | -72 10 |
| (a) Heliocentric observed radial velocity | |||||||||||
| (b) -velocity respect to the LSR | |||||||||||
| (c) Velocity for gas particles at the Cepheids’ location in the simulation by Sormani et al. (2018) | |||||||||||
3.1 An homogenous Near-Infrared–Optical metallicity scale
Cepheids have been widely adopted to investigate the Galactic disk radial metallicity gradient, by our group (Lemasle et al., 2007; Lemasle et al., 2008; Pedicelli et al., 2010; Genovali et al., 2014; da Silva et al., 2016) and in the literature (Yong et al., 2006; Sziládi et al., 2007; Luck et al., 2011; Luck & Lambert, 2011; Andrievsky et al., 2016; Martin et al., 2015). However, all these investigations rely on high-resolution spectra, and therefore they are limited to bright and/or nearby Cepheids, while the metallicity gradient is mostly influenced by Cepheids located in the inner and outer regions of the disk. Because of the high amount of extinction, NIR spectroscopy is necessary to investigate the metallicity gradient in such critical regions. Unfortunately, while the method to determine the stellar parameters from optical spectra is very well known and tested, NIR spectroscopy is still in its infancy and, in fact, this is the very first study in which Cepheids’ parameters and chemical abundances are obtained from NIR-medium-resolution spectra.
Thus, we first need to ensure the compatibility of our results with the ones obtained by using the standard approach as in Genovali et al. (2014, and references therein) To this purpose, we tested the metallicity abundances obtained from the ISAAC spectra of the calibrating Cepheid V367 Sct against the ones obtained from four optical spectra collected at different epochs. Genovali et al. (2014) analysed these spectra and found a mean abundance [Fe/H]=0.04 0.08 dex, where the error is given by the of the different measurements, and the typical uncertainty on individual determinations ranges from 0.13 to 0.18 dex. The individual estimates as a function of the pulsation phase are shown in the top panel of Figure 6. The mean value is indicated by the solid blue line, while the dashed lines show the around the mean. On the basis of the ISAAC spectrum, we find [Fe/H]=-0.11 0.15 dex (red dot in the top panel of Figure 6), which agrees within 1 with the results from the optical data.
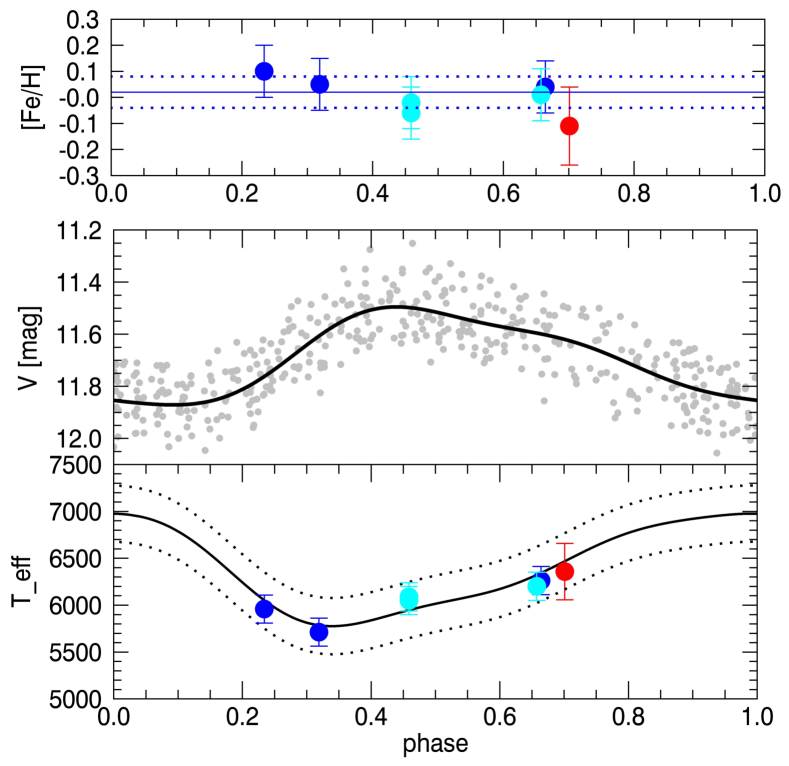
To further confirm the consistency of our NIR analysis, we also compare the effective temperature obtained from optical and NIR spectra of V367 Sct at the different observed phases. The middle panel of Figure 6 shows the light curve in the -band from ASAS444http://www.astrouw.edu.pl/asas/?page=acvs. V367 Sct is a double mode Cepheids, folded at its fundamental period of 6.29307 days, therefore the large scatter in the photometric data.
We performed a Fourier fitting of the light curve and mirrored it in order to qualitatively predict the shape of the temperature curve over the Cepheid pulsation cycle. In particular, we normalised the curve, multiplied it for the expected temperature variation of a Cepheid along the pulsation cycle ( 1,000 K) and added the mean values of the temperature as determined from the spectra ( 6,400 K). The new curve is plotted in the middle panel, where also the effective temperature measured on the optical (collected with UVES: blue dots; collected with FEROS: cyan dots) spectra (Genovali et al., 2014; Proxauf, 2017) and on the ISAAC spectrum (red dot) are shown.
This figure shows that the difference in temperature found in the optical and in the NIR regime are consistent within the expected change in temperature due to the pulsation mechanism.
| Epoch | SNR | [Fe/H] | Instrument | Resolution | ||||
|---|---|---|---|---|---|---|---|---|
| MJD | [] | [km s-1] | [dex] | |||||
| 6405.0 | 0.70 | 100 | 6358 300 | 1.9 | 6.3 | -0.11 0.15 | ISAAC | 3,000(a) |
| 6175.1 | 0.24 | 100 | 5959 84 | 1.2 | 4.2 | 0.10 0.10 | UVES | 38,000(b) |
| 4709.6 | 0.32 | 98 | 5712 93 | 1.3 | 3.4 | 0.05 0.10 | UVES | 38,000(b) |
| 6184.0 | 0.67 | 98 | 6262 196 | 1.0 | 3.4 | 0.04 0.10 | UVES | 38,000(b) |
| 3156.8 | 0.46 | 150 | 6089 107 | 2.0 | 4.9 | -0.06 0.10 | FEROS | 48,000(b) |
| 3156.9 | 0.46 | 151 | 6111 135 | 1.7 | 4.9 | -0.02 0.10 | FEROS | 48,000(c) |
| 3157.8 | 0.66 | 146 | 6212 150 | 1.8 | 3.8 | 0.01 0.10 | FEROS | 48,000(c) |
| (a) This work. | ||||||||
| (b) Spectra analysed in Genovali et al. (2014) and Proxauf (2017). | ||||||||
| (c) Spectra analysed in Kovtyukh et al. (2016) and Proxauf (2017). | ||||||||
3.2 Cepheids’s center-of-mass velocity from single-epoch spectroscopic data
By comparing the observed to the synthetic spectra in the model grid we obtained the instantaneous radial velocities of the Cepheids, which includes the barycentric velocity of the star (the so-called -velocity) and the pulsation velocity projected along the line of sight. Thus, we need to correct the observed velocity for the pulsation velocity at the observed phase. To this purpose, we computed new radial-velocity templates which allow us to perform such correction (e.g. see also: Inno et al., 2015; Matsunaga et al., 2015). We constructed velocity curve templates for Galactic Cepheids with period similar to the new ones, and in particular for the two period ranges: (template-1) and (template-2). Thus, we adopted the -band light curves and the radial velocities curves of 20 (template-1) and 8 (template-2) nearby Cepheids, compiled by Storm et al. (2011a), to calibrate such templates as described in the following. We fitted a 7th-order Fourier series to both the light and radial-velocity curves, and computed the peak-to-peak amplitude of the fit. The amplitude in the -band,, is tightly correlated with the velocity amplitude, , and we calibrated the relations:
| (2) |
which allow us to predict from the of the new Cepheids. Note that the quoted error is the dispersion around the mean / relation. In the case of the new Cepheids ID-1 and ID-4, we collected ISAAC spectra at two different pulsation phases, and the measured velocities are shown in Figure 4, together with the radial-velocity template adopted (template-2 for ID-1, top panel; template-1 for ID-4, bottom panel). The final -velocities obtained are indicated by the dashed line, while the shadowed area delimitates the error interval. In fact, the uncertainty on the final estimate is given by the sum in quadrature of the error on the measurement of the doppler velocity (1 kms-1), the dispersion given in Equation 3.2, and the scatter around the templates rescaled by the amplitude (0.1 kms-1).
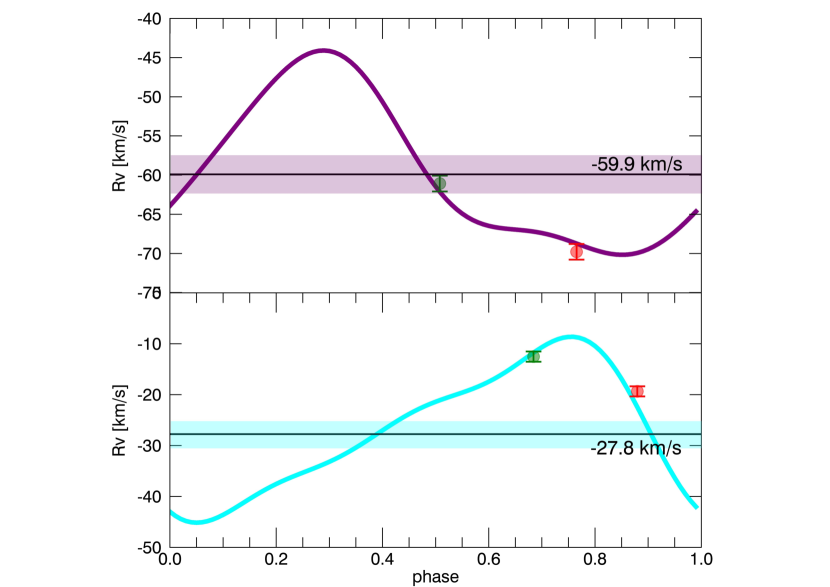
Within the period ranges we selected, the Cepheids show very similar variations in light and velocity, and we can use the templates described above to predict the pulsation amplitude for all the new Cepheids. The resulting -velocities in the Local Standard of Rest (LSR), , are listed in Table 4 and shown in Figure 8. The complete set of radial-velocity templates for classical Cepheids will be given in a forthcoming paper (Inno et al. in prep).
4 The kinematics of young stars in the Inner Galaxy
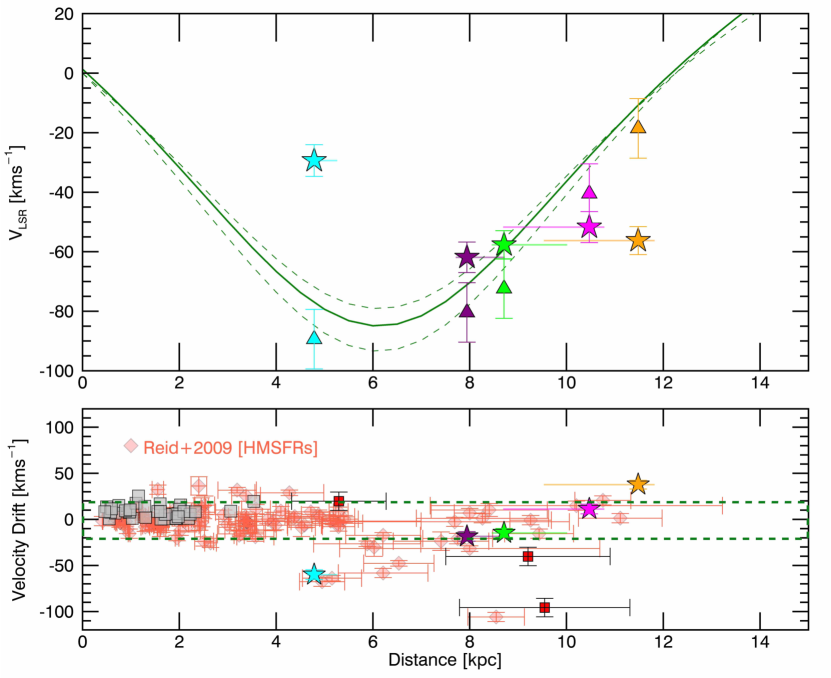
We compared the kinematics of the new Cepheids with the one predicted by adopting the rotation curve empirically calibrated by Reid et al. (2009), which assumes a solar distance =8.0 kpc, and a circular velocity of the Sun =240 kms-1 (solid thick line). Figure 8 shows the expected velocity as a function of the distance from us, together with the measured of the new Cepheids. Only ID-1, ID-5 and marginally ID-3 show a kinematics consistent with the Disk rotation, while the others show significant differences.
Of course, an error on the estimated distances for the new Cepheids would also produce artificial velocity drifts. However, the Cepheid ID-4 should be at least 3 kpc closer to us or 2 kpc farther in order to match the expected , which would imply an error on the estimated distance larger than 3. This is quite unlikely, especially for this Cepheid, which is less obscured with respect to Cepheids ID-1 and ID-5, which have instead velocities consistent with the curve. Note that even in the case that the Cepheid ID-4 is pulsating in the first-overtone mode, the velocity difference would still be observed, as the star would be located 1 kpc farther from us, where its expected velocity would be even larger.
Similarly, an error on the would also produce the observed velocity drifts. The dominant source of uncertainty in the computed Cepheids’ velocities is the correction for pulsation effects. However, it has been shown in the literature that Cepheids’ pulsation-velocity amplitudes are 5–30 kms-1(Storm et al., 2011a, b), with possible modulations effects due to the rotation or presence of a companion ranging from several hundred ms-1 to a few kms-1 (Anderson, 2016). The difference found here in the is significantly larger (50 kms-1). Once again, the velocity differences observed cannot be due to just measurements’ errors. Moreover, we already found similar drifts for two Cepheids in the inner Disk but located at positive Galactic longitudes (Tanioka et al., 2017) and concluded that either the Galactic rotation is slower in such regions, or the kinematics of the Cepheids is affected by the dynamical instabilities of the Bar.
Here, we find that such drifts are proportional to the distance, and the disturbance caused by the presence of the Bar cannot account for them. In order to check this, we used the simulations of Sormani et al. (2018), which model the gas flow in a Galactic barred potential and are able to reproduce the main observed characteristics of the atomic and molecular gas kinematics obtained through radio-frequency observations in the bar region (<|30| deg). These velocities are plotted as triangles of the same colors of the Cepheids to which they refer to, and they are very similar to the ones obtained on the basis of the purely circular rotation. Therefore, the dynamical influence of the Bar is already small at the distances where the Cepheids are located.
The bottom panel of Figure 8 shows the velocity drifts as a function of the heliocentric distance for the new Cepheids, the three Cepheids discussed in Tanioka et al. (2017), the Cepheids with velocity estimates in Storm et al. (2011a) and the High Massive Star Forming Regions (HMSFRs) used by Reid et al. (2009) to determine the Galactic rotation located in the inner Disk. Note that negative residuals at positive longitudes correspond to a faster rotation, while they correspond to a slower rotation at negative longitudes. To avoid confusion, we define the velocity drift as the absolute difference between the observed radial velocity along the line-of-sight and the one predicted on the basis of the pure circular rotation, and then we associate to it a positive sign at negative longitudes, and a negative sign for positive longitudes. With this definition, a star with a positive value of the velocity drift is moving faster than predicted from pure circular motion, while a star with a negative drift is moving slower The drifts systematically increase for increasing distance in the case of the new Cepheids, of two of the Tanioka et al. (2017) sample and of the HMSFRs at similar distances. This evidence indicates that such velocity pattern cannot be attributed to peculiar kinematics of the Cepheids, but must be related to a large scale effect, such as e.g. the presence of the spiral-arms at these locations or of bar/spiral-arms interactions, as in the cases of external spiral galaxies (see e.g. Shetty et al., 2007; Beuther et al., 2017).
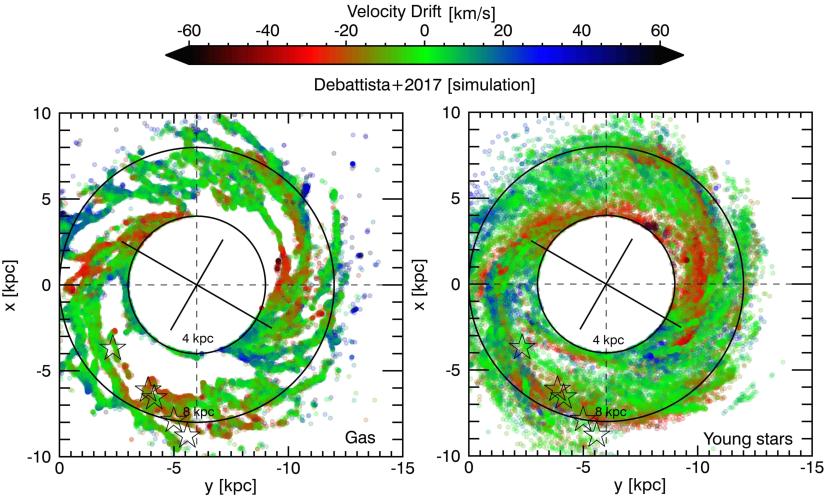
To explore at least qualitatively this scenario, we show in Figure 9 the distribution of cold gas (left panel) and young stars (age 0.3 Gyr, right panel) in the inner Disk, simulated by Debattista et al. (2017, see their Section 4), and color-coded by the deviation from the expected rotation velocity. While in the simulation by Sormani et al. (2018) the gas moves in an externally imposed potential in which the only non-axisymmetric component is the bar, the simulation by Debattista et al. (2017) is self-consistent, with the potential obtained from a time-dependent N-body simulation in which spiral arms and other non-axisymmetric dynamical features are present in addition to the bar. Moreover, we rescaled the simulation in order to match the physical size and inclination of the Milky Way central bar, and the rotation velocity at the Sun location (8 kpc) of 240 kms-1. Thus, we computed the radial velocity VLSR along the line-of-sight for each stellar particle in the simulated data, and then we subtracted from it the value predicted by using the rotation curve by Reid et al. (2009), as we did for the observed Cepheids. Moreover, we masked out the central region dominated by the Bar. In fact, in the inner 4 kpc the deviation we computed has hardly a physical meaning, as the orbits are known to be not-circular due to the presence of the bar. Summarising, the right panel of Figure 9 shows the position of stars that are moving either slower (red, negative drifts) or faster (blue, positive drifts) than expected. Such red and blue stars are not distributed uniformly in the plane, but they seem to trace the edges of spiral-arm-like features. This becomes even more evident by comparing their distribution to the one of the gas in the left panel of the same Figure. In fact, the gas seems to move systematically slower at the leading edges and faster at the trailing ones of these spiral-arm-like features, which is consistent with recent observational results (Hunt et al., 2017; Meidt et al., 2017; Baba et al., 2018). This behaviour is probably related to the spiral-arm resonances, which allow stars to spend enough time close to the arm itself, and to be initially decelerated by the local potential of the arm, and then accelerated when the arm has overtaken them. The presence of non-circular orbits of stars due to such resonances in the inner Galaxy has been indeed already suggested by Lépine et al. (2011) in order to explain the distribution and kinematics of molecular carbon monosulphides. The same resonance could be also responsible for the observed drifts of the new Cepheids, which have velocities consistent with the ones predicted by Lépine et al. (2011) for these non-circular orbits. Even though neither the available observed data or the simulated data allow us to completely characterise the orbits of the stars, it seems plausible that the drifts measured for the new Cepheids is produced by the presence of the same or similar resonances, and that the systematic trend shown in the bottom panel of Figure 8 is related to the location of the stars across one or more spiral arms.
5 Metallicity gradients in the inner Disk
5.1 The radial gradient
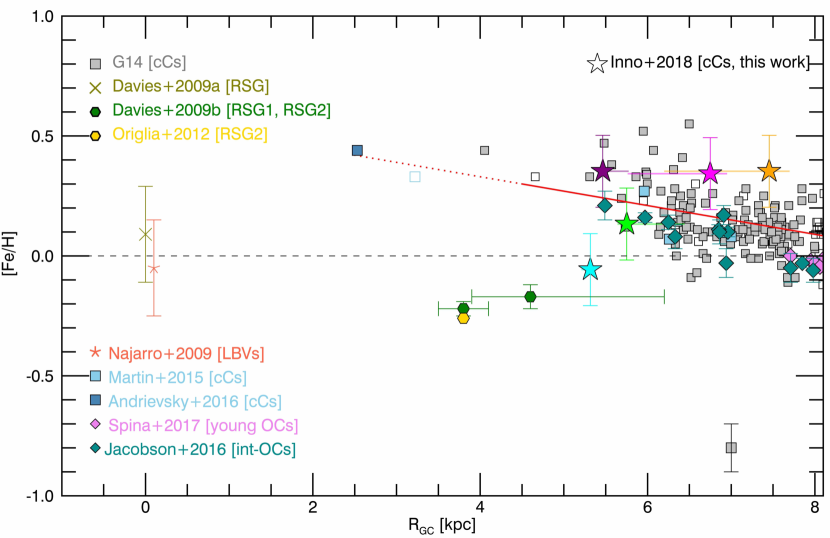
In order to investigate the radial metallicity gradient in the inner Disk, we plotted in Fig. 10 the iron abundances of the newly discovered Cepheids as a function of the Galactocentric radius compared to the abundances of all the other stellar tracers presented in Figure 4: the two red supergiants clusters (RGSC1 and RGSC2), as measured by Davies et al. (2009b) and by Origlia et al. (2013). We also included the metallicity range covered by luminous blue variables (LBVs) in the Quintuplet cluster (Najarro et al., 2009). Note that all the iron abundances have been rescaled to the same solar abundance adopted in Section 3.
The iron content of the new Cepheids is on average compatible (within the error bars) with the one predicted by adopting a linear metallicity gradient on a wide range of Galactocentric distances R4–19 kpc, thus suggesting a homogenous chemical enrichment history, at least on the timescale of Cepheids typical lifetime (200 Myr).
However, one of the new Cepheids (ID-4) has solar metallicity, and contributes at increasing the dispersion around the linear metallicity gradient in the inner Disk. In fact, given that the dispersion around the linear gradient reported in the literature is ([Fe/H])0.09 dex, the Cepheid ID-4 shows a 2 discrepancy. This finding, together with the results for the RGSCs, indicates that the young stellar population in the inner part of the Galaxy cover a broad range of iron abundances: -0.3 dex [Fe/H] 0.5 dex. A very similar metallicity range, i.e. -0.23 dex [Fe/H] 0.22 dex, is also spanned by luminous cool stars within 30 pc of the Galactic center, as found by Cunha et al. (2007). Since the extrapolation of the linear metallicity gradient to 0 would lead to significantly super-solar abundance in the Galactic center, a flattening of the inner Disk gradient would be necessary to explain the metallicity composition of these stars. The metallicity content of the new Cepheids seems to suggest instead that the chemical composition of the inner part of the disk is characterised by a high degree of inhomogeneity.
5.2 The azimuthal gradient
In order to investigate if the metallicity inhomogeneity is related to a more complex spatial structure due e.g. to the presence of the Bar, we compare the new Cepheids’ iron content with the metallicity of the other Cepheids in the inner Disk as a function of the azimuthal angle about the Galactic Center. We performed this comparison following the argument by Davies et al. (2009b). They suggest that objects in the inner Disk at negative tend to have super-solar abundances, while metal-poor RSG clusters are located at positive . They argue that this evidence is well justified by the inside-out infall scenario, when accounting for the dynamical effects due to the Bar’s instabilities, since the edge of the Bar is towards positive Galactic longitudes (see Fig. 3). This would reflect into an azimuthal metallicity gradient in the inner Disk.
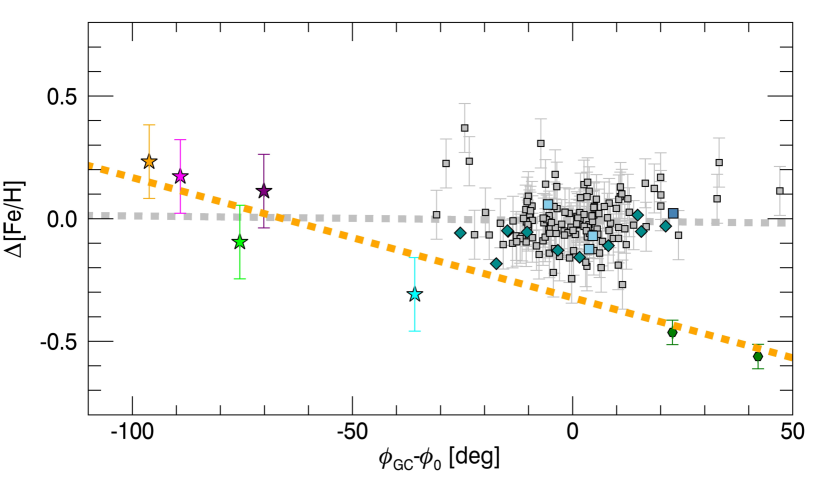
We plot in Figure. 11 the residuals from the radial metallicity gradient of Cepheids as a function of their azimuthal angle, rotated of =30∘, i.e. the inclination angle of the Bar respect to the -axis.
If we consider the sample of Cepheids in the inner Disk altogether, the data do not seem to support the presence of an azimuthal metallicity gradient, and indeed if we try to fit a linear relation, we find a slope consistent with zero (grey dashed line in Figure. 11). However, if we take into account only the newly discovered Cepheids and the RSGCs, we find a negative gradient significant at level. A possible explanation of this result is that the RSGCs and the new Cepheids belong to the same spiral arm, the Scutum arm, weather the other Cepheids belongs to (several) different arms overlapping along the same Galactocentric direction. However, arm–inter-arm metallicity variations are expected to be of the order of 0.02 dex (Bovy et al., 2014), thus quite smaller than the trend we find. Concluding, results based on Figure. 11 are difficult to interpret, as they are strongly biased by the incompleteness of the Cepheid sample. In order to obtain more quantitative and conclusive constraints on the metallicity distribution in the azimuthal directions, a more extensive sample of Galactic Cepheids with a well defined selection function is needed.
6 Conclusions
We report the discovery of five Cepheids located in the fourth quadrant of the Galactic disk. These Cepheids are unique in that they allow us to probe the transition between the inner Disk and the central regions of the Galaxy along the minor axis of the central Bar, where they are expected to be be less affected by its dynamical influences. We investigated the kinematics and iron abundance of the new Cepheids on the basis of NIR medium-resolution spectra collected with ISAAC@VLT. We built specific radial-velocity-curve template in order to obtain the line-of-sight systemic velocity of the Cepheids from the observed radial velocity. We also performed a careful comparison between abundances determined on the basis of optical high-resolution spectra and NIR medium-resolution spectrum of the calibrating Cepheid V367 Sct. We found that the iron abundance estimates are consistent within the error bars, thus suggesting a negligible dependence on the wavelength regime and analysis techniques. Summarising, we determined accurate distances, velocities and metallicities for the newly discovered Cepheids, even though they are located in highly obscured regions of the Galaxy.
In this paper, we show that the kinematics and the metallicity of these Cepheids are different from the ones of already known Galactic Cepheids in the inner Disk. In fact, ) they move slower then expected if located at small galactocentric radii and faster if they are beyond the Galactic center; and ) they are more metal rich at larger then at smaller azimuthal angles. However, given the little number of new Cepheids identified and the patchy, inhomogeneous selection function which characterises the entire sample of known Cepheids in the Milky Way, any interpretation of such findings must be taken with caution. Nonetheless, our analysis show that the kinematics and metallicity content of young stars in the inner Disk is strongly influenced by dynamical instabilities induced by the bar/spiral-arm-pattern.
We used the simulation by Sormani et al. (2018) to determine the motion of the gas at the location of the Cepheids. We found that the velocities predicted by the model are very similar to the ones predicted on the basis of the simple rotation curve within 10 km/s, which is the uncertainty associated to the model. We made the same comparison also for the three Cepheids presented in Tanioka et al. (2017), and we found similar results.
This indicates that the newly identified Cepheids are located too far with respect to the regions where the Bar becomes dominant, thus bar-induced non-circular motions alone cannot account for the velocity drifts observed. However, such dynamical instabilities can be induced by any non axis-symmetric potential, also due e.g. to spiral arms, or even by bar/spiral-arm interactions. Recent results (e.g Bobylev & Bajkova, 2015; Baba et al., 2018) show that young stars have statistically significant velocity offset depending on their location either at the leading or trailing part of the spiral arm. Such velocity variations are expected to have amplitude of 6-10 kms-1 with respect to the Galactic rotation. These value are still 2–3 times smaller than the drifts we measured for the Cepheids in the inner Disk, but they refer to the average perturbation, while the drifts can be larger for specific group of stars.
Summarising, by comparing results from the simulations of Debattista et al. (2017) and Sormani et al. (2018) in Figure 8 and 9 we can conclude that ) the bar cannot be the direct cause of the observed drifts; ) drifts with amplitudes of 60 kms-1 can be induced both in the gas and young stars by the presence of non-axisymmetric dynamical perturbations such as spiral arms outside the bar region (>4 kpc). Moreover, the simulation by Debattista et al. (2017) shows that stars at the leading edges of the spiral arms are mostly decelerated, while the ones at the trailing edges are accelerated, thus producing a systematic trend for velocity drifts across the arms. Finally, the observed deviations from the simple Galactic rotation also imply that the stars are moving in non-circular orbits, which are produced at dynamical resonances. Even though we cannot determine the new Cepheids orbits, it is plausible that they are moving in boxy-shaped orbits similar to the ones identified by Lépine et al. (2011) in the inner Galaxy.
The bar-like structure at the center of the Galaxy is also a key ingredient for Galactic evolution models in order to explain the high star-formation-rate found in the Nuclear Bulge, since it is responsible for dragging gas and molecular clouds from the inner Disk into the center of the Galaxy (Athanassoula, 1992; Kim et al., 2011). This scenario implies that the metallicity distribution of the inner Disk should be similar to the one found in the Nuclear Bulge. Current findings show that the metallicity dispersion of the new Cepheids is indeed consistent with the metallicity of LBVs in the Quintuplet cluster by Najarro et al. (2009) and RSGCs in the Galactic Center by Davies et al. (2009a). Moreover, recent measurements by Ryde & Schultheis (2015) for evolved stars in the NB (M giants) also show a similar large metallicity range, i.e. -0.13 dex[Fe/H]0.29 dex, with a good overlap with the metallicity range covered by the new Cepheids, i.e. -0.06 dex[Fe/H] 0.33 dex.
Concluding, the broad metallicity range covered by the new Cepheids suggest that young and evolved stars in the two innermost Galactic regions with ongoing star formation activity, i.e. the inner Disk and the Nuclear Bulge, have similar iron abundances, thus supporting a correlation between their chemical enrichment histories. On the other side, the absence of a clear azimuthal metallicity gradient rules out the dynamical effects of the Bar’s instabilities as the cause of the large observed metallicity spread. Thus, this dispersion seems then to be an intrinsic feature of the chemical composition of the Galactic inner Disk, suggesting that its metallicity distribution cannot be modelled by using one-dimensional gradients.
This work shows that our understanding of the central regions of the Galaxy is still severely biased by the limited number of tracers available. Deep photometric surveys, especially in the NIR, together with NIR follow-up spectroscopy are necessary to achieve more firms conclusions on the topic. By succeeding in performing the spectroscopic analysis of NIR spectra for pulsating supergiant stars we contribute to make one step farther in this direction.
Acknowledgements
Based on observations collected at the European Organisation for Astronomical Research in the Southern Hemisphere under ESO programme: 290.D-5114(A), PI: L. Inno. This work was supported by Sonderforschungsbereich SFB 881 "The Milky Way System" (subproject A3, A5, B1, B2 and B8) of the German Research Foundation (DFG). NM is grateful to Grant-in-Aid (KAKENHI, No. 26287028) from the Japan Society for the Promotion of Science (JSPS). VPD is supported by STFC Consolidated grant no. ST/M000877/1. The star-forming simulation used in this paper was run at the High Performance Computing Facility of the University of Central Lancashire. We express our thanks to Shogo Nishiyama, Nagisa Oi, and Hirofumi Hatano who collected a part of the IRSF photometric data for our targets. We also warmly thank E. Valenti, for her help and many useful suggestions while serving as support astronomer for the ISAAC program 290.D-5114(A) PI: L. Inno, as well as S. Meidt and O. Gerhard for the nice discussions on galaxies dynamics that helped us in improving the manuscript.
References
- Allard et al. (2006) Allard E. L., Knapen J. H., Peletier R. F., Sarzi M., 2006, MNRAS, 371, 1087
- Anderson (2016) Anderson R. I., 2016, MNRAS, 463, 1707
- Andrievsky et al. (2002) Andrievsky S. M., Bersier D., Kovtyukh V. V., Luck R. E., Maciel W. J., Lépine J. R. D., Beletsky Y. V., 2002, A&A, 384, 140
- Andrievsky et al. (2016) Andrievsky S. M., Martin R. P., Kovtyukh V. V., Korotin S. A., Lépine J. R. D., 2016, MNRAS, 461, 4256
- Athanassoula (1992) Athanassoula E., 1992, MNRAS, 259, 345
- Baba et al. (2018) Baba J., Kawata D., Matsunaga N., Grand R. J. J., Hunt J. A. S., 2018, ApJ, 853, L23
- Bally et al. (2010) Bally J., et al., 2010, A&A, 518, L90
- Benjamin et al. (2005) Benjamin R. A., et al., 2005, ApJ, 630, L149
- Beuther et al. (2017) Beuther H., Meidt S., Schinnerer E., Paladino R., Leroy A., 2017, A&A, 597, A85
- Bhardwaj et al. (2017) Bhardwaj A., Macri L. M., Rejkuba M., Kanbur S. M., Ngeow C.-C., Singh H. P., 2017, AJ, 153, 154
- Bland-Hawthorn & Gerhard (2016) Bland-Hawthorn J., Gerhard O., 2016, ARA&A, 54, 529
- Bobylev & Bajkova (2015) Bobylev V. V., Bajkova A. T., 2015, Astronomy Letters, 41, 473
- Bono et al. (2005) Bono G., Marconi M., Cassisi S., Caputo F., Gieren W., Pietrzynski G., 2005, ApJ, 621, 966
- Bovy et al. (2014) Bovy J., et al., 2014, ApJ, 790, 127
- Bovy et al. (2016) Bovy J., Rix H.-W., Green G. M., Schlafly E. F., Finkbeiner D. P., 2016, ApJ, 818, 130
- Cardelli et al. (1989) Cardelli J. A., Clayton G. C., Mathis J. S., 1989, ApJ, 345, 245
- Chiappini et al. (1997) Chiappini C., Matteucci F., Gratton R., 1997, ApJ, 477, 765
- Cunha et al. (2007) Cunha K., Sellgren K., Smith V. V., Ramirez S. V., Blum R. D., Terndrup D. M., 2007, ApJ, 669, 1011
- Daflon & Cunha (2004) Daflon S., Cunha K., 2004, ApJ, 617, 1115
- Davies et al. (2009a) Davies B., Origlia L., Kudritzki R.-P., Figer D. F., Rich R. M., Najarro F., 2009a, ApJ, 694, 46
- Davies et al. (2009b) Davies B., Origlia L., Kudritzki R.-P., Figer D. F., Rich R. M., Najarro F., Negueruela I., Clark J. S., 2009b, ApJ, 696, 2014
- Debattista et al. (2017) Debattista V. P., Ness M., Gonzalez O. A., Freeman K., Zoccali M., Minniti D., 2017, MNRAS, 469, 1587
- Dékány et al. (2015a) Dékány I., et al., 2015a, ApJ, 799, L11
- Dékány et al. (2015b) Dékány I., et al., 2015b, ApJ, 812, L29
- Drimmel & Spergel (2001) Drimmel R., Spergel D. N., 2001, ApJ, 556, 181
- Drimmel et al. (2003) Drimmel R., Cabrera-Lavers A., López-Corredoira M., 2003, A&A, 409, 205
- Feast & Whitelock (1997) Feast M., Whitelock P., 1997, MNRAS, 291, 683
- Feltzing & Chiba (2013) Feltzing S., Chiba M., 2013, New Astron. Rev., 57, 80
- Friedli & Benz (1995) Friedli D., Benz W., 1995, A&A, 301, 649
- Genovali et al. (2013) Genovali K., et al., 2013, A&A, 554, A132
- Genovali et al. (2014) Genovali K., et al., 2014, A&A, 566, A37
- Groenewegen et al. (2008) Groenewegen M. A. T., Udalski A., Bono G., 2008, A&A, 481, 441
- Heyer & Dame (2015) Heyer M., Dame T. M., 2015, ARA&A, 53, 583
- Hunt et al. (2017) Hunt J. A. S., Kawata D., Monari G., Grand R. J. J., Famaey B., Siebert A., 2017, MNRAS, 467, L21
- Inno et al. (2015) Inno L., et al., 2015, A&A, 576, A30
- Inno et al. (2016) Inno L., et al., 2016, ApJ, 832, 176
- Jacobson et al. (2016) Jacobson H. R., et al., 2016, A&A, 591, A37
- Joblin et al. (1990) Joblin C., D’Hendecourt L., Leger A., Maillard J. P., 1990, Nature, 346, 729
- Kato et al. (2007) Kato D., et al., 2007, PASJ, 59, 615
- Khoperskov et al. (2018) Khoperskov S., Di Matteo P., Haywood M., Combes F., 2018, preprint, (arXiv:1801.08711)
- Kim et al. (2011) Kim S. S., Saitoh T. R., Jeon M., Figer D. F., Merritt D., Wada K., 2011, ApJ, 735, L11
- Kovtyukh et al. (2010) Kovtyukh V. V., Chekhonadskikh F. A., Luck R. E., Soubiran C., Yasinskaya M. P., Belik S. I., 2010, MNRAS, 408, 1568
- Kovtyukh et al. (2016) Kovtyukh V., et al., 2016, MNRAS, 460, 2077
- Laney & Stobie (1992) Laney C. D., Stobie R. S., 1992, A&AS, 93, 93
- Lemasle et al. (2007) Lemasle B., François P., Bono G., Mottini M., Primas F., Romaniello M., 2007, A&A, 467, 283
- Lemasle et al. (2008) Lemasle B., François P., Piersimoni A., Pedicelli S., Bono G., Laney C. D., Primas F., Romaniello M., 2008, A&A, 490, 613
- Lépine et al. (2011) Lépine J. R. D., Roman-Lopes A., Abraham Z., Junqueira T. C., Mishurov Y. N., 2011, MNRAS, 414, 1607
- Luck & Lambert (2011) Luck R. E., Lambert D. L., 2011, AJ, 142, 136
- Luck et al. (2011) Luck R. E., Andrievsky S. M., Kovtyukh V. V., Gieren W., Graczyk D., 2011, AJ, 142, 51
- Macri et al. (2015) Macri L. M., Ngeow C.-C., Kanbur S. M., Mahzooni S., Smitka M. T., 2015, AJ, 149, 117
- Majaess et al. (2016) Majaess D., Turner D., Dékány I., Minniti D., Gieren W., 2016, A&A, 593, A124
- Martin et al. (2015) Martin R. P., Andrievsky S. M., Kovtyukh V. V., Korotin S. A., Yegorova I. A., Saviane I., 2015, MNRAS, 449, 4071
- Matsunaga et al. (2009) Matsunaga N., Kawadu T., Nishiyama S., Nagayama T., Hatano H., Tamura M., Glass I. S., Nagata T., 2009, MNRAS, 399, 1709
- Matsunaga et al. (2011) Matsunaga N., et al., 2011, Nature, 477, 188
- Matsunaga et al. (2013) Matsunaga N., et al., 2013, MNRAS, 429, 385
- Matsunaga et al. (2015) Matsunaga N., et al., 2015, ApJ, 799, 46
- Matsunaga et al. (2016) Matsunaga N., et al., 2016, MNRAS, 462, 414
- Meidt et al. (2017) Meidt S. E., et al., 2017, preprint, (arXiv:1712.06364)
- Metzger & Schechter (1998) Metzger M. R., Schechter P. L., 1998, AJ, 116, 469
- Minchev et al. (2013) Minchev I., Chiappini C., Martig M., 2013, A&A, 558, A9
- Minniti et al. (2010) Minniti D., et al., 2010, New Astron., 15, 433
- Monson & Pierce (2011) Monson A. J., Pierce M. J., 2011, ApJS, 193, 12
- Nagashima et al. (1999) Nagashima C., et al., 1999, in Nakamoto T., ed., Star Formation 1999. pp 397–398
- Nagayama et al. (2003) Nagayama T., et al., 2003, in Iye M., Moorwood A. F. M., eds, Proc. SPIEVol. 4841, Instrument Design and Performance for Optical/Infrared Ground-based Telescopes. pp 459–464, doi:10.1117/12.460770
- Najarro et al. (2009) Najarro F., Figer D. F., Hillier D. J., Geballe T. R., Kudritzki R. P., 2009, ApJ, 691, 1816
- Nardetto et al. (2011) Nardetto N., Fokin A., Fouqué P., Storm J., Gieren W., Pietrzynski G., Mourard D., Kervella P., 2011, A&A, 534, L16
- Nataf et al. (2016) Nataf D. M., et al., 2016, MNRAS, 456, 2692
- Nishiyama et al. (2006) Nishiyama S., et al., 2006, ApJ, 638, 839
- Origlia et al. (2013) Origlia L., et al., 2013, A&A, 560, A46
- Pedicelli et al. (2010) Pedicelli S., et al., 2010, A&A, 518, A11
- Persson et al. (2004) Persson S. E., Madore B. F., Krzemiński W., Freedman W. L., Roth M., Murphy D. C., 2004, AJ, 128, 2239
- Pietrzyński et al. (2013) Pietrzyński G., et al., 2013, Nature, 495, 76
- Proxauf (2017) Proxauf B., 2017, Master Thesis on Homogeneous Metallicity Scale for Galactic Classical Cepheids
- Reid et al. (2009) Reid M. J., et al., 2009, ApJ, 700, 137
- Reid et al. (2014) Reid M. J., et al., 2014, ApJ, 783, 130
- Reid et al. (2016) Reid M. J., Dame T. M., Menten K. M., Brunthaler A., 2016, ApJ, 823, 77
- Rieke & Lebofsky (1985) Rieke G. H., Lebofsky M. J., 1985, ApJ, 288, 618
- Rix & Bovy (2013) Rix H.-W., Bovy J., 2013, A&ARv, 21, 61
- Ryde & Schultheis (2015) Ryde N., Schultheis M., 2015, A&A, 573, A14
- Sánchez-Blázquez et al. (2011) Sánchez-Blázquez P., Ocvirk P., Gibson B. K., Pérez I., Peletier R. F., 2011, MNRAS, 415, 709
- Sasselov & Lester (1990) Sasselov D. D., Lester J. B., 1990, ApJ, 362, 333
- Schlafly et al. (2016) Schlafly E. F., et al., 2016, ApJ, 821, 78
- Shetty et al. (2007) Shetty R., Vogel S. N., Ostriker E. C., Teuben P. J., 2007, ApJ, 665, 1138
- Simon & Lee (1981) Simon N. R., Lee A. S., 1981, ApJ, 248, 291
- Skrutskie et al. (2006) Skrutskie M. F., et al., 2006, AJ, 131, 1163
- Sormani et al. (2018) Sormani M. C., Treß R. G., Ridley M., Glover S. C. O., Klessen R. S., Binney J., Magorrian J., Smith R., 2018, MNRAS, 475, 2383
- Spina et al. (2017) Spina L., et al., 2017, A&A, 601, A70
- Storm et al. (2011a) Storm J., et al., 2011a, A&A, 534, A94
- Storm et al. (2011b) Storm J., Gieren W., Fouqué P., Barnes T. G., Soszyński I., Pietrzyński G., Nardetto N., Queloz D., 2011b, A&A, 534, A95
- Sziládi et al. (2007) Sziládi K., Vinkó J., Poretti E., Szabados L., Kun M., 2007, A&A, 473, 579
- Tanioka et al. (2017) Tanioka S., Matsunaga N., Fukue K., Inno L., Bono G., Kobayashi N., 2017, ApJ, 842, 104
- Vallée (2017) Vallée J. P., 2017, Ap&SS, 362, 173
- Windmark et al. (2011) Windmark F., Lindegren L., Hobbs D., 2011, A&A, 530, A76
- Yong et al. (2006) Yong D., Carney B. W., Teixera de Almeida M. L., Pohl B. L., 2006, AJ, 131, 2256
- Zaritsky et al. (1994) Zaritsky D., Kennicutt Jr. R. C., Huchra J. P., 1994, ApJ, 420, 87
- da Silva et al. (2016) da Silva R., et al., 2016, A&A, 586, A125