A fast adhesive discrete element method for random packings of fine particles
Abstract
Introducing a reduced particle stiffness in discrete element method (DEM) allows for bigger time steps and therefore fewer total iterations in a simulation. Although this approach works well for dry non-adhesive particles, it has been shown that for fine particles with adhesion, system behaviors are drastically sensitive to the particle stiffness. Besides, a simple and applicable principle to set the parameters in adhesive DEM is also lacking. To solve these two problems, we first propose a fast DEM based on scaling laws to reduce particle Young’s modulus, surface energy and to modify rolling and sliding resistances simultaneously in the framework of Johnson-Kendall-Roberts (JKR)-based contact theory. A novel inversion method is then presented to help users to quickly determine the damping coefficient, particle stiffness and surface energy to reproduce a prescribed experimental result. After validating this inversion method, we apply the fast adhesive DEM to packing problems of microparticles. Measures of packing fraction, averaged coordination number and distributions of local packing fraction and contact number of each particle are in good agreement with results simulated using original value of particle properties. The new method should be helpful to accelerate DEM simulations for systems associated with aggregates or agglomerates.
keywords:
Discrete Element Method, Reduced stiffness, Microspheres, Cohesive particles, Rolling resistance, Packing structure1 Introduction
In multiphase and granular flows, discrete element method (DEM) has been widely used to model particle-particle interaction and accurately predict the motion of individual particles [Cundall & Strack, 1979, Tsuji et al., 1993, Zhu et al., 2008, Marshall & Li, 2014, Sundaresan et al., 2018, Xiao et al., 2016]. For soft-sphere DEM, Young’s modulus of particles used in the simulation is usually much smaller than its real value. Therefore, it is reasonable to select a much larger time step to resolve inter-particle collisions, which considerably reduces the computation cost [Tsuji et al., 1993]. For systems with non-adhesive particles, the stiffness can be reduced by several orders without altering the simulation results. For instance, in fluidization systems, the flow patterns, both the shape and size distributions of bubbles, are reported to be insensitive to the particle stiffness [Moreno-Atanasio et al., 2007, Gu et al., 2016]. For a collision between two particles, the post-collisional velocity is also mainly determined by the damping coefficient rather than the particle stiffness [Marshall, 2009].
However, for fine particles with van der Waals adhesion or wet particles with cohesion, a reduction of stiffness in DEM models can substantially change the simulation results [Gu et al., 2016]. Intuitively, with a smaller stiffness, the particles in contact tend to have a larger deformation along the direction of compression and an enlarged area of the contact region, which leads to an overestimation of the adhesive effect [Kobayashi et al., 2013, Liu et al., 2016a]. To counterbalance the deviation that arises from the reduced stiffness, a modification of the adhesive force is often needed. Kobayashi et al. [2013] simply regarded the adhesive force as a constant external force and then reduced it to recover the original value of the critical sticking velocity. Similar ideas were adopted by Gu et al. [2016] and by Hærvig et al. [2017], who modified the van der Waals force between particles to conserve the cohesive energy during a quasi-static two-particle collision, and by Washino et al. [2018] who derived a series of generic scaling to modify external attractive forces. In these previous studies, the adhesive force model has been modified based on the simple case of binary collision, thus is suitable only for the collision-dominated process, like fluidization process with a velocity much higher than the minimum fluidization value [Kobayashi et al., 2013, Gu et al., 2016] or powder flow in a mixer with high rotating rate [Washino et al., 2018].
An important but missing component in current adhesive DEM with reduced stiffness is its applicability to the problem associated with particle aggregates. These systems are actually quite ubiquitous in both industry and nature, such as coagulation of particles in interstellar space and protoplanetary disks [Chokshi et al., 1993, Dominik, 1997], formation of dust cake during capture of aerosol particles [Li & Marshall, 2007, Chen et al., 2016b, Wei et al., 2018], packing of adhesive particles around or below the minimum fluidization velocity [Valverde et al., 2004, Hakim et al., 2005, Liu et al., 2015, Luo et al., 2017], etc. In these situations, it is of central importance to correctly predict both dynamic evolution and static structures of aggregates. For instance, it has been reported that coagulation between aggregates and particles dominates the growth from submicron-sized grains to kilometer-size planetesimals [Dominik, 1997], and the structures of dendrites (chainlike agglomerates) on fiber surfaces have a remarkable influence on capture efficiency of aerosol particle [Li & Marshall, 2007, Payatakes & Gradoń, 1980]. Previous work has shown that packing of adhesive particles can be mechanically stable with packing fraction as low as 0.15 and coordination number close to 2 [Liu et al., 2015, 2016b, 2017b]. Generally, a loose aggregate can be stable due to: (1) attractive forces that prevent the detaching of two contact particles (known as necking effect); (2) a rolling resistance and a sliding friction, arising from the asymmetrical distribution of the stress and surface roughness in the contact area, respectively. These resistances prevent the particle from rolling or sliding over its neighboring particles and should be properly calculated when reduced stiffness is used.
In this paper, we demonstrate how to properly consider rolling and friction resistances in the framework of adhesive DEM based on Johnson-Kendall-Roberts (JKR) contact theory [Johnson et al., 1971] with reduced stiffness. It allows us to reproduce essentially the same packing structures as those calculated with real particle properties. Before showing a mass of packing structures in Section 4, we first briefly introduce the adhesive DEM based on JRK contact theory and rigorously derive a simple scaling law for use of reduced stiffness in Section 2. In Section 3, we propose an inversion procedure, by which the parameters in DEM can be set according to a prescribed particle-wall collision result.
2 Modeling framework
2.1 Adhesive DEM based on JKR contact theory
The discrete element method is a framework that solves Newton’s second law of each particle. The particles are regarded as soft bodies and the forces and torques between contact particles are resolved. In the JKR-based models proposed in our previous work [Li & Marshall, 2007, Marshall, 2009, Li et al., 2011], the normal force , the sliding friction , the twisting torque , and the rolling torque acting on particle from its neighboring particle can be expressed as
| (1a) | ||||
| (1b) | ||||
| (1c) | ||||
| (1d) | ||||
The first term in the right-hand side of the normal force is derived from the JKR contact theory. It combines the effects of van der Waals attraction and elastic deformation of contact particles [Johnson et al., 1971]. The scale of the first term is set by the critical pull-off force, , where is the surface energy of the particle, is the effective particle radius, is the radius of particle . is calculated by normalizing the radius of the contact area with its value at the zero-load equilibrium state , given as [Marshall, 2009], is the effective elastic modulus. The second term of Eq. (1a) is the viscoelastic dissipation, which is in propotion to the rate of deformation , with being the unit vector pointing from the centroid of particle to that of particle and the relative particle velocity. The normal dissipation coefficient is described in [Marshall, 2009, Tsuji et al., 1992] with the coefficient related to the coefficient of restitution . is the effective mass of the two contacting particles, where is the mass of particle . The normal elastic stiffness is expressed as and the tangential stiffness is given as . The effective elastic and shear moduli and are both functions of particle’s Young’s modulus and Poisson ratio :
| (2) |
where is the particle’s shear modulus. The sliding friction, the twisting torque, and the rolling torque (Eq. 1b - 1d) are all calculated using spring-dashpot-slider models, where , , and are the relative sliding, twisting, and rolling velocities, and and are the unit vectors in the directions of sliding and rolling, respectively. When these resistances reach their critical limits, , or , a particle will irreversibly slide, twist or roll relative to its neighboring particle. The critical limits are expressed as [Marshall, 2009]:
| (3a) | ||||
| (3b) | ||||
| (3c) | ||||
Here is the friction coefficient and is the critical rolling angle. One can set their values according to experimental measurements [Sümer & Sitti, 2008].
2.2 Accelerating adhesive DEM using reduced stiffness
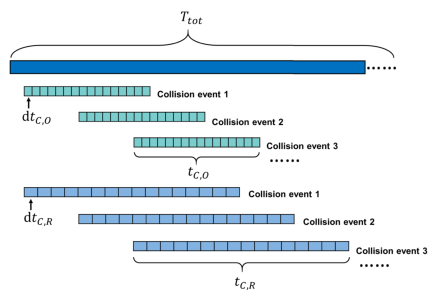
The typical collision time , which is defined as the time associated with the elastic response during the collision between two particles, can be generally estimated as [Li & Marshall, 2007]. To resolve the collision, one should use a time step with much less than unity. Acceleration of the simulation can be achieved by choosing a reduced Young’s modulus that satisfies the condition (hereafter, we use subscripts to indicate original particle properties and to indicate reduced properties). It allows one to use a larger time step to resolve the collision event. Such speedup of DEM is of prime importance when the simulated system contains numerous collision events. A graphical representation of this idea is displayed in Fig. 1 The time span is usually set by macroscopic parameters, such as the total mass loading of deposited particles in filtration/deposition systems or the total amount of gas in fluidization system, and thus is independent of the particle stiffness. When the original Young’s modulus is used in the simulation, the collision events (indicated by green bars) take place over the typical collision time . In contrast, if a reduced Young’s modulus is assigned to the particles, the collision events (indicated by light blue bars) will have a much larger timescale . As a result, a larger time step can be used to resolve the collision events and the total number of iterations decreases. Note that the collision events start at the same time when a reduced stiffness is used. Since the collision time is usually several orders of magnitude smaller than the typical particle transport time. It is reasonable to assume that the extension of the collision time due to the reduction does not apparently affect the start time of subsequent collision events.
Such approach for speedup of DEM has been tested and found widespread uses in the simulation of non-adhesive particles [Moreno-Atanasio et al., 2007, Lommen et al., 2014, Gu et al., 2016]. However, it cannot be directly applied to predict the behavior of adhesive small particles. The reason can be clearly illustrated through a simple case of the particle-wall collision. We consider a particle with radius and impact velocity . The state of the particle can be described using the equation of the overlap . According to Newton’s second law, the temporal evolution of is given by . For non-adhesive particles, the force is calculated by the Hertzian model together with damping force and the equation of takes the form [Tsuji et al., 1992, Marshall, 2009]:
| (4) |
In Hertzian model, the radius of contact region is calculated as . For adhesive particles, instead of using the Hertzian model, we use the JKR model (Eq. (1a)) to calculate the forces. The equation of now becomes
| (5) |
Here, is related to the overlap through [Marshall, 2009]
| (6) |
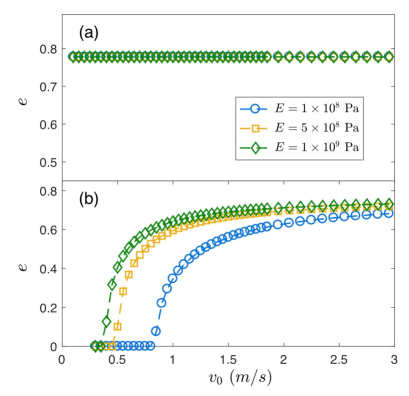
The critical overlap is given by . The result of a collision is described using the coefficient of restitution , defined as the ratio of the post-collision velocity of the particle to its velocity before the collision. To show the effect of reduced particle stiffness, three different values of Young’s modulus, Pa, Pa, and Pa are used. As shown in Fig. 2, the restitution coefficient for collisions between the non-adhesive particle and the wall is independent of the particle’s Young’s modulus. Whereas, for the adhesive particle, the restitution coefficient, especially at a low impact velocity, significantly decreases when Young’s modulus is reduced. And a remarkable increase of the critical sticking velocity , defined as the maximum impact velocity at which a particle hitting the surface will stick (i.e., ), is also observed. To address this issue, it has recently been suggested that a reduced surface energy should be used to balance the nonphysical effect caused by reduced stiffness so that the outcome of the collision will remain the same [Hærvig et al., 2017, Washino et al., 2018].
Here, we derive a scaling law for choosing the reduced surface energy in a rigorous way based on the non-dimensional equation for particle collision. We start from the non-dimensional form of the equation describing the collision between an adhesive particle and a wall (Eq. (5))
| (7) |
The overlap is normalized by the critical overlap , and the time is scaled using . The coefficients and are functions of particle properties and the initial velocity :
| (8a) | ||||
| (8b) | ||||
in Eq. (7) can be calculated inversly through Eq. (6) and is expressed as . Eq. (7) can be solved given the initial conditions and , and the jump-on/jump-off criterion: the contact between the particle and wall is built up when and is broken up when . The result of a collision is determined only by the damping coefficient and a grouped parameter , which is defined as
| (9) |
We have removed all other coefficients in the governing equation and in the initial conditions through scaling. The first parameter in Eq. (9), , is called elasticity parameter, which can be regarded as the ratio of elastic force to the particle inertia [Li & Marshall, 2007]. The second parameter is the adhesion parameter, , defined as the ratio of the adhesive energy and the particle kinetic energy [Li & Marshall, 2007]. The adhesion parameter has been successfully used to estimate the critical sticking velocity of two colliding particles [Chen et al., 2015] and predict the packing structure of adhesive particles Liu et al. [2015]. For monodispersed systems, is usually defined based on the reduced radius [Liu et al., 2015]. In contrast, for polydisperse systems or systems where particles and walls coexist, a mean particle radius is preferred to calculate .
When a reduced particle Young’s modulus is used, the surface energy should be modified to keep constant. Thus, the reduced surface energy is calculated as:
| (10) |
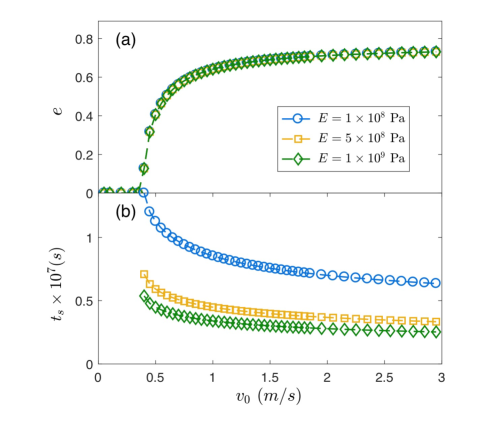
where is the reduced ratio. We recalculate the particle-wall impact case in Fig. 2 (b) with surface energy modified according to Eq. (10). The result in Fig. 3 (a) demonstrates that the scaling yields curves identical to those calculated with the original parameter. We also display the physical time of collisions , which is defined as the time interval between the moment of contact formation and separation, as a function of impact velocity. For a given velocity, the collision takes place over a much longer time when reduced Young’s modulus is used. The simple scaling in Eq. (10) has the same form with the one derived from the concept of energy conservation during quasi-static separation of two contact particles [Hærvig et al., 2017]. The derivation here is based on the dimensionless equation of the motion for true collision cases thus is believed to be more rigorous.
2.3 Modified models for rolling and sliding resistances
A proper description of adhesive rolling and sliding resistances is of significance to predict the formation of agglomerates and the structure of particle deposits. For adhesive microparticles, rolling is generally the preferred deformation mode, which gives rises to the rearrangement of packing structures [Dominik, 1997, Liu et al., 2016b, 2017b]. To accurately simulate the rolling motion, the adhesive rolling model needs to be modified in the framework of JKR-based DEM with reduced stiffness. The same idea can be readily applied to modify the sliding resistance.
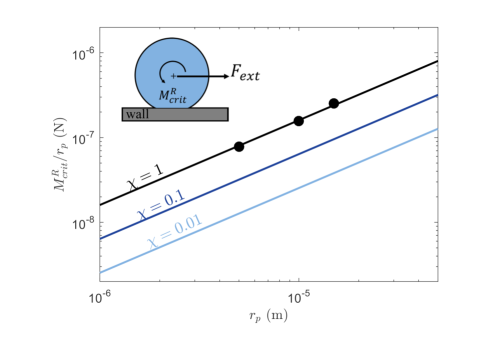
Assume a simple case where a particle is in normal equilibrium with a wall and an external force , which is parallel to the wall, is then applied on the center of the particle. If is smaller than the critical value , the particle rolls over a small distance and reaches a mechanically stable state. If , the particle will roll irreversibly. According to the experimental measurements of Sümer & Sitti [2008] using polystyrene microparticles, the critical rolling angle is nearly constant, . As displayed in Fig. 4, using the same parameters as in [Sümer & Sitti, 2008], Eq. (3c) gives a good prediction of the particle size dependence of the critical rolling force. However, as displayed in Fig. 4, is underestimated when a reduced particle stiffness and the corresponding reduced surface energy are used. The reason is that the critical rolling resistance in Eq. (3c) is proportional to the surface energy but is independent of particle stiffness. An easy and intuitive way to retain the original value of the critical rolling resistance is to use the real surface energy to calculate the rolling resistance. Substituting in Eq. (3c) with , we have:
| (11) |
In some particular cases, where the friction coefficient is small enough (usually smaller than ) to yield , irreversible sliding will be triggered before rolling [Liu et al., 2017b, 2016b]. In such conditions, one should calculate the critical sliding forces in Eq. (3a) using original value of particle properties, i.e.,
| (12) |
where the critical pull-off force, , in Eq. (3a) is again calulated using the original value of the particle surface energy .
3 An inversion procedure to set parameters in adhesive DEM
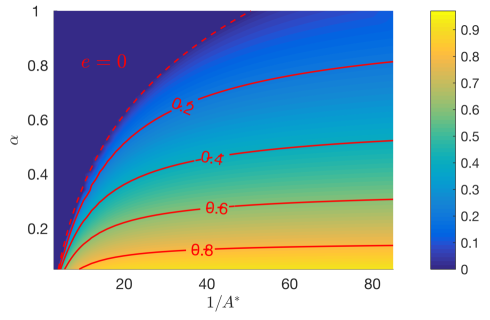
A principle for setting parameters in the framework of fast adhesive DEM with reduced stiffness is proposed in this section. Based on Eq. (8a), the parameters to be determined include the damping coefficient , a reduced particle Young’s modulus and a reduced surface energy . Ohter parameters in Eq. (8a) can be easily determined from direct measurement (particle density and radius ) or is regarded as an input parameter for simulations (initial velocity ). In Eq. (7), and are the only parameters that will affect the result (i.e., the coefficient of restitution .) The contour plot in Fig. 5 shows the value of restitution coefficient as a function of damping coefficient and . We use instead of because scales as and the initial collision velocity is usually a well-controlled parameter in experiments. Several interesting features can be observed: (1) there is a sticking region () when both and are large values; (2) with a large value of , has a weak dependence on and is mainly determined by the dissipation coefficient . For instance, at , the contour lines with and are nearly parallel to the abscissa axis. For any given , the coutor lines approximately follow an exponential form. Based on this observation, we assume an exponential relation between and with the fitting parameters , and determined by .
| (13) |
We fit the coutor lines in Fig. 5 using Eq. (13) with varing from to . And the fitting parameters , and are all inversely calculated from through three-order polynomial fittings (as shown in Fig. 6).
| (14a) | ||||
| (14b) | ||||
| (14c) | ||||
Based on Eqs. (13) and (14), an inversion procedure to determine the value of and in DEM from the experimental data is proposed as:
-
(a)
Use Eq. (14c) to determine according to the value of at high-velocity state ().
-
(b)
Pick another typical point on curve, , and calculate corresponding , and through Eq. (14).
-
(c)
Using the values of obtained from step (a) and the parameters , and from (b), calculate inversely from Eq. (13): .
-
(d)
Choose pseudo Young’s modulus and surface energy , which are usually much smaller than their original values and , and make sure (see Eq. (9)).
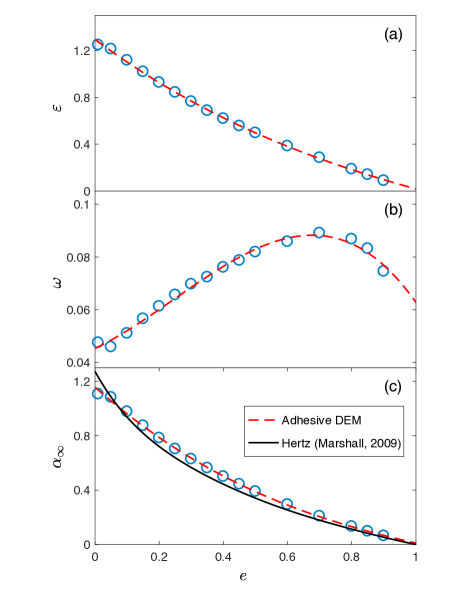
Step (a) is extended from the relationship in non-adhesive collision cases, where is almost a constant that is determined by damping coefficient . Therefore, for non-adhesive particles, one can calculate damping coefficient inversely from . In Fig. 6 (c), we plot such a correlation: , which is proposed by [Marshall, 2009]. When an adhesive particle collides with a wall, is zero if is smaller than the critical sticking velocity . As increases, will first increase and then enter a plateau, corresponding to the region in Fig. 5. In the high-velocity state, the amount of energy dissipated due to viscoelasticity is much larger than that of first-contact loss (i.e., necking effect). As a result, the function reduces to a single-parameter function and we relate to through Eq. (14c) (Step (a)). As shown in Fig. 6 (c), there is only a slight difference between the curve calculated from adhesive DEM and that from Hertz model.
Recall that is a function of particle properties and the velocity. One may expect to determine according to the real physical properties of the particle and further predict the restitution coefficient . However, these parameters are usually not readily available. For example, the surface energy is strongly affected by the surface roughness and the ambient humidity and is usually hard to determine. In addition, to accelerate the computation, a reduced Young’s modulus instead of its true value is often needed. From step (b) to (d), we suggest one to alternatively select another typical point on a prescribed curve that is outside the high-velocity region and use Eq. (13) to obtain the corresponding and to further get the value of through , which can reproduce the prescribed curve.
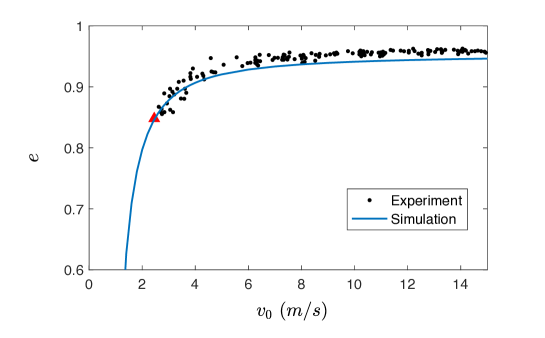
In Fig. 7 we present an example of the inversion procedure based on the experimental data of [Dahneke, 1975]: (a) Use Eq. (14c) and the coefficient of restitution in the high-velocity region, , to obtain ; (b) Pick a typical point () on curve – here we use the point (), indicated by the triangle in Fig. 7 – and then calculate the fitting parameters , and at , then (c) solve Eq. (13) to obtain . (d) Determine the value of through: . The value obtained in this way is quite close to the value calculated using physical properties of polystyrene particles (PSL): [Sümer & Sitti, 2008]. At last, pick a reduced Young’s modulus and calculate the modified . As shown in Fig. 7, the curve calculated from well reproduces the experimental measurements [Dahneke, 1975]. A large number of research has reported experimental results of curves [Wall et al., 1990, Dunn et al., 1995, Li et al., 1999, Kim & Dunn, 2008, Sorace et al., 2009], and the proposed inversion procedure is easy to run to assist the selection of contact parameters before large-scale DEM simulations.
4 Test on packing problem
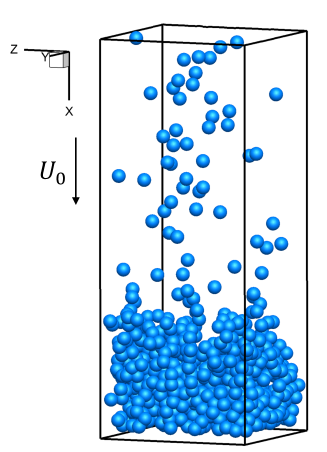
To check if the fast adhesive DEM can reproduce the results calculated using original particle properties in cases associated with aggregates. We run a large number of cases on the packing problem. As shown in Fig. 8, we consider ballistic falling of particles. Particles have radius and initial velocity and are randomly added into the computational domain from an inlet plane at height . Periodic boundary conditions are set along and directions with box length . The physical parameters used in our simulations are set according to the properties of polystyrene (PS) particle in [Sümer & Sitti, 2008], which has the density , Young’s modulus , surface energy , friction coefficient , and the critical rolling angle . A vacuum condition is assumed to filter out fluid effect. Gravity effect can be neglected since the Froude number, of our system satisfies . This ballistic packing system has been widely used in both experimental [Blum & Schräpler, 2004, Parteli et al., 2014] and numerical [Yang et al., 2000, 2013, Liu et al., 2015, 2016b, 2017a, 2017b] studies and has been proved to be useful to bridge the gap between the particle-level interactions and the macroscopic structure of aggregates [Chen et al., 2016a, Baule et al., 2018].
To understand how to simulate the packing process in the framework of fast adhesive DEM with reduced stiffness, we set 4 series of computational experiments (listed in Table 1): in the cases of series S, we use the original value of the elastic modulus and surface energy and the results can be regarded as a benchmark case; in series A, reduced elastic modulus is used without modification of the surface energy; in series B, we use the same elastic modulus as those in A and modify the surface energy according to ; series C is essentially the same as series B except that the rolling stiffness is calculated based on the original surface energy, i.e., . For each case, at least 10 final configurations are obtained to provide a meaningful average and standard deviation. According to the analysis in Section 2, the packing structure is essentially determined by three parameters: the damping coefficient , which is fixed here, the dimensionless adhesive parameter , and the elasticity parameter . To separately tune the value of at given , we fixed the velocity and varied the particle size in our simulation.
| Parameters | |||||
|---|---|---|---|---|---|
| S | 0.05 | ||||
| A-1 | |||||
| A-2 | 0.05 | ||||
| A-3 | |||||
| B-1 | 0.0293 | ||||
| B-2 | 0.0222 | ||||
| B-3 | 0.0117 | ||||
| C-1 | 0.0293 | ||||
| C-2 | 0.0222 | ||||
| C-3 | 0.0117 |
4.1 Packing fraction and coordination number
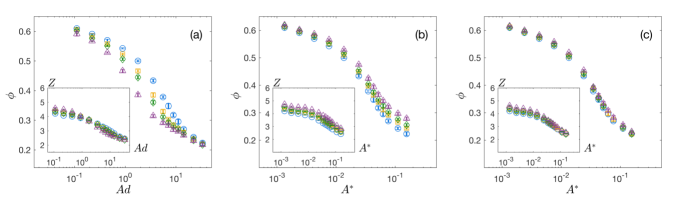
Fig. 9 (a)-(c) show the variation of packing fraction and coordination number as functions of adhesion parameter for series A, B and C, respectively. To avoid the wall effect, both and are calculated from the middle part of the packing (, with as packing height). The blue circles in the three panels are data for cases S. From Fig. 9 (a), one can draw the conclusion that the reduction of the particle stiffness obviously decreases the packing fraction. This effect is more prominent in the range of moderate . With a low adhesion number and a high , the packing fraction converges to the random close packing limit (RCP) and the adhesive loose packing limit (ALP), respectively, [Liu et al., 2015, 2017b] and the difference in due to stiffness is totally prevented. In contrast to , the coordination number only has a weak dependence on particle stiffness. This interesting phenomenon may be understood through an analysis of the mechanical equilibrium of the packing. For a given contact network of a packing, mechanical stable condition is achieved with force- and torque-balance on all particles under the constraint ( is , or ). According to Eq. (3a) and (3c), the critical value is independent of particle stiffness. A packing of harder particles can have each particle balanced at a similar coordination number as the packing of softer particles. However, before the final mechanical equilibrium is achieved, the kinetic energy of particles needs to be dissipated. A softer particle has a better capability of energy dissipation and is more likely to stick onto packed particles upon collisions, limiting its movement along the direction. In contrast, a particle with higher stiffness needs more times of collisions to be captured, which may lead to a compaction of the packing.
When the surface energy is modified according to Eq. (10), both the packing fraction and the coordination number increases for particles with reduced stiffness and the case with higher reduced ratio tends to have a denser structure. Note that, in Fig. 9 (b) and 9 (c), we choose to use instead of as the abscissa, because the modification of surface energy will shift the data points in plane. The difference in due to the reduction of the stiffness is, to some extent, balanced by the modification of the surface energy. However, there still remains considerable discrepancy. This discrepancy again can be attributed to the mechanical equilibrium: a reduction of surface energy causes the decrease of the critical value of rolling resistances , which practically puts stricter constraints on the force- and torque-balance of particles. A packing with smaller generally needs more contacts to achieve mechanical equilibrium. These results, combined with the curves in Fig. 3, indicate that an exactly same particle-particle normal collision behavior does not ensure the same results of packing structure.
In the last case, we modify the surface energy when calculating the normal forces but maintain the original value of the rolling stiffness . As shown in Fig. 9 (c), the packings simulated with reduced stiffness well reproduce the structure, both and , of the original packings. This result confirms our statement that the critical value of rolling resistance strongly affects the mechanical equilibrium of a packing. In the framework of adhesive DEM with reduced stiffness, similarities in both particle-particle collision behavior and mechanical constraints are necessary to simulate a packing process. The friction coefficient is kept unchanged during the entire simulation since the value () we use is large enough to ensure that rolling rather than sliding is the dominant mode of deformation of the packing. If the particles have a small friction coefficient, which is usually smaller than , the sliding motion between contact particles will become non-negligible [Liu et al., 2016b, 2017b], and one should modify the critical value of according to Eq. (12)
4.2 Local structure of packings
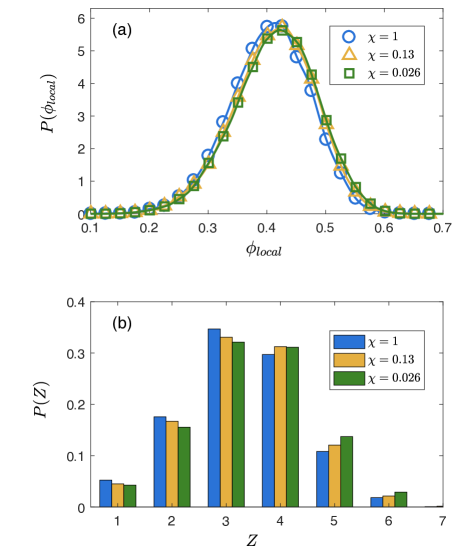
To further validate the fast adhesive DEM, we do statistics of the local structure of each particle inside a packing. We calculate the local packing fraction of each particle, which is expressed as
| (15) |
where is the volume of a particle and is the volume of its Voronoi cell. Fig. 10 shows the distributions of and coordination number of each particle for the case S, C-2, and C-3 at . We choose this value because it locates in the transition region between RCP and ALP and packings in this region are more sensitive to the particle stiffness. There is a very good agreement between the PDFs obtained from original packings and from packings with reduced stiffness.
4.3 Interparticle overlaps and normal forces
One of the most important properties needs to be checked is the interparticle overlap, which usually puts a restriction on reducing the particle stiffness. Interparticle overlap significantly affects the heat or charge transfer between heated particles or charged particles [Batchelor & O’Brien, 1977, Moysey & Thompson, 2005, Jin & Marshall, 2017]. However, there is no universal criterion for choosing a limit of interparticle overlap. For example, it has been pointed out that the flow pattern on a bumpy inclined chute was not sensitive to stiffness when the interparticle overlap is smaller than of the particle diameter [Hanes & Walton, 2000]. In a measurement of the angle of repose, to retain the results, an overlap smaller than was suggested [Lommen et al., 2014]. Based on a broad review of different simulation tasks, Paulick et al. [2015] argued that, when the particle overlap is kept smaller than of the particle diameter, there would be no major change in the simulation result.
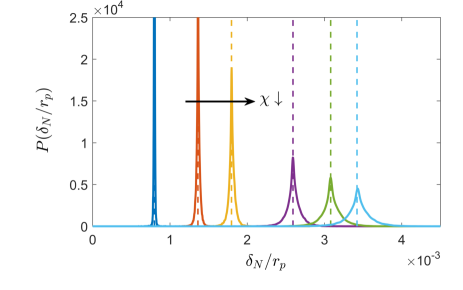
In Fig. 11, we show the distributions of interparticle overlaps for Case S, C-1, C-2 and C-3 (corresponding to , 0.26, 0.132, and 0.026) at . Two extra reduced ratios, and , are also added. It is easy to understand that, as particle stiffness decreases, the distributions move to larger . The interparticle overlaps are almost symmetrically distributed around the equilibrium value (indicated by the dashed vertical lines), which results from the balance between van der Waals attraction and the elastic repulsion. can be calculated written as:
| (16) |
The symmetry in the distributions of interparticle overlap and normal force is a key feature of a static packing of strong adhesive particles [Liu et al., 2016b]. In Fig. 11, the values of increases from at to at , which is still within the range, , suggested in [Paulick et al., 2015]. From Eq. (16), one can easily evaluate the effect of reduction of stiffness on interparticle overlaps
| (17) |
This scaling allows users to determine a feasible amount of stiffness reduction once the constraint is put on the interparticle overlap.
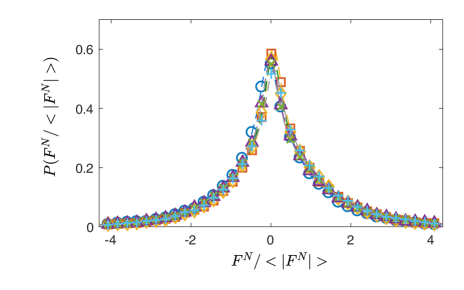
It is also of great interest to know what the force distribution is like in packings, especially, in loose packings with adhesive particles. Here we measure the normal force of each contact in the same packings as those in Fig. 11. As displayed in Fig. 12, the forces could be both attractive (negative ) and repulsive (positive ). After normalizing in each case with the corresponding mean value of its magnitude, , distributions with different nicely collapse onto a single curve. The normalized distributions are almost symmetrical around , which is in good agreement with previous results on the packing of strong adhesive particles Liu et al. [2016b]. The results again verify that the fast adhesive DEM with reduced particle stiffness can retain both the structural and mechanical properties of the contact network in a packing.
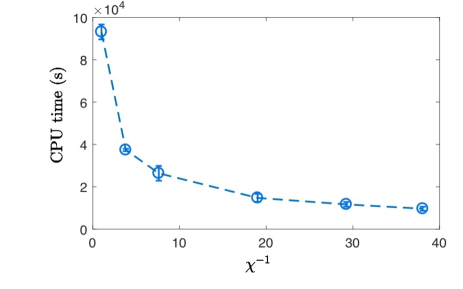
At last, we report the timing results for the simulation of packings in Fig. 11. Timing is measured on a computing node with 20-core Intel (R) Xeon (R) E5-2660 V3 running at 2.60 GHz and 128GB memory. The results in Fig. 13 indicate that reducing the particle stiffness by 1 or 2 orders of magnitude can shorten 5 times the computation time, however, further reduction in does not guarantee an obvious speedup. Combining the timing results and the scaling of interparticle overlap, we suggest that a reduction of stiffness by orders of magnitude can remarkably accelerate the simulation and retain both micro- and macroscopic properties of a static packing of adhesive particles.
5 Discussion and Conclusions
Based on the dimensionless equation describing the collision between a particle and a wall, we have been able to propose a scaling relationship to reduce particle’s stiffness (i.e., particle’s Young’s modulus) and surface energy simultaneously. It allows one to use larger time steps to resolve the collision and ensure that the results stay the same. With a simple but indispensable modification of the rolling and sliding resistances, this accelerated JKR-based DEM can be feasibly applied to simulations of static packings of adhesive particles. Structural proprieties, including the overall packing fraction, the averaged coordination number and the distributions of local packing fraction and coordination number of each particle, are in good agreement with the packings simulated using the original parameters.
The current paper also presents a novel inversion method, which helps users to set the damping coefficient, particle stiffness and surface energy to reproduce a prescribed curve. This inversion method is different from previous calibration approaches, in which iterative procedure is normally used and the parameters are tuned to match the bulk response of the material to measured results [Coetzee, 2017]. Compared with these calibration approaches, our approach uses practical formulas for a direct calculation avoiding complicated iteration process. Indeed, one can also determine the parameters based on a direct measurement of them at particle or contact level. However, experimental measurements are usually limited by particle sizes, and parameters like damping coefficient cannot be directly measured. Even if property values can be accurately measured, it is not guaranteed that the DEM model would show expected accuracy on the bulk level [Simons et al., 2015]. We suggest that the proposed inversion method should be used in combination with direct measuring approach. Parameters such as particle size and density are usually measured directly from experiments.
For the packing problem studied here, the final packing structures are essentially determined by particle-particle contact interactions, including (1) collisions between the incoming particles and the packed particles, which dissipate the kinetic energy of particles and (2) force- and torque-balance on all particles that ensures the mechanical stability of the packing. The reduced stiffness scaling and the inversion procedure proposed in this paper ensure the analogy in collisions (step (1)), and the modification of the resistances ensures the constraints on solving forces and torques for a given contact network (step (2)) are not affected by the reduction of stiffness. By now, we have neglected the effect of external forces, which actually exits in a variety of particulate systems. Typical external forces include fluid drag, gravity [Fan et al., 2014], electrostatic forces [Kolehmainen et al., 2016, Chen et al., 2018], etc. For particle systems with external forces, there should be an additional term, , in Eq. (7):
| (18) |
where is the non-dimensional form of the external force. As suggested in [Washino et al., 2018], should be modified to ensure . However, we note that such modification may be reasonable only if the particle is in contact with other particles. For a free particle, one should use the original value of to get a meaningful value of particle’s acceleration. A system containing both aggregates and individual free particles, such as a fluidized bed with gas flow rate around the minimum fluidization value, should be used to calibrate the fast adhesive DEM in the future.
Acknowledgements
SQL acknowledges support from the National Fund for Distinguished Young Scholars of China (51725601) and National Key Research and Development Program of China (2016YFB0600602). We are grateful to Prof. Jeff Marshall at Vermont, Prof. Q. Yao and Prof. Y. Zhang at Tsinghua for their useful suggestions.
References
References
- Batchelor & O’Brien [1977] Batchelor, G., & O’Brien, R. (1977). Thermal or electrical conduction through a granular material. Proceedings of the Royal Society of London. Series A, Mathematical and Physical Sciences, (pp. 313–333).
- Baule et al. [2018] Baule, A., Morone, F., Herrmann, H. J., & Makse, H. A. (2018). Edwards statistical mechanics for jammed granular matter. Reviews of Modern Physics, 90, 015006.
- Blum & Schräpler [2004] Blum, J., & Schräpler, R. (2004). Structure and mechanical properties of high-porosity macroscopic agglomerates formed by random ballistic deposition. Physical Review Letters, 93, 115503.
- Chen et al. [2016a] Chen, S., Li, S., Liu, W., & Makse, H. A. (2016a). Effect of long-range repulsive coulomb interactions on packing structure of adhesive particles. Soft Matter, 12, 1836–1846.
- Chen et al. [2015] Chen, S., Li, S., & Yang, M. (2015). Sticking/rebound criterion for collisions of small adhesive particles: Effects of impact parameter and particle size. Powder Technology, 274, 431–440.
- Chen et al. [2016b] Chen, S., Liu, W., & Li, S. (2016b). Effect of long-range electrostatic repulsion on pore clogging during microfiltration. Physical Review E, 94, 063108.
- Chen et al. [2018] Chen, S., Liu, W., & Li, S. (2018). Scaling laws for migrating cloud of low-reynolds-number particles with coulomb repulsion. Journal of Fluid Mechanics, 835, 880–897.
- Chokshi et al. [1993] Chokshi, A., Tielens, A., & Hollenbach, D. (1993). Dust coagulation. The Astrophysical Journal, 407, 806–819.
- Coetzee [2017] Coetzee, C. (2017). Calibration of the discrete element method. Powder Technology, 310, 104–142.
- Cundall & Strack [1979] Cundall, P. A., & Strack, O. D. (1979). A discrete numerical model for granular assemblies. Geotechnique, 29, 47–65.
- Dahneke [1975] Dahneke, B. (1975). Further measurements of the bouncing of small latex spheres. Journal of Colloid and Interface Science, 51, 58–65.
- Dominik [1997] Dominik, C. (1997). Dust coagulation and the structure of dust aggregates in space. Astrophysical Journal, 480, 647.
- Dunn et al. [1995] Dunn, P. F., Brach, R. M., & Caylor, M. J. (1995). Experiments on the low-velocity impact of microspheres with planar surfaces. Aerosol Science and Technology, 23, 80–95.
- Fan et al. [2014] Fan, Y., Schlick, C. P., Umbanhowar, P. B., Ottino, J. M., & Lueptow, R. M. (2014). Modelling size segregation of granular materials: the roles of segregation, advection and diffusion. Journal of Fluid Mechanics, 741, 252–279.
- Gu et al. [2016] Gu, Y., Ozel, A., & Sundaresan, S. (2016). A modified cohesion model for cfd-dem simulations of fluidization. Powder Technology, 296, 17–28.
- Hærvig et al. [2017] Hærvig, J., Kleinhans, U., Wieland, C., Spliethoff, H., Jensen, A. L., Sørensen, K., & Condra, T. J. (2017). On the adhesive jkr contact and rolling models for reduced particle stiffness discrete element simulations. Powder Technology, 319, 472–482.
- Hakim et al. [2005] Hakim, L. F., Portman, J. L., Casper, M. D., & Weimer, A. W. (2005). Aggregation behavior of nanoparticles in fluidized beds. Powder Technology, 160, 149–160.
- Hanes & Walton [2000] Hanes, D. M., & Walton, O. R. (2000). Simulations and physical measurements of glass spheres flowing down a bumpy incline. Powder Technology, 109, 133–144.
- Jin & Marshall [2017] Jin, X., & Marshall, J. S. (2017). The role of fluid turbulence on contact electrification of suspended particles. Journal of Electrostatics, 87, 217–227.
- Johnson et al. [1971] Johnson, K., Kendall, K., & Roberts, A. (1971). Surface energy and the contact of elastic solids. Proc. R. Soc. Lond. A, 324, 301–313.
- Kim & Dunn [2008] Kim, O., & Dunn, P. (2008). Direct visualization and model validation of microsphere impact and surface capture. Journal of Aerosol Science, 39, 373–375.
- Kobayashi et al. [2013] Kobayashi, T., Tanaka, T., Shimada, N., & Kawaguchi, T. (2013). Dem-cfd analysis of fluidization behavior of geldart group a particles using a dynamic adhesion force model. Powder Technology, 248, 143–152.
- Kolehmainen et al. [2016] Kolehmainen, J., Ozel, A., Boyce, C. M., & Sundaresan, S. (2016). A hybrid approach to computing electrostatic forces in fluidized beds of charged particles. AIChE Journal, 62, 2282–2295.
- Li et al. [2011] Li, S., Marshall, J. S., Liu, G., & Yao, Q. (2011). Adhesive particulate flow: The discrete-element method and its application in energy and environmental engineering. Progress in Energy and Combustion Science, 37, 633–668.
- Li & Marshall [2007] Li, S.-Q., & Marshall, J. (2007). Discrete element simulation of micro-particle deposition on a cylindrical fiber in an array. Journal of Aerosol Science, 38, 1031–1046.
- Li et al. [1999] Li, X., Dunn, P., & Brach, R. (1999). Experimental and numerical studies on the normal impact of microspheres with surfaces. Journal of Aerosol Science, 30, 439–449.
- Liu et al. [2016a] Liu, P., LaMarche, C. Q., Kellogg, K. M., & Hrenya, C. M. (2016a). Fine-particle defluidization: Interaction between cohesion, young׳ s modulus and static bed height. Chemical Engineering Science, 145, 266–278.
- Liu et al. [2017a] Liu, W., Chen, S., & Li, S. (2017a). Influence of adhesion on random loose packings of binary microparticle mixtures. AIChE Journal, 63, 4296–4306.
- Liu et al. [2017b] Liu, W., Jin, Y., Chen, S., Makse, H. A., & Li, S. (2017b). Equation of state for random sphere packings with arbitrary adhesion and friction. Soft matter, 13, 421–427.
- Liu et al. [2015] Liu, W., Li, S., Baule, A., & Makse, H. A. (2015). Adhesive loose packings of small dry particles. Soft Matter, 11, 6492–6498.
- Liu et al. [2016b] Liu, W., Li, S., & Chen, S. (2016b). Computer simulation of random loose packings of micro-particles in presence of adhesion and friction. Powder Technology, 302, 414–422.
- Lommen et al. [2014] Lommen, S., Schott, D., & Lodewijks, G. (2014). Dem speedup: Stiffness effects on behavior of bulk material. Particuology, 12, 107–112.
- Luo et al. [2017] Luo, Z., Zhou, H., Zhang, T., You, Y., Zhang, L., Zou, Z., & Shen, Y. (2017). Dem study of blockage behaviour of cohesive fine particles in a packed structure of large particles. Powder Technology, 314, 102–109.
- Marshall [2009] Marshall, J. (2009). Discrete-element modeling of particulate aerosol flows. Journal of Computational Physics, 228, 1541–1561.
- Marshall & Li [2014] Marshall, J. S., & Li, S. (2014). Adhesive particle flow. Cambridge University Press.
- Moreno-Atanasio et al. [2007] Moreno-Atanasio, R., Xu, B., & Ghadiri, M. (2007). Computer simulation of the effect of contact stiffness and adhesion on the fluidization behaviour of powders. Chemical Engineering Science, 62, 184–194.
- Moysey & Thompson [2005] Moysey, P., & Thompson, M. (2005). Modelling the solids inflow and solids conveying of single-screw extruders using the discrete element method. Powder Technology, 153, 95–107.
- Parteli et al. [2014] Parteli, E. J., Schmidt, J., Blümel, C., Wirth, K.-E., Peukert, W., & Pöschel, T. (2014). Attractive particle interaction forces and packing density of fine glass powders. Scientific Reports, 4, 6227.
- Paulick et al. [2015] Paulick, M., Morgeneyer, M., & Kwade, A. (2015). Review on the influence of elastic particle properties on dem simulation results. Powder Technology, 283, 66–76.
- Payatakes & Gradoń [1980] Payatakes, A., & Gradoń, L. (1980). Dendritic deposition of aerosol particles in fibrous media by inertial impaction and interception. Chemical Engineering Science, 35, 1083–1096.
- Simons et al. [2015] Simons, T. A., Weiler, R., Strege, S., Bensmann, S., Schilling, M., & Kwade, A. (2015). A ring shear tester as calibration experiment for dem simulations in agitated mixers–a sensitivity study. Procedia Engineering, 102, 741–748.
- Sorace et al. [2009] Sorace, C., Louge, M., Crozier, M., & Law, V. (2009). High apparent adhesion energy in the breakdown of normal restitution for binary impacts of small spheres at low speed. Mechanics Research Communications, 36, 364–368.
- Sümer & Sitti [2008] Sümer, B., & Sitti, M. (2008). Rolling and spinning friction characterization of fine particles using lateral force microscopy based contact pushing. Journal of Adhesion Science and Technology, 22, 481–506.
- Sundaresan et al. [2018] Sundaresan, S., Ozel, A., & Kolehmainen, J. (2018). Toward constitutive models for momentum, species, and energy transport in gas–particle flows. Annual Review of Chemical and Biomolecular Engineering, .
- Tsuji et al. [1993] Tsuji, Y., Kawaguchi, T., & Tanaka, T. (1993). Discrete particle simulation of two-dimensional fluidized bed. Powder technology, 77, 79–87.
- Tsuji et al. [1992] Tsuji, Y., Tanaka, T., & Ishida, T. (1992). Lagrangian numerical simulation of plug flow of cohesionless particles in a horizontal pipe. Powder technology, 71, 239–250.
- Valverde et al. [2004] Valverde, J., Quintanilla, M., & Castellanos, A. (2004). Jamming threshold of dry fine powders. Physical Review Letters, 92, 258303.
- Wall et al. [1990] Wall, S., John, W., Wang, H.-C., & Goren, S. L. (1990). Measurements of kinetic energy loss for particles impacting surfaces. Aerosol Science and Technology, 12, 926–946.
- Washino et al. [2018] Washino, K., Chan, E. L., & Tanaka, T. (2018). Dem with attraction forces using reduced particle stiffness. Powder Technology, 325, 202–208.
- Wei et al. [2018] Wei, M., Zhang, Y., Luo, X., Li, X., Wu, X., & Zhang, Z. (2018). Graphite dust deposition on htgr steam generator: Effects of particle-wall and particle-vortex interactions. Nuclear Engineering and Design, 330, 217–224.
- Xiao et al. [2016] Xiao, H., Umbanhowar, P. B., Ottino, J. M., & Lueptow, R. M. (2016). Modelling density segregation in flowing bidisperse granular materials. Proc. R. Soc. A, 472, 20150856.
- Yang et al. [2000] Yang, R. Y., Zou, R. P., & Yu, A. B. (2000). Computer simulation of the packing of fine particles. Phys Rev E Stat Phys Plasmas Fluids Relat Interdiscip Topics, 62, 3900–3908.
- Yang et al. [2013] Yang, S., Dong, K., Zou, R., Yu, A., & Guo, J. (2013). Packing of fine particles in an electrical field. Granular Matter, 15, 467–476.
- Zhu et al. [2008] Zhu, H., Zhou, Z., Yang, R., & Yu, A. (2008). Discrete particle simulation of particulate systems: a review of major applications and findings. Chemical Engineering Science, 63, 5728–5770.